BAC21 Marketing Project: Analyzing Soft Drink Market at USC University

Verified

Added on  2023/06/09

|8
|1332
|282
Report
AI Summary
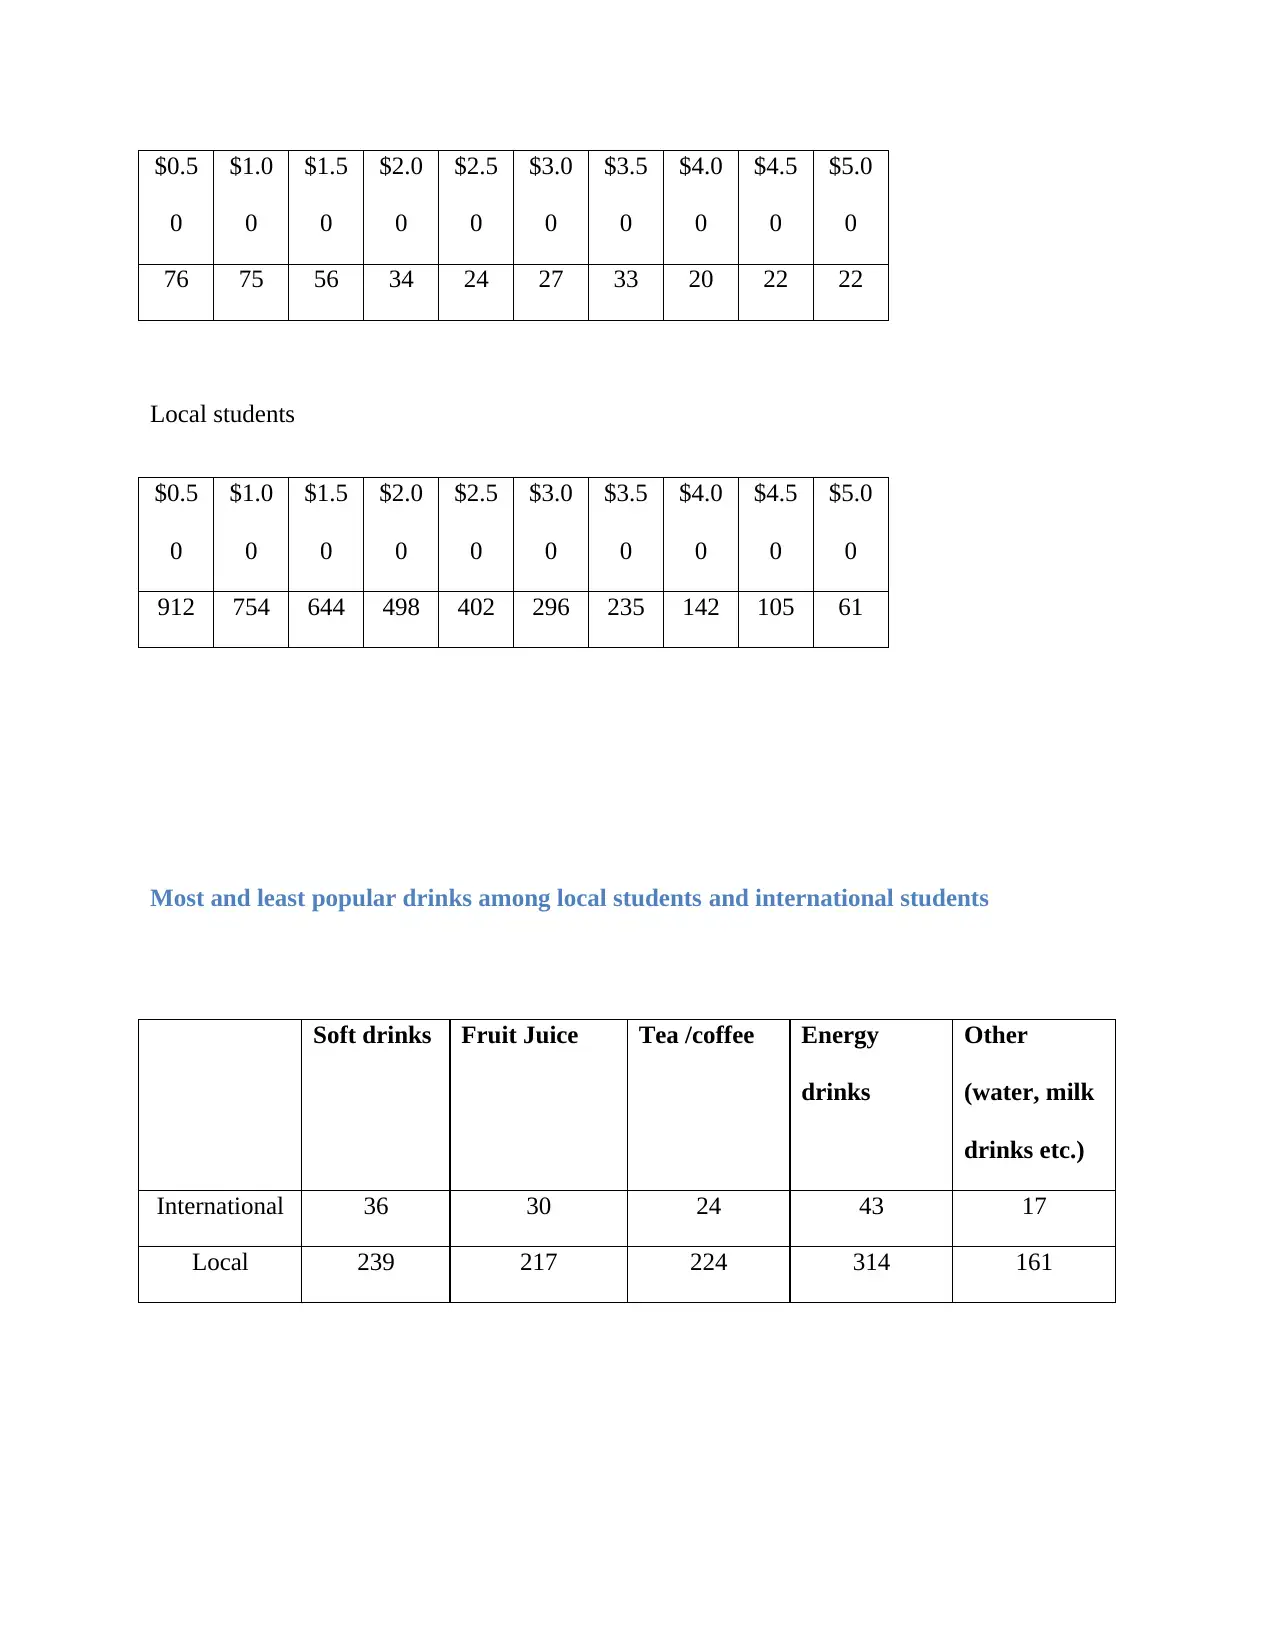
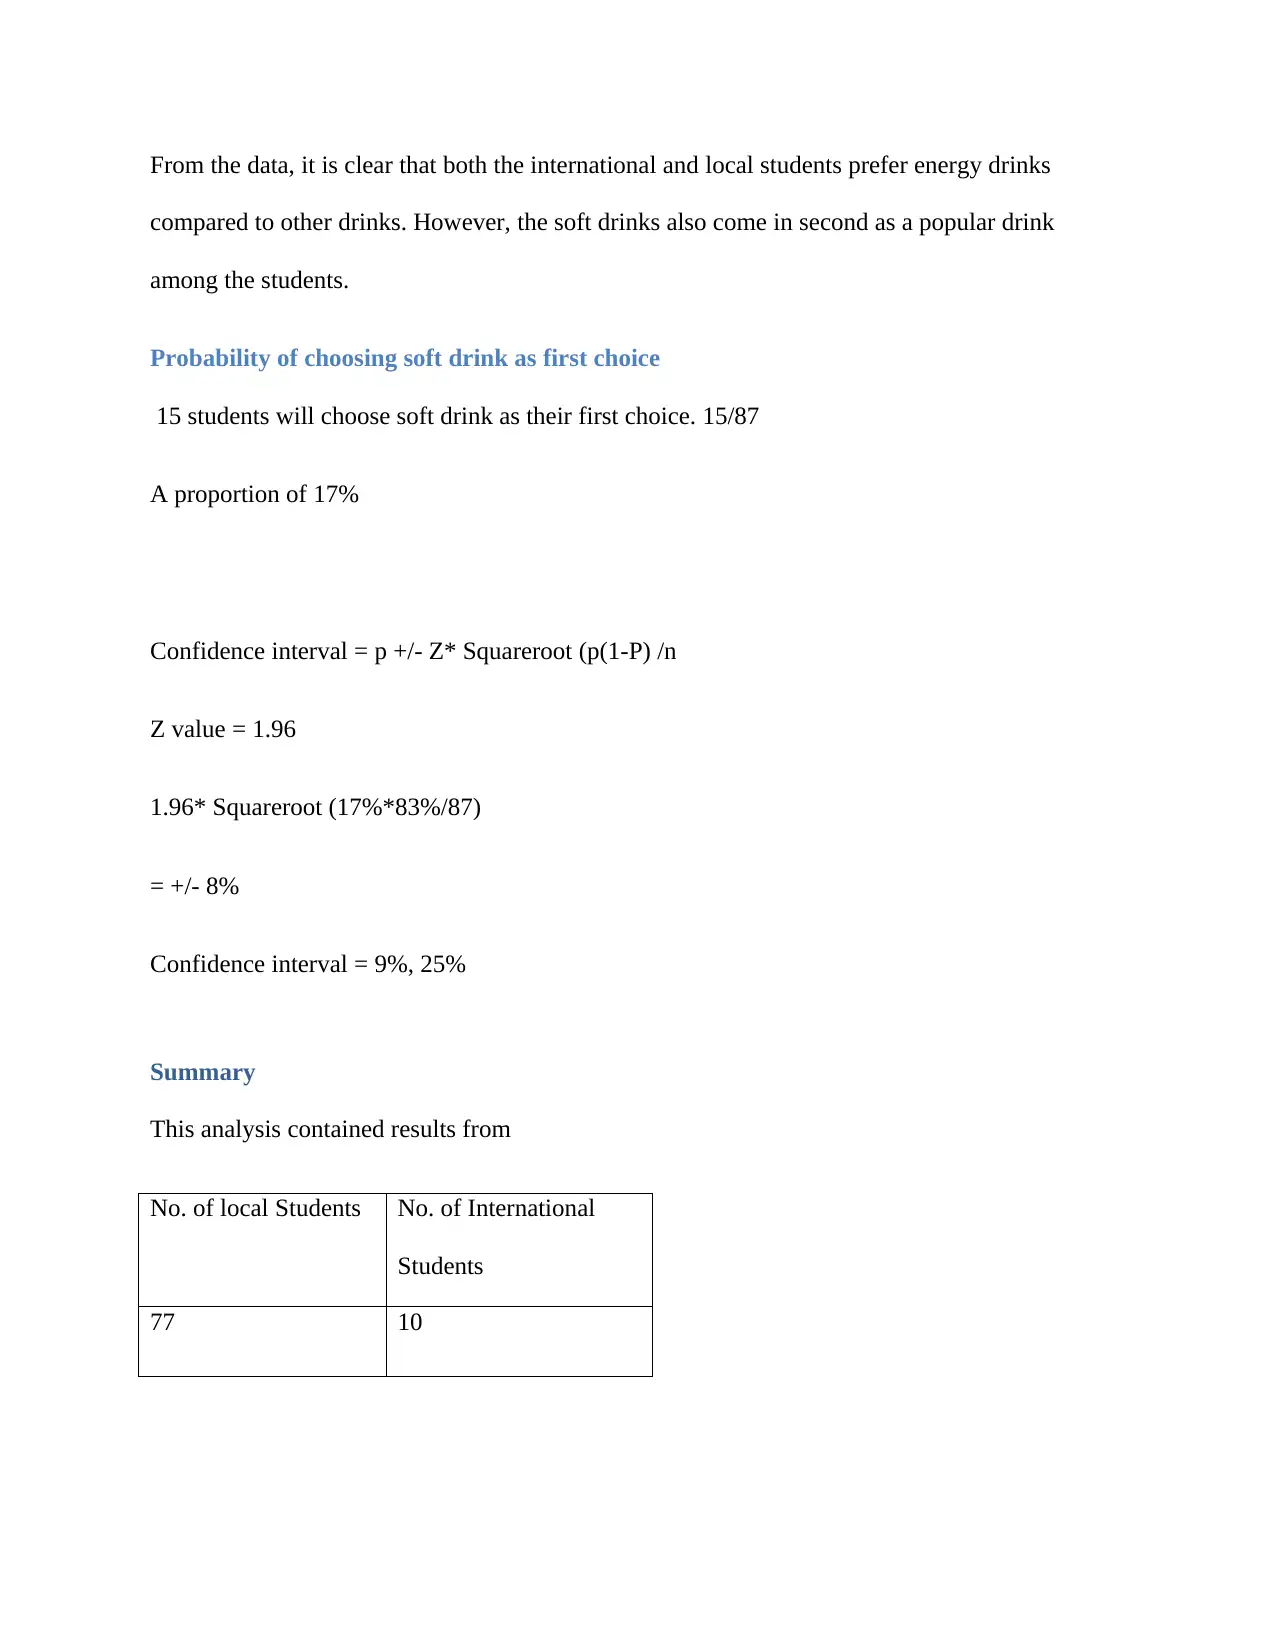
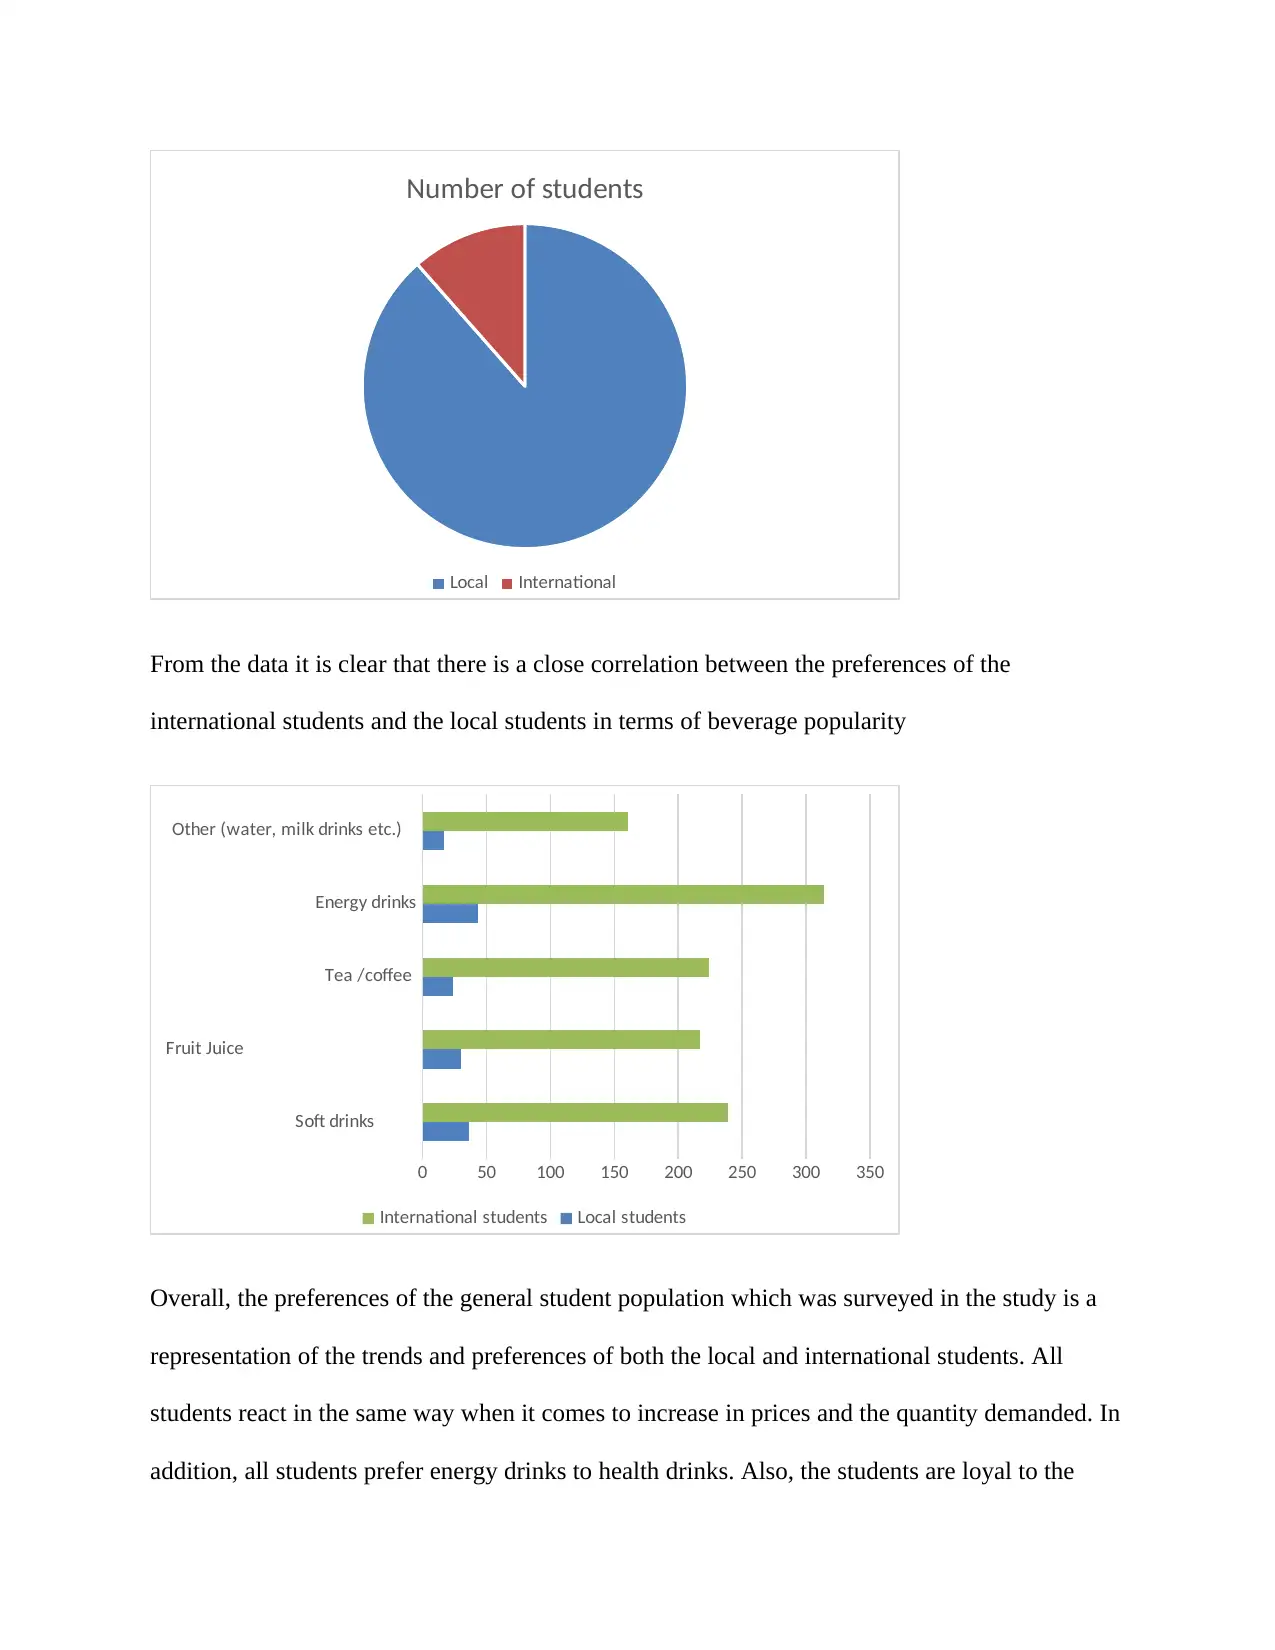
This report analyzes data collected from a survey of university students, both local and international, to understand the soft drink market at USC. The study examines the proportion of local to international students, the relationship between price and quantity consumed, and the popularity of different beverages. It also investigates brand loyalty versus discount incentives and compares the demand and preferences of local and international students. The analysis reveals that energy drinks and soft drinks are more popular than water and milk drinks. Student loyalty is affected by the amount of discount offered, and both local and international students exhibit similar consumption patterns in response to price changes. The study concludes that student preferences are largely consistent across both local and international demographics, with energy drinks being the preferred choice, and that price sensitivity and discount incentives play significant roles in purchasing decisions. Desklib provides access to similar reports and solved assignments for students.
Document Page
Contents
Introduction......................................................................................................................................2
Data Analysis...................................................................................................................................2
Proportion of Students in analysis...............................................................................................2
Price and average quantity consumed..........................................................................................2
Popular & least popular soft drinks..............................................................................................2
Loyalty vs Discount.....................................................................................................................3
Demand of International Students................................................................................................3
Most and least popular drinks among local students...................................................................3
Chances of soft drink (Pepsi, coke etc. )......................................................................................4
Summary..........................................................................................................................................4
References........................................................................................................................................6
tabler-icon-diamond-filled.svg

Paraphrase This Document

Need a fresh take? Get an instant paraphrase of this document with our AI Paraphraser
Document Page
Introduction
The aim of this report is to analyze data from university students concerning the types of
beverages which are most popular to the students as well as the effect of changes in price to
consumption of the drinks. The study also compares consumption between the local and
international students.
Data Analysis
Proportion of Students in analysis
The analysis was conducted in various institutions considering both local and international
students. The student average of the proportion of local to international students is 8:1. The
international students composed of students from Asia and parts of Europe.
Price and average quantity consumed
From the data, it is clear that the price of the drinks has a negative relationship to the quantity
demanded. Increase in price leads to a decrease in the total intake of drinks as per the students in
the survey. This indicates that as much as beverages are important for the students, there are
other items which are important and increase in price of the beverages may make the student be
less inclined to purchase he beverages. The table below shows a sum total of the units of
beverages which would be purchased by the students in case they experienced an increase in
price which shows a general decline in consumption.
Serial no. Price Total Intake by 90
Students
1. $0.50 988
Document Page
2. $1.00 829
3. $1.50 700
4. $2.00 532
5. $2.50 426
6. $3.00 323
7. $3.50 268
8. $4.00 162
9. $4.50 127
10. $5.00 83
Popular & least popular soft drinks
From the data, it is clear that the popular drinks among the student seem to be more inclined to
drinking energy drinks and soft drinks compared to water and milk drinks. This is clear since
from the survey when they were asked about which beverages they would prefer above other
drinks they selected energy drinks more than all the other drinks (Chatfield, 2018). This could
indicate that since the students require energy for sports activities, they would require energy
drinks for their activities. Also, the might require energy drinks in order to study well at night.
The students may not prefer water since it is part of their day to day lives and therefore they
might not be strongly inclined to their consumption (Chambers, 2017).
Document Page
Soft drinks Fruit Juice Tea /coffee Energy drinks Other (water,
milk drinks etc.)
275 247 248 357 178
Loyalty vs Discount
In terms of loyalty to brand, it is clear that the students will be loyal to their preferred brand in
the case they receive a 25% discount but may shift preferences in case they receive a higher
discount of 40% discount. For instance, 24 students out of 87 students said that they will change
their preferences while 63 students said that they would not change their preferences. When the
discount changed from 25% to 40%, 52 of the students said that they would change their
preferences. To sum, the level of student loyalty is affected by the amount of discount that the
students expect.
Demand of International Students
From the study it is clear that the demand of the international students and that of the local
students is more or less similar. There is a decrease in consumption with an increase in price.
This shows that both the local and international students are both influenced by similar factors
which affect the demand of the products in relation to a price increase (Cox, 2018).
International students
tabler-icon-diamond-filled.svg

Paraphrase This Document

Need a fresh take? Get an instant paraphrase of this document with our AI Paraphraser
Document Page
$0.5
0
$1.0
0
$1.5
0
$2.0
0
$2.5
0
$3.0
0
$3.5
0
$4.0
0
$4.5
0
$5.0
0
76 75 56 34 24 27 33 20 22 22
Local students
$0.5
0
$1.0
0
$1.5
0
$2.0
0
$2.5
0
$3.0
0
$3.5
0
$4.0
0
$4.5
0
$5.0
0
912 754 644 498 402 296 235 142 105 61
Most and least popular drinks among local students and international students
Soft drinks Fruit Juice Tea /coffee Energy
drinks
Other
(water, milk
drinks etc.)
International 36 30 24 43 17
Local 239 217 224 314 161
Document Page
From the data, it is clear that both the international and local students prefer energy drinks
compared to other drinks. However, the soft drinks also come in second as a popular drink
among the students.
Probability of choosing soft drink as first choice
15 students will choose soft drink as their first choice. 15/87
A proportion of 17%
Confidence interval = p +/- Z* Squareroot (p(1-P) /n
Z value = 1.96
1.96* Squareroot (17%*83%/87)
= +/- 8%
Confidence interval = 9%, 25%
Summary
This analysis contained results from
No. of local Students No. of International
Students
77 10
Document Page
Number of students
Local International
From the data it is clear that there is a close correlation between the preferences of the
international students and the local students in terms of beverage popularity
Soft drinks
Fruit Juice
Tea /coffee
Energy drinks
Other (water, milk drinks etc.)
0 50 100 150 200 250 300 350
International students Local students
Overall, the preferences of the general student population which was surveyed in the study is a
representation of the trends and preferences of both the local and international students. All
students react in the same way when it comes to increase in prices and the quantity demanded. In
addition, all students prefer energy drinks to health drinks. Also, the students are loyal to the
tabler-icon-diamond-filled.svg

Paraphrase This Document

Need a fresh take? Get an instant paraphrase of this document with our AI Paraphraser
Document Page
drinks they prefer only to the extent that the drinks have a min of 25% discount but if the
discount is more, the students may shift their preferences. This study has managed to provide a
comprehensive view of student preferences in terms of drink consumption given their nature of
being both local and international students (Silverman, 2018).
References
Silverman, B. W. (2018). Density estimation for statistics and data analysis. Routledge.
Chambers, J. M. (2017). Graphical Methods for Data Analysis: 0. Chapman and Hall/CRC.
Ott, R. L., & Longnecker, M. T. (2015). An introduction to statistical methods and data analysis.
Nelson Education.
Silverman, D. (Ed.). (2016). Qualitative research. Sage.
Mendenhall, W. M., Sincich, T. L., & Boudreau, N. S. (2016). Statistics for Engineering and the
Sciences, Student Solutions Manual. Chapman and Hall/CRC.
Cox, D. R. (2018). Applied statistics-principles and examples. Routledge.
Mertler, C. A., & Reinhart, R. V. (2016). Advanced and multivariate statistical methods: Practical
application and interpretation. Routledge.
Chatfield, C. (2018). Statistics for technology: a course in applied statistics. Routledge.
chevron_up_icon
1 out of 8
circle_padding
hide_on_mobile
zoom_out_icon
[object Object]