Analysis of BAE Systems Plc: Financials, Valuation & Capital
VerifiedAdded on 2023/01/16
|13
|3119
|57
Report
AI Summary
This report provides a comprehensive financial analysis of BAE Systems Plc, focusing on its financial and operating performance for the year 2018. It includes an assessment of profitability, liquidity, and efficiency ratios, alongside a discussion of the limitations of ratio analysis. The report further delves into company valuation, employing asset-based valuation, dividend discount model, and P/E ratio methods to estimate the company's worth. It also examines the capital structure of Absolute plc, calculating the cost of convertible bonds, cost of equity, and weighted average cost of capital (WACC), while acknowledging the difficulties in WACC calculation. The analysis aims to provide insights into BAE Systems' financial health and investment potential.

FINANCE
Paraphrase This Document
Need a fresh take? Get an instant paraphrase of this document with our AI Paraphraser
TABLE OF CONTENTS
TABLE OF CONTENTS................................................................................................................2
INTRODUCTION...........................................................................................................................1
2.1 Financial Analysis.....................................................................................................................1
a) Assessment of financial and operating performance of BAE systems plc for the year 2018..1
b) Limitations of using ratio analysis..........................................................................................4
2.2 Company Valuation...........................................................................................................5
a) Calculating the value of BAE systems using different methods.............................................5
b) Valuation methodologies.........................................................................................................7
2.3 Capital structure.........................................................................................................................8
a) Cost of convertible bonds for Absolute plc.............................................................................8
b) Cost of Equity at dividend of 0.30 per ordinary shares...........................................................8
c)Calculation of Weighed Average Cost of Capital of Aboslute plc...........................................8
d) The difficulties faced in calculating the WACC.....................................................................9
CONCLUSION..............................................................................................................................10
REFERENCES..............................................................................................................................11
INTRODUCTION
Finance is the lifeblood for an enterprise. Finance is needed for carrying out different
activities of company. There are various sources of finance through which funds can be raised by
companies. Present report will reveal about the financial analysis of BAE Systems, valuation of
company using different methods and cost of capital using weighted average cost of capital.
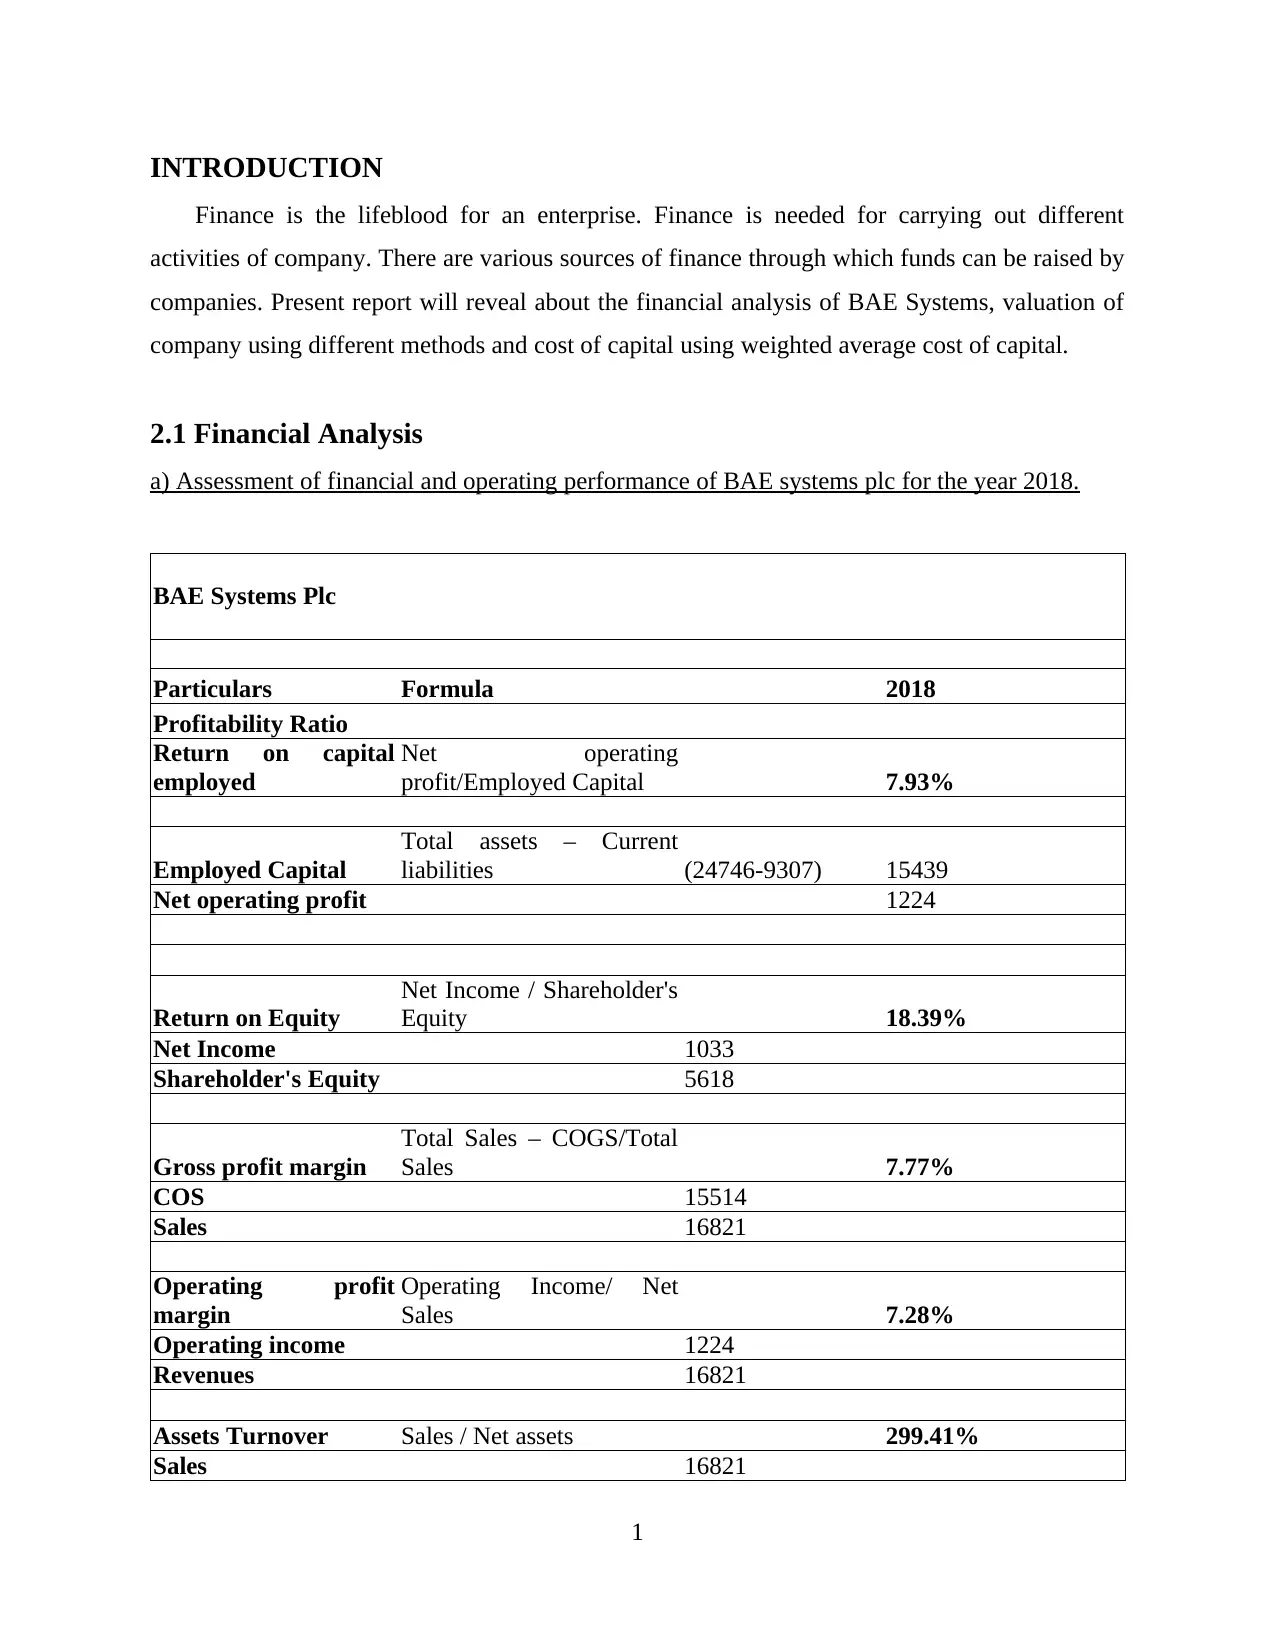
2.1 Financial Analysis
a) Assessment of financial and operating performance of BAE systems plc for the year 2018.
BAE Systems Plc
Particulars Formula 2018
Profitability Ratio
Return on capital
employed
Net operating
profit/Employed Capital 7.93%
Employed Capital
Total assets – Current
liabilities (24746-9307) 15439
Net operating profit 1224
Return on Equity
Net Income / Shareholder's
Equity 18.39%
Net Income 1033
Shareholder's Equity 5618
Gross profit margin
Total Sales – COGS/Total
Sales 7.77%
COS 15514
Sales 16821
Operating profit
margin
Operating Income/ Net
Sales 7.28%
Operating income 1224
Revenues 16821
Assets Turnover Sales / Net assets 299.41%
Sales 16821
1
Finance is the lifeblood for an enterprise. Finance is needed for carrying out different
activities of company. There are various sources of finance through which funds can be raised by
companies. Present report will reveal about the financial analysis of BAE Systems, valuation of
company using different methods and cost of capital using weighted average cost of capital.
2.1 Financial Analysis
a) Assessment of financial and operating performance of BAE systems plc for the year 2018.
BAE Systems Plc
Particulars Formula 2018
Profitability Ratio
Return on capital
employed
Net operating
profit/Employed Capital 7.93%
Employed Capital
Total assets – Current
liabilities (24746-9307) 15439
Net operating profit 1224
Return on Equity
Net Income / Shareholder's
Equity 18.39%
Net Income 1033
Shareholder's Equity 5618
Gross profit margin
Total Sales – COGS/Total
Sales 7.77%
COS 15514
Sales 16821
Operating profit
margin
Operating Income/ Net
Sales 7.28%
Operating income 1224
Revenues 16821
Assets Turnover Sales / Net assets 299.41%
Sales 16821
1
⊘ This is a preview!⊘
Do you want full access?
Subscribe today to unlock all pages.
Trusted by 1+ million students worldwide
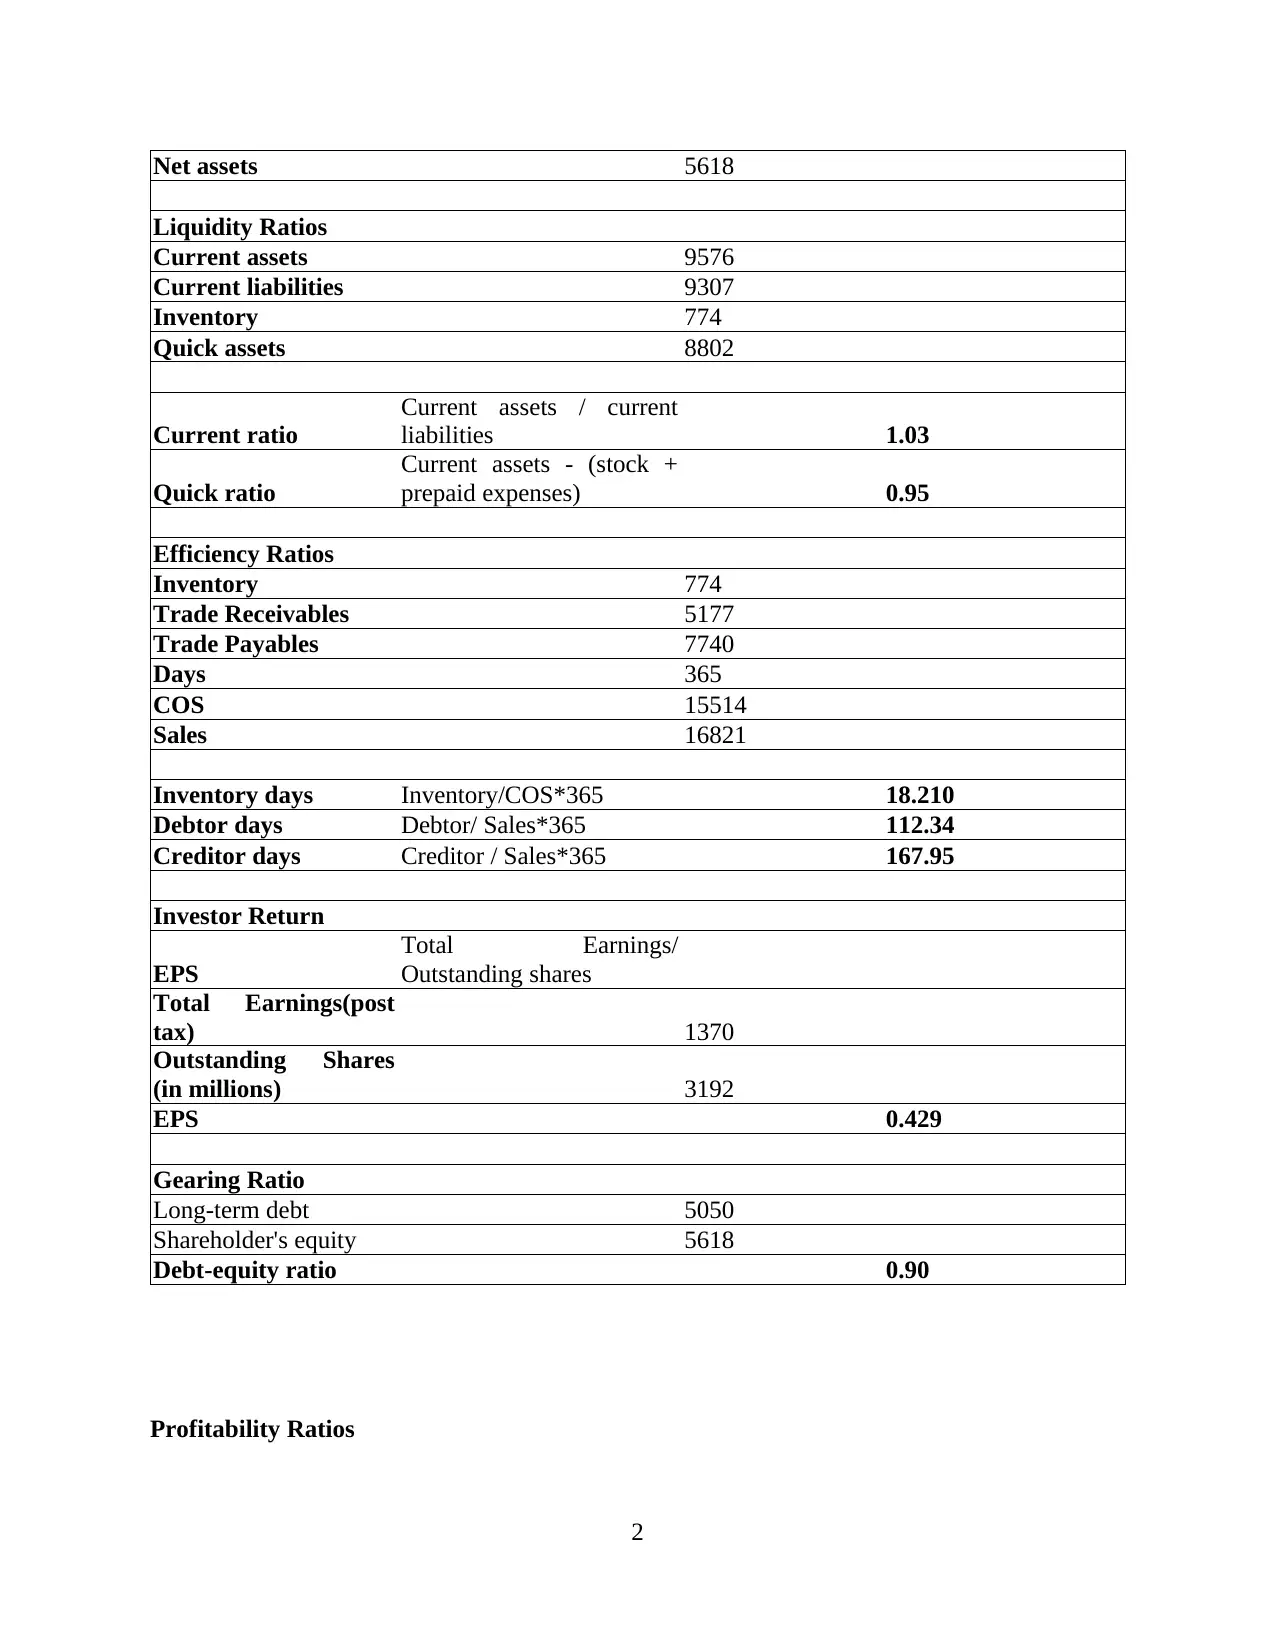
Net assets 5618
Liquidity Ratios
Current assets 9576
Current liabilities 9307
Inventory 774
Quick assets 8802
Current ratio
Current assets / current
liabilities 1.03
Quick ratio
Current assets - (stock +
prepaid expenses) 0.95
Efficiency Ratios
Inventory 774
Trade Receivables 5177
Trade Payables 7740
Days 365
COS 15514
Sales 16821
Inventory days Inventory/COS*365 18.210
Debtor days Debtor/ Sales*365 112.34
Creditor days Creditor / Sales*365 167.95
Investor Return
EPS
Total Earnings/
Outstanding shares
Total Earnings(post
tax) 1370
Outstanding Shares
(in millions) 3192
EPS 0.429
Gearing Ratio
Long-term debt 5050
Shareholder's equity 5618
Debt-equity ratio 0.90
Profitability Ratios
2
Paraphrase This Document
Need a fresh take? Get an instant paraphrase of this document with our AI Paraphraser
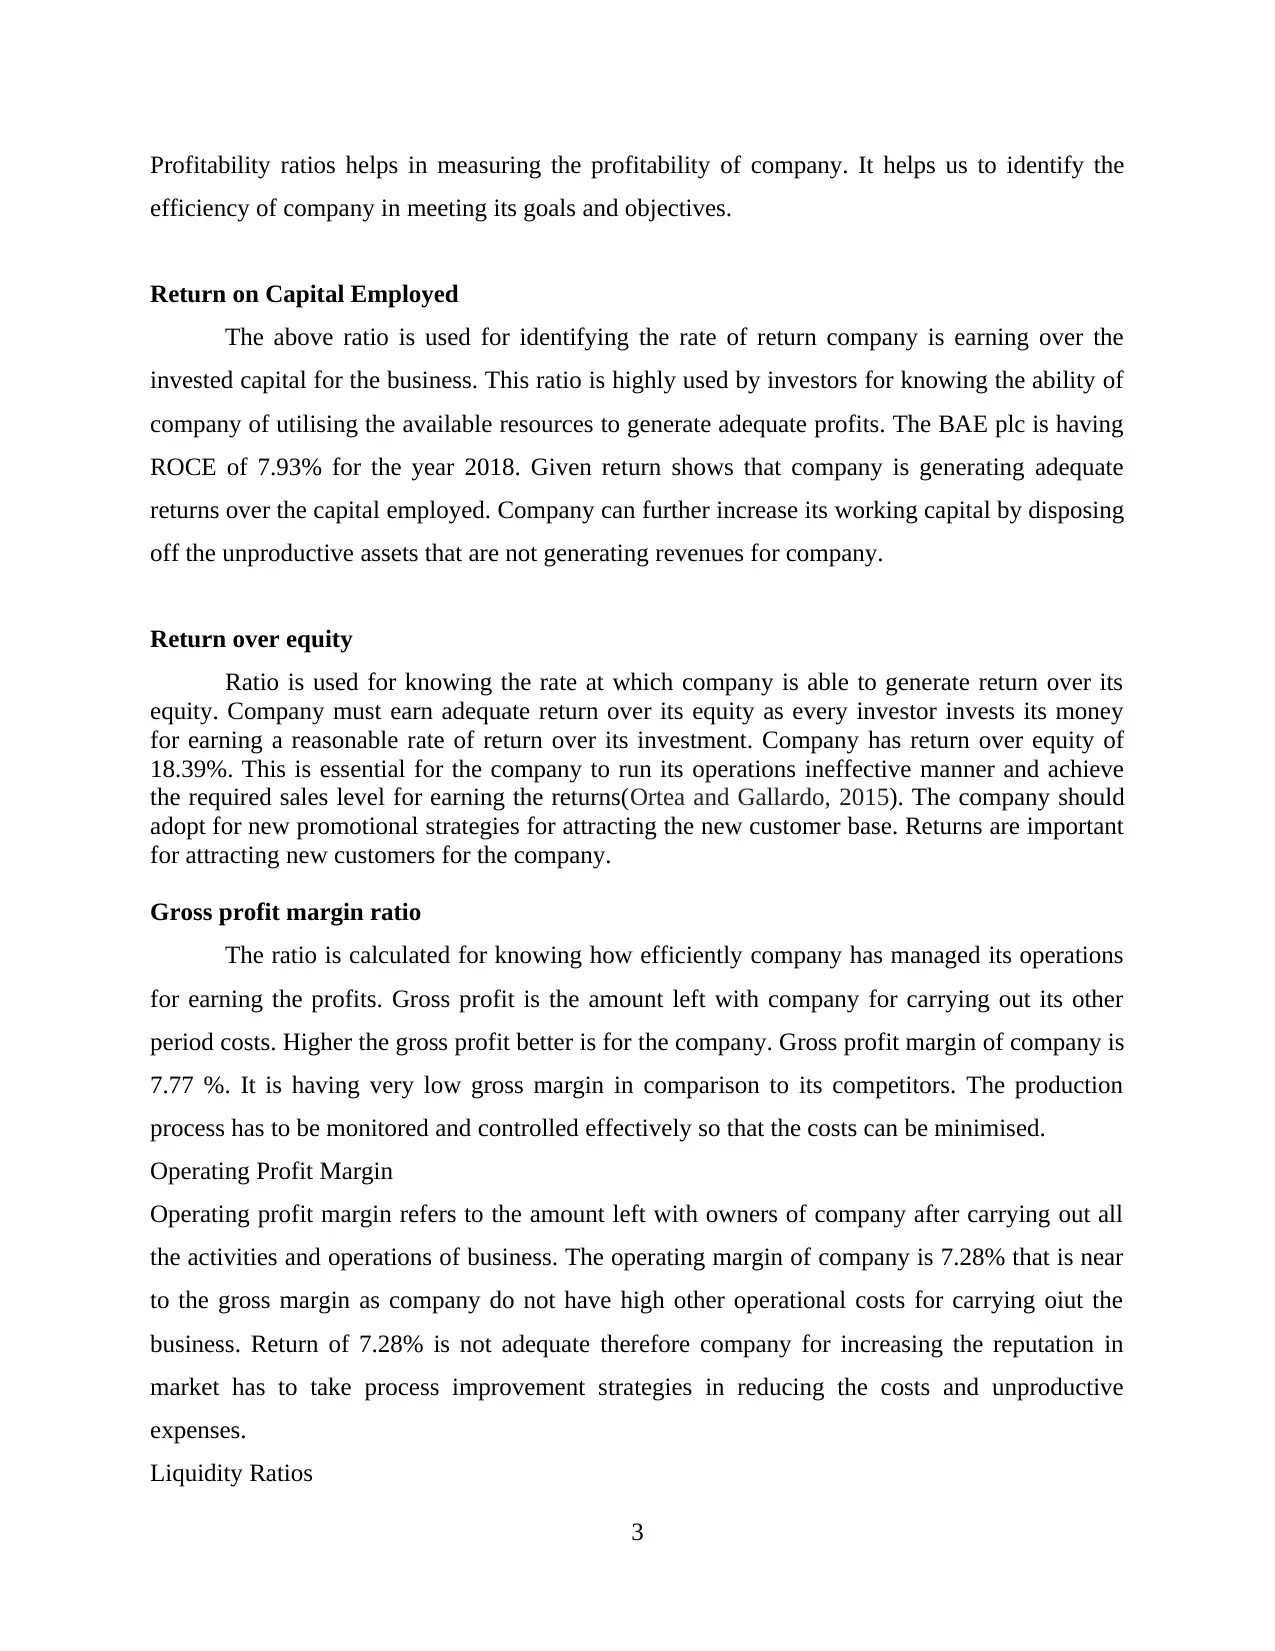
Profitability ratios helps in measuring the profitability of company. It helps us to identify the
efficiency of company in meeting its goals and objectives.
Return on Capital Employed
The above ratio is used for identifying the rate of return company is earning over the
invested capital for the business. This ratio is highly used by investors for knowing the ability of
company of utilising the available resources to generate adequate profits. The BAE plc is having
ROCE of 7.93% for the year 2018. Given return shows that company is generating adequate
returns over the capital employed. Company can further increase its working capital by disposing
off the unproductive assets that are not generating revenues for company.
Return over equity
Ratio is used for knowing the rate at which company is able to generate return over its
equity. Company must earn adequate return over its equity as every investor invests its money
for earning a reasonable rate of return over its investment. Company has return over equity of
18.39%. This is essential for the company to run its operations ineffective manner and achieve
the required sales level for earning the returns(Ortea and Gallardo, 2015). The company should
adopt for new promotional strategies for attracting the new customer base. Returns are important
for attracting new customers for the company.
Gross profit margin ratio
The ratio is calculated for knowing how efficiently company has managed its operations
for earning the profits. Gross profit is the amount left with company for carrying out its other
period costs. Higher the gross profit better is for the company. Gross profit margin of company is
7.77 %. It is having very low gross margin in comparison to its competitors. The production
process has to be monitored and controlled effectively so that the costs can be minimised.
Operating Profit Margin
Operating profit margin refers to the amount left with owners of company after carrying out all
the activities and operations of business. The operating margin of company is 7.28% that is near
to the gross margin as company do not have high other operational costs for carrying oiut the
business. Return of 7.28% is not adequate therefore company for increasing the reputation in
market has to take process improvement strategies in reducing the costs and unproductive
expenses.
Liquidity Ratios
3
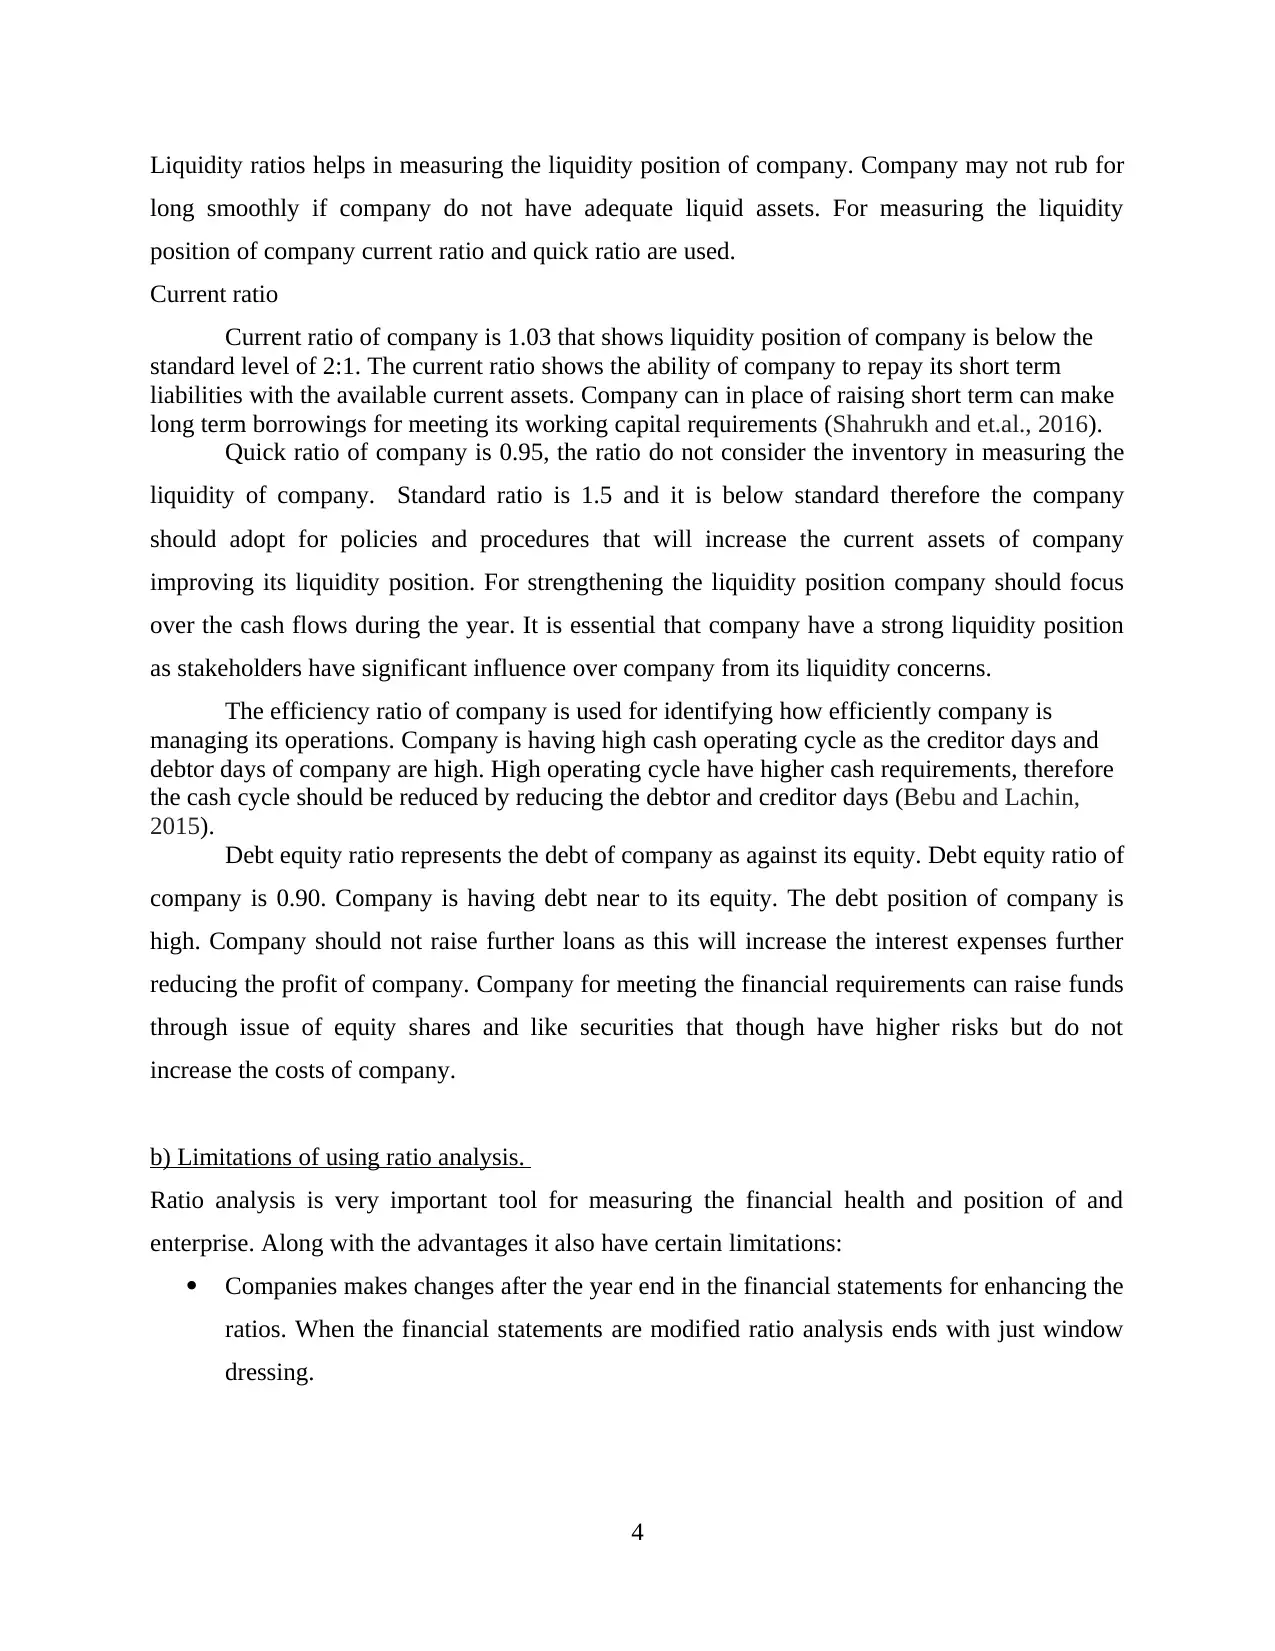
Liquidity ratios helps in measuring the liquidity position of company. Company may not rub for
long smoothly if company do not have adequate liquid assets. For measuring the liquidity
position of company current ratio and quick ratio are used.
Current ratio
Current ratio of company is 1.03 that shows liquidity position of company is below the
standard level of 2:1. The current ratio shows the ability of company to repay its short term
liabilities with the available current assets. Company can in place of raising short term can make
long term borrowings for meeting its working capital requirements (Shahrukh and et.al., 2016).
Quick ratio of company is 0.95, the ratio do not consider the inventory in measuring the
liquidity of company. Standard ratio is 1.5 and it is below standard therefore the company
should adopt for policies and procedures that will increase the current assets of company
improving its liquidity position. For strengthening the liquidity position company should focus
over the cash flows during the year. It is essential that company have a strong liquidity position
as stakeholders have significant influence over company from its liquidity concerns.
The efficiency ratio of company is used for identifying how efficiently company is
managing its operations. Company is having high cash operating cycle as the creditor days and
debtor days of company are high. High operating cycle have higher cash requirements, therefore
the cash cycle should be reduced by reducing the debtor and creditor days (Bebu and Lachin,
2015).
Debt equity ratio represents the debt of company as against its equity. Debt equity ratio of
company is 0.90. Company is having debt near to its equity. The debt position of company is
high. Company should not raise further loans as this will increase the interest expenses further
reducing the profit of company. Company for meeting the financial requirements can raise funds
through issue of equity shares and like securities that though have higher risks but do not
increase the costs of company.
b) Limitations of using ratio analysis.
Ratio analysis is very important tool for measuring the financial health and position of and
enterprise. Along with the advantages it also have certain limitations:
Companies makes changes after the year end in the financial statements for enhancing the
ratios. When the financial statements are modified ratio analysis ends with just window
dressing.
4
⊘ This is a preview!⊘
Do you want full access?
Subscribe today to unlock all pages.
Trusted by 1+ million students worldwide
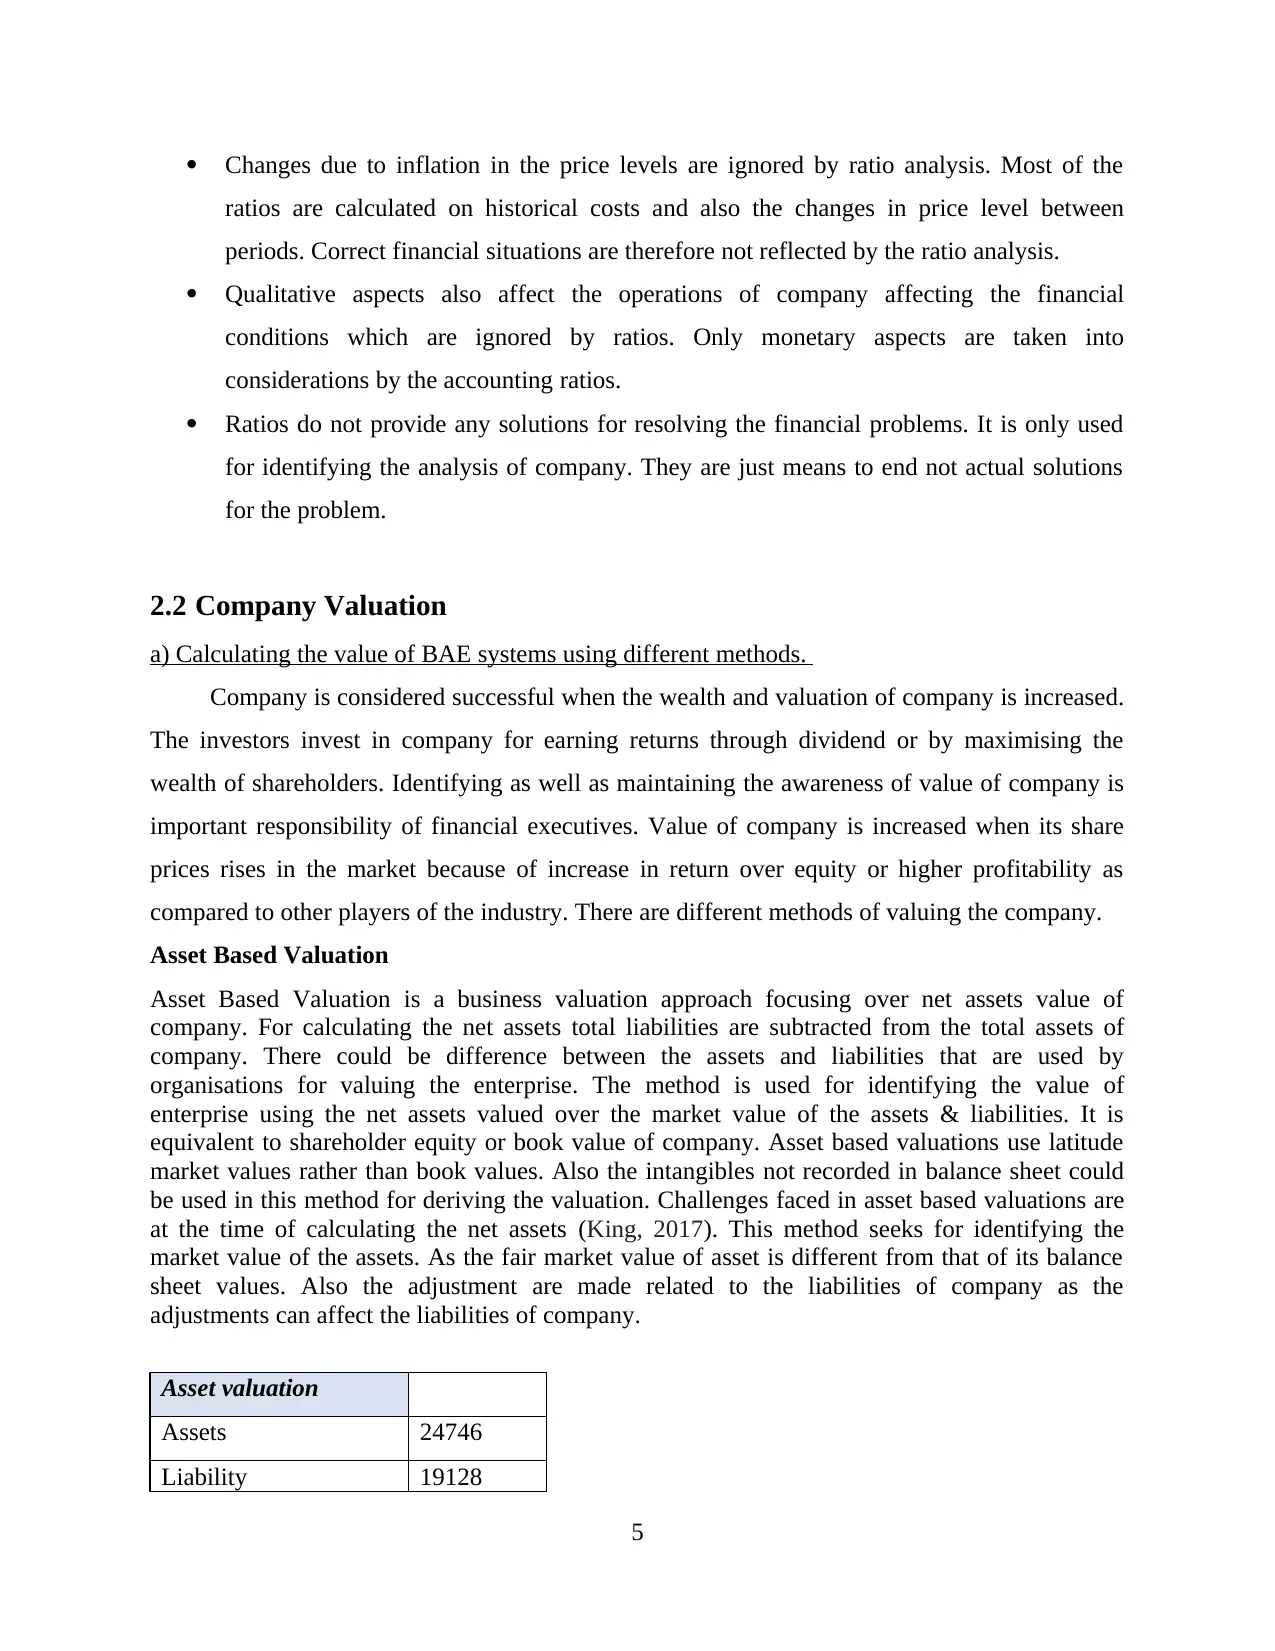
Changes due to inflation in the price levels are ignored by ratio analysis. Most of the
ratios are calculated on historical costs and also the changes in price level between
periods. Correct financial situations are therefore not reflected by the ratio analysis.
Qualitative aspects also affect the operations of company affecting the financial
conditions which are ignored by ratios. Only monetary aspects are taken into
considerations by the accounting ratios.
Ratios do not provide any solutions for resolving the financial problems. It is only used
for identifying the analysis of company. They are just means to end not actual solutions
for the problem.
2.2 Company Valuation
a) Calculating the value of BAE systems using different methods.
Company is considered successful when the wealth and valuation of company is increased.
The investors invest in company for earning returns through dividend or by maximising the
wealth of shareholders. Identifying as well as maintaining the awareness of value of company is
important responsibility of financial executives. Value of company is increased when its share
prices rises in the market because of increase in return over equity or higher profitability as
compared to other players of the industry. There are different methods of valuing the company.
Asset Based Valuation
Asset Based Valuation is a business valuation approach focusing over net assets value of
company. For calculating the net assets total liabilities are subtracted from the total assets of
company. There could be difference between the assets and liabilities that are used by
organisations for valuing the enterprise. The method is used for identifying the value of
enterprise using the net assets valued over the market value of the assets & liabilities. It is
equivalent to shareholder equity or book value of company. Asset based valuations use latitude
market values rather than book values. Also the intangibles not recorded in balance sheet could
be used in this method for deriving the valuation. Challenges faced in asset based valuations are
at the time of calculating the net assets (King, 2017). This method seeks for identifying the
market value of the assets. As the fair market value of asset is different from that of its balance
sheet values. Also the adjustment are made related to the liabilities of company as the
adjustments can affect the liabilities of company.
Asset valuation
Assets 24746
Liability 19128
5
Paraphrase This Document
Need a fresh take? Get an instant paraphrase of this document with our AI Paraphraser
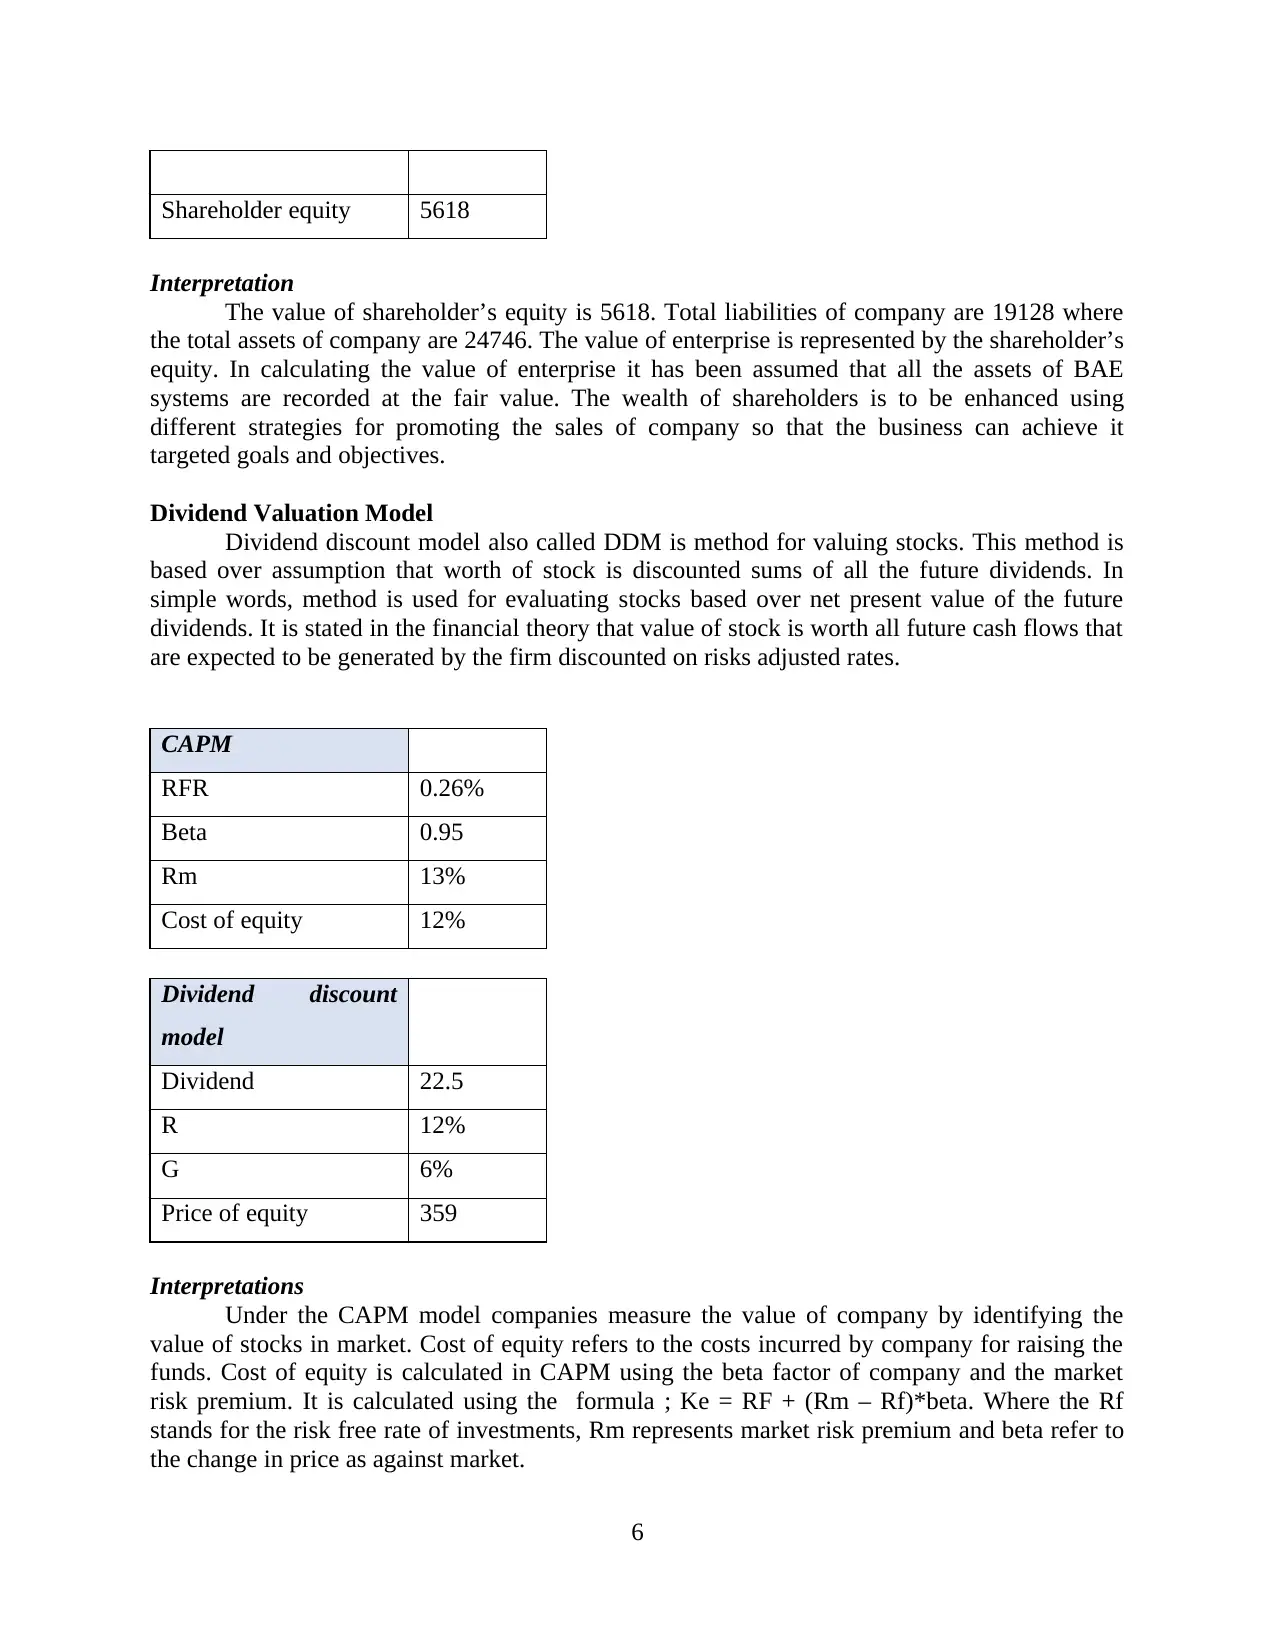
Shareholder equity 5618
Interpretation
The value of shareholder’s equity is 5618. Total liabilities of company are 19128 where
the total assets of company are 24746. The value of enterprise is represented by the shareholder’s
equity. In calculating the value of enterprise it has been assumed that all the assets of BAE
systems are recorded at the fair value. The wealth of shareholders is to be enhanced using
different strategies for promoting the sales of company so that the business can achieve it
targeted goals and objectives.
Dividend Valuation Model
Dividend discount model also called DDM is method for valuing stocks. This method is
based over assumption that worth of stock is discounted sums of all the future dividends. In
simple words, method is used for evaluating stocks based over net present value of the future
dividends. It is stated in the financial theory that value of stock is worth all future cash flows that
are expected to be generated by the firm discounted on risks adjusted rates.
CAPM
RFR 0.26%
Beta 0.95
Rm 13%
Cost of equity 12%
Dividend discount
model
Dividend 22.5
R 12%
G 6%
Price of equity 359
Interpretations
Under the CAPM model companies measure the value of company by identifying the
value of stocks in market. Cost of equity refers to the costs incurred by company for raising the
funds. Cost of equity is calculated in CAPM using the beta factor of company and the market
risk premium. It is calculated using the formula ; Ke = RF + (Rm – Rf)*beta. Where the Rf
stands for the risk free rate of investments, Rm represents market risk premium and beta refer to
the change in price as against market.
6
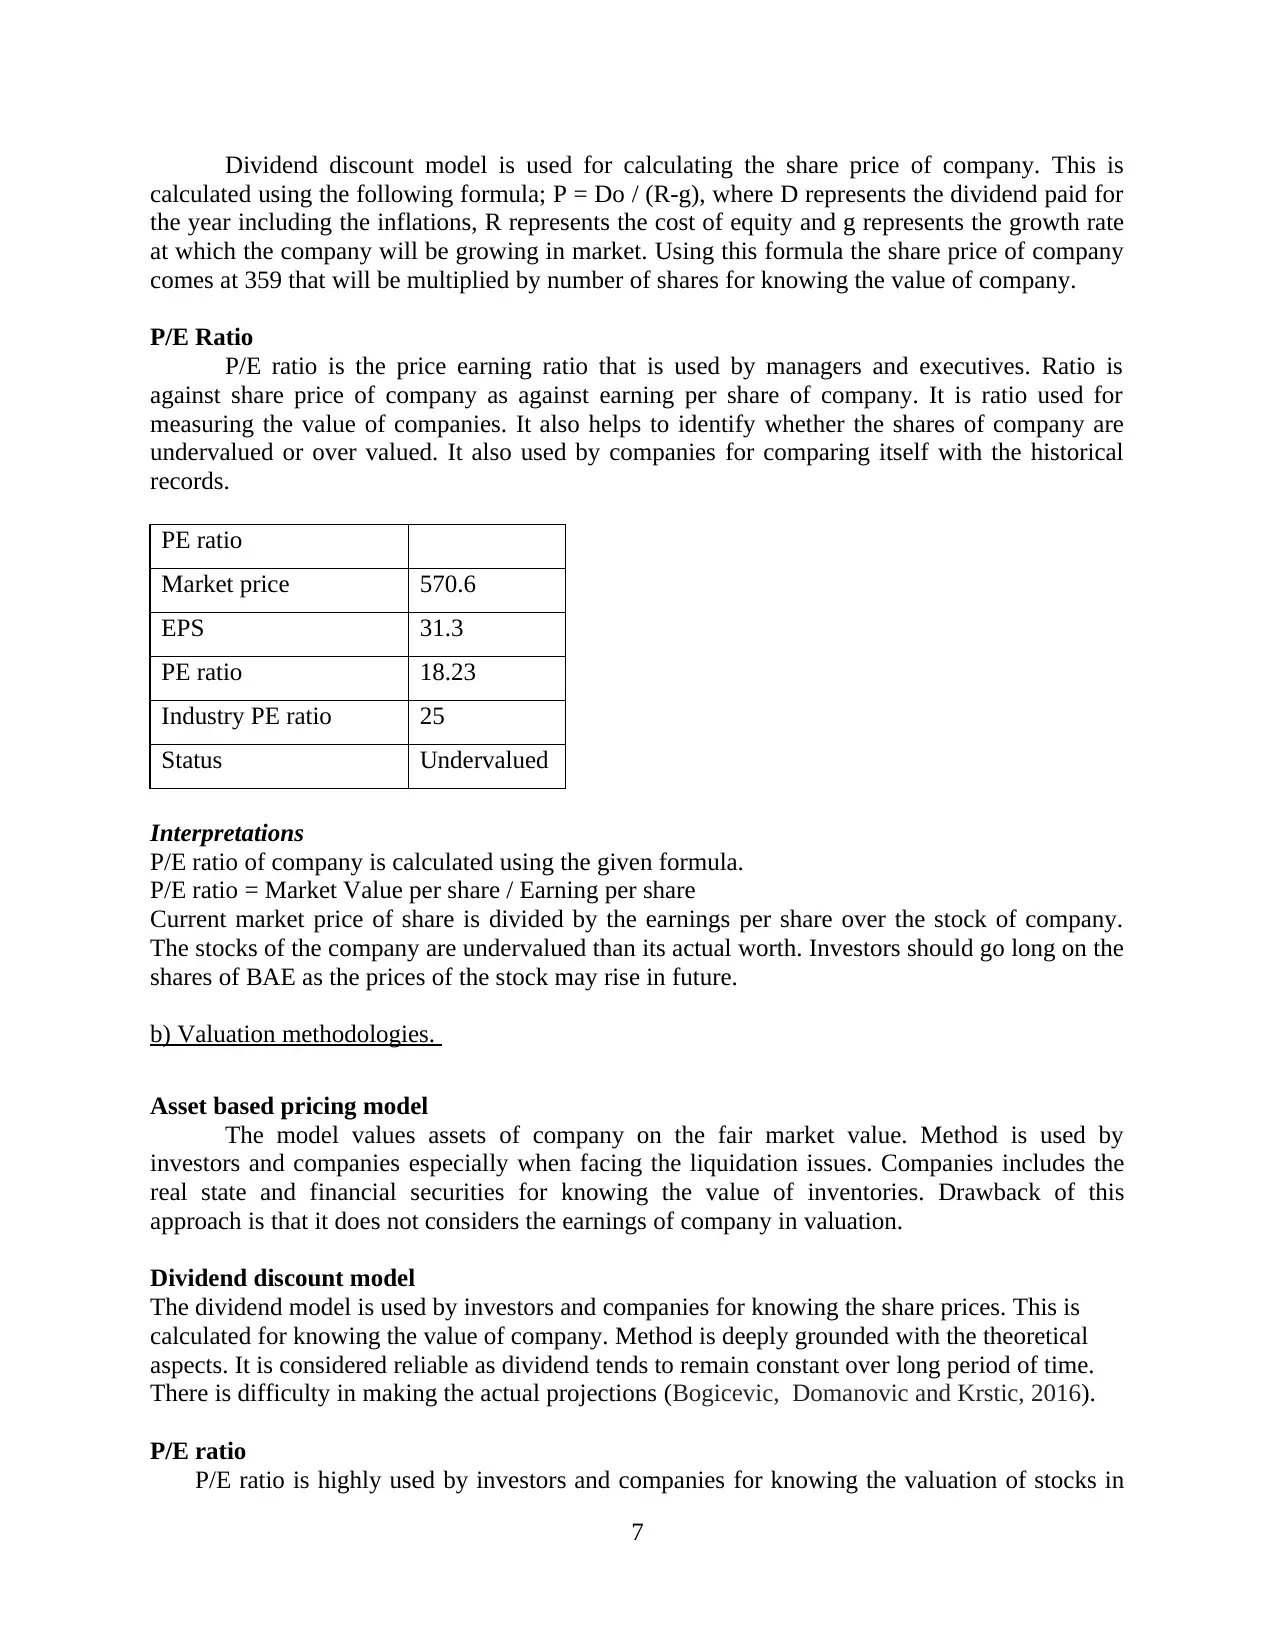
Dividend discount model is used for calculating the share price of company. This is
calculated using the following formula; P = Do / (R-g), where D represents the dividend paid for
the year including the inflations, R represents the cost of equity and g represents the growth rate
at which the company will be growing in market. Using this formula the share price of company
comes at 359 that will be multiplied by number of shares for knowing the value of company.
P/E Ratio
P/E ratio is the price earning ratio that is used by managers and executives. Ratio is
against share price of company as against earning per share of company. It is ratio used for
measuring the value of companies. It also helps to identify whether the shares of company are
undervalued or over valued. It also used by companies for comparing itself with the historical
records.
PE ratio
Market price 570.6
EPS 31.3
PE ratio 18.23
Industry PE ratio 25
Status Undervalued
Interpretations
P/E ratio of company is calculated using the given formula.
P/E ratio = Market Value per share / Earning per share
Current market price of share is divided by the earnings per share over the stock of company.
The stocks of the company are undervalued than its actual worth. Investors should go long on the
shares of BAE as the prices of the stock may rise in future.
b) Valuation methodologies.
Asset based pricing model
The model values assets of company on the fair market value. Method is used by
investors and companies especially when facing the liquidation issues. Companies includes the
real state and financial securities for knowing the value of inventories. Drawback of this
approach is that it does not considers the earnings of company in valuation.
Dividend discount model
The dividend model is used by investors and companies for knowing the share prices. This is
calculated for knowing the value of company. Method is deeply grounded with the theoretical
aspects. It is considered reliable as dividend tends to remain constant over long period of time.
There is difficulty in making the actual projections (Bogicevic, Domanovic and Krstic, 2016).
P/E ratio
P/E ratio is highly used by investors and companies for knowing the valuation of stocks in
7
⊘ This is a preview!⊘
Do you want full access?
Subscribe today to unlock all pages.
Trusted by 1+ million students worldwide
market. Higher P/E ratio represents that stocks of company are over valued or investors may
expect high growth in the near future. P/E ratio can be calculated for only companies having
earnings.
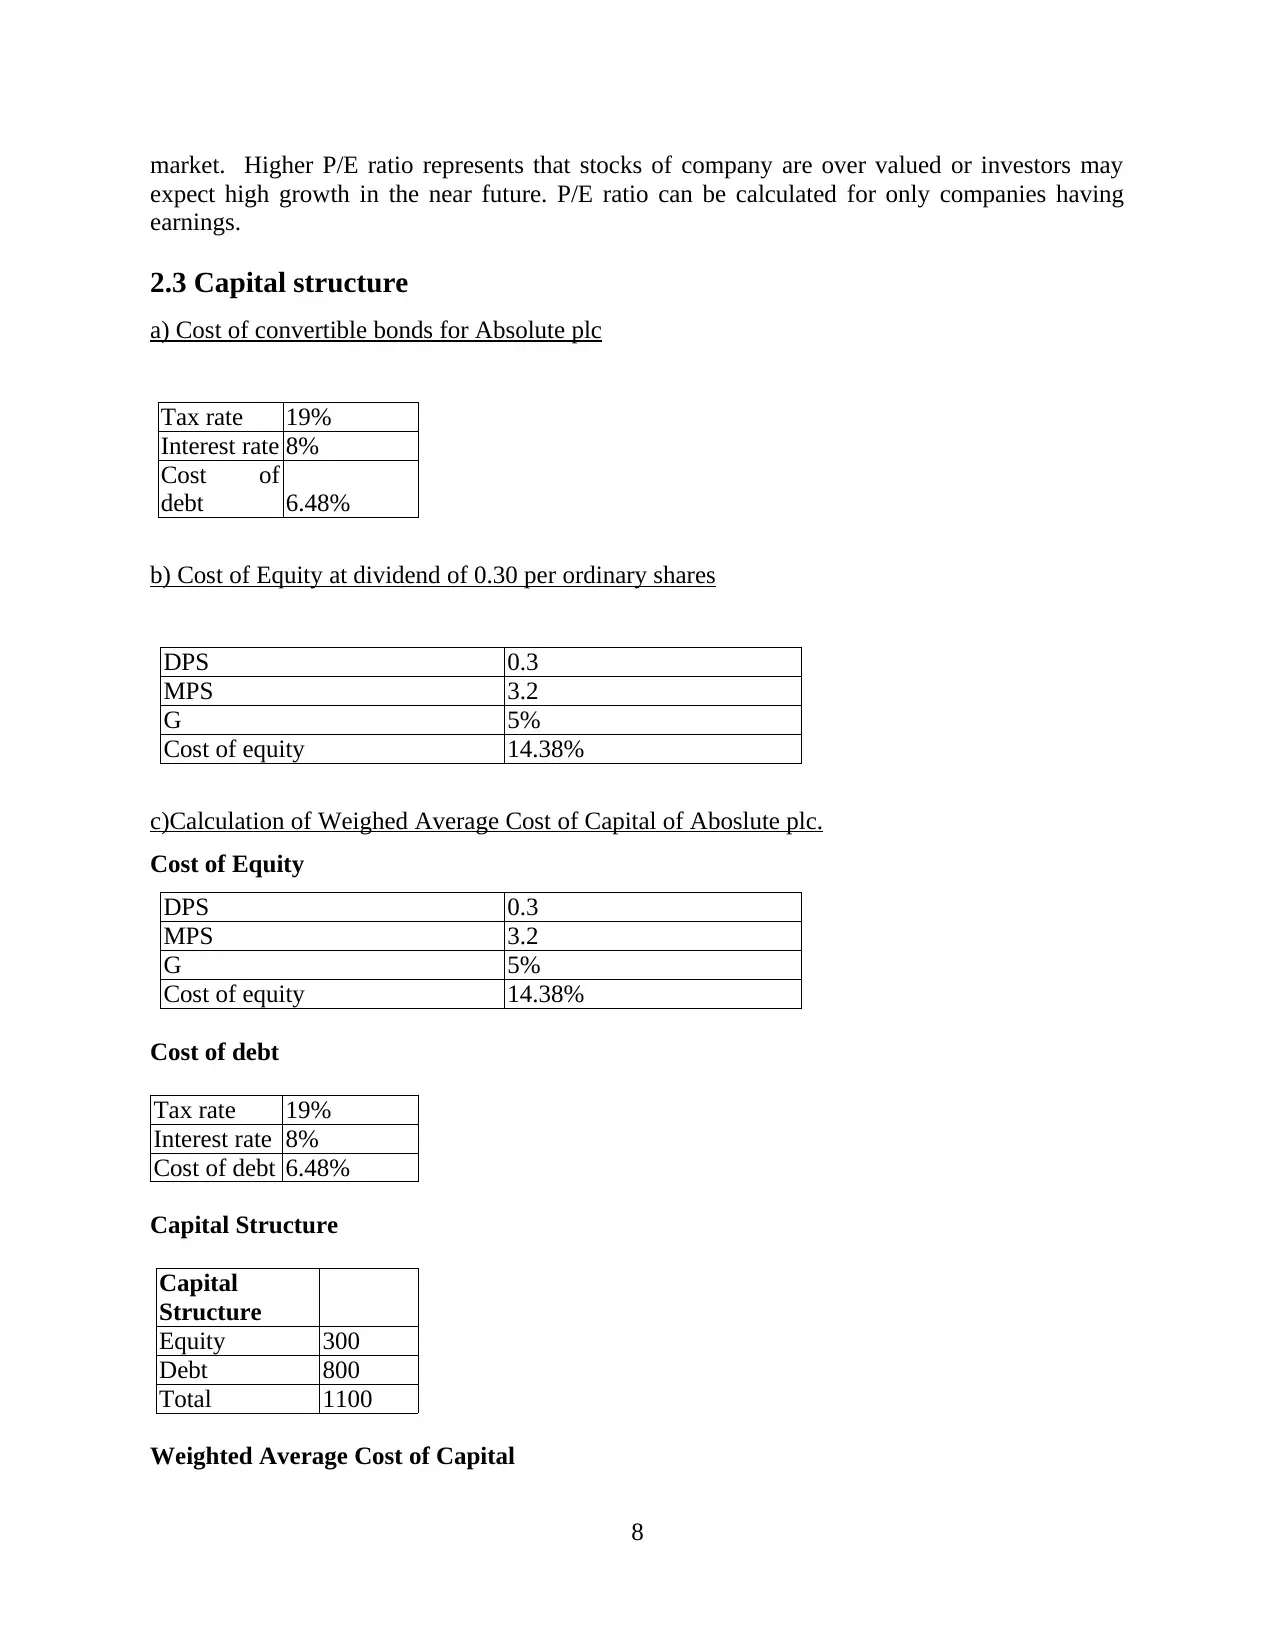
2.3 Capital structure
a) Cost of convertible bonds for Absolute plc
Tax rate 19%
Interest rate 8%
Cost of
debt 6.48%
b) Cost of Equity at dividend of 0.30 per ordinary shares
DPS 0.3
MPS 3.2
G 5%
Cost of equity 14.38%
c)Calculation of Weighed Average Cost of Capital of Aboslute plc.
Cost of Equity
DPS 0.3
MPS 3.2
G 5%
Cost of equity 14.38%
Cost of debt
Tax rate 19%
Interest rate 8%
Cost of debt 6.48%
Capital Structure
Capital
Structure
Equity 300
Debt 800
Total 1100
Weighted Average Cost of Capital
8
expect high growth in the near future. P/E ratio can be calculated for only companies having
earnings.
2.3 Capital structure
a) Cost of convertible bonds for Absolute plc
Tax rate 19%
Interest rate 8%
Cost of
debt 6.48%
b) Cost of Equity at dividend of 0.30 per ordinary shares
DPS 0.3
MPS 3.2
G 5%
Cost of equity 14.38%
c)Calculation of Weighed Average Cost of Capital of Aboslute plc.
Cost of Equity
DPS 0.3
MPS 3.2
G 5%
Cost of equity 14.38%
Cost of debt
Tax rate 19%
Interest rate 8%
Cost of debt 6.48%
Capital Structure
Capital
Structure
Equity 300
Debt 800
Total 1100
Weighted Average Cost of Capital
8
Paraphrase This Document
Need a fresh take? Get an instant paraphrase of this document with our AI Paraphraser
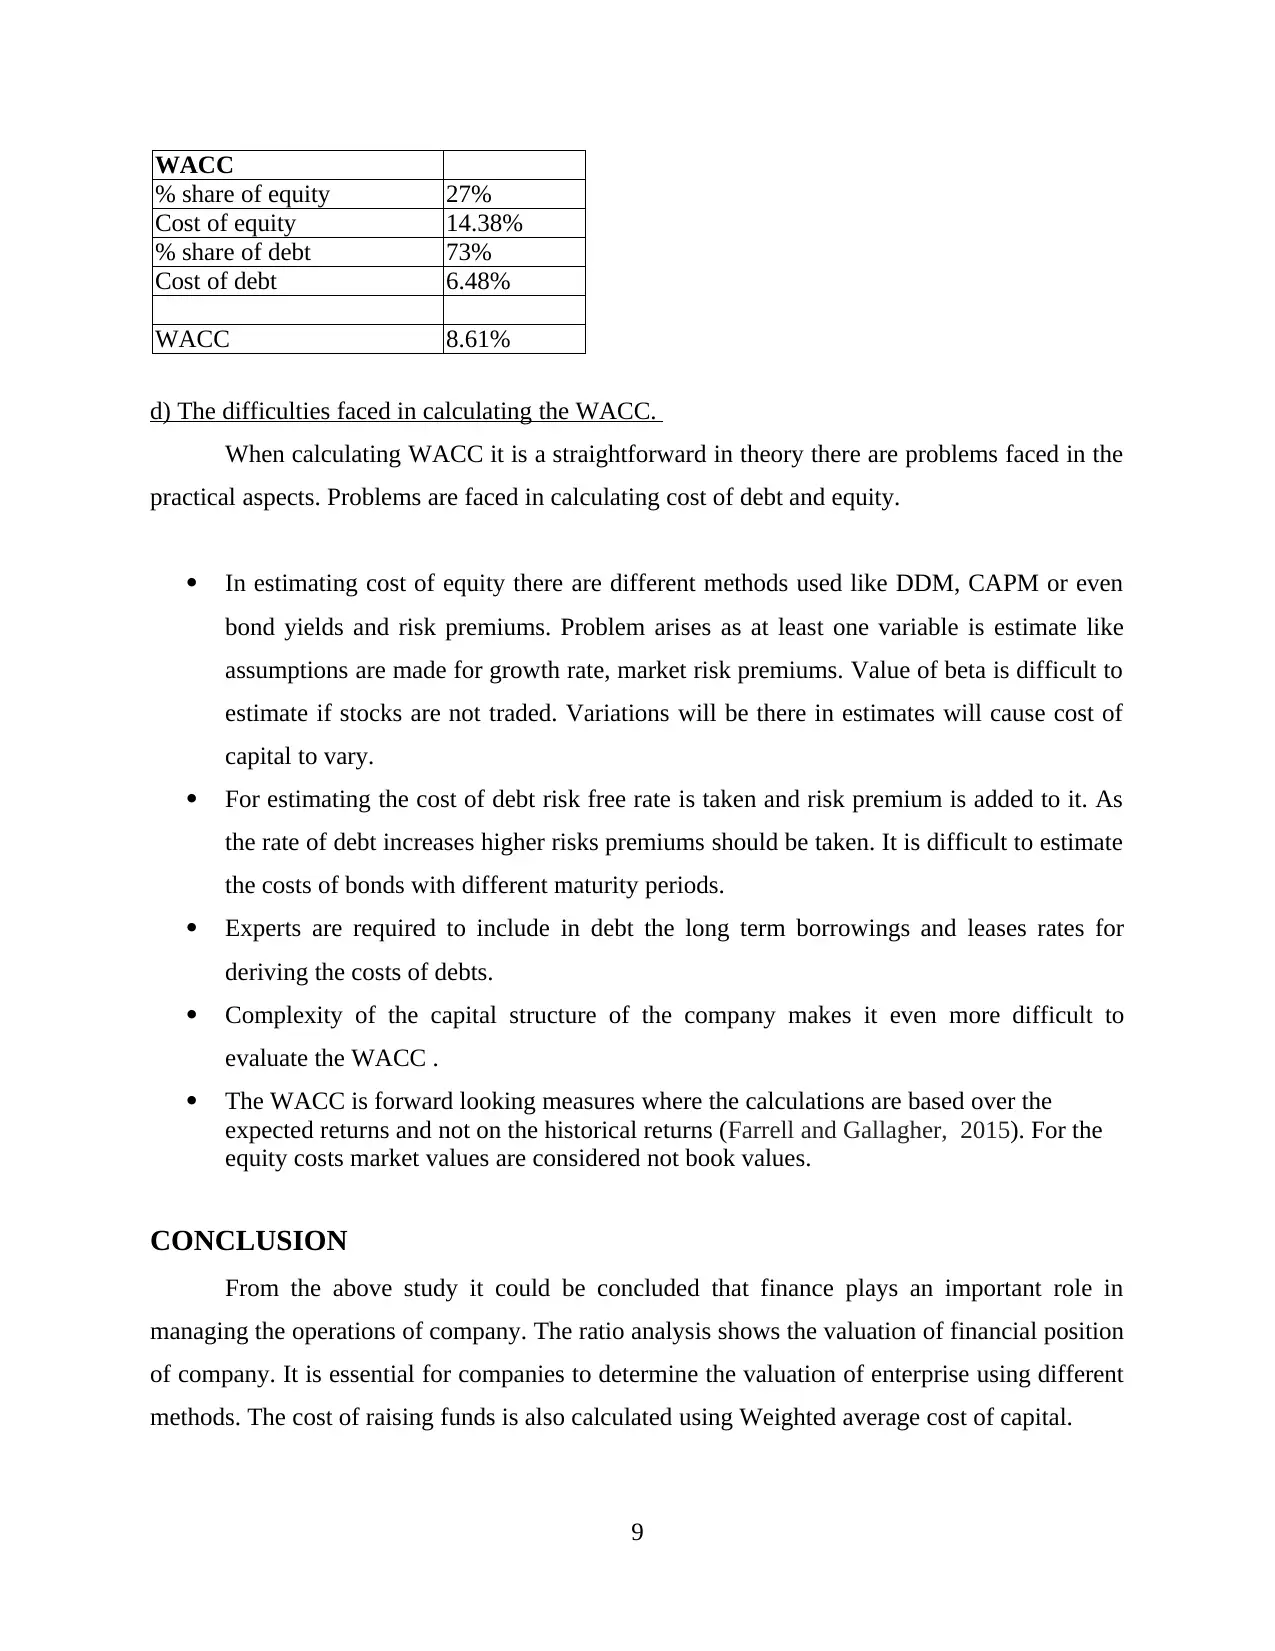
WACC
% share of equity 27%
Cost of equity 14.38%
% share of debt 73%
Cost of debt 6.48%
WACC 8.61%
d) The difficulties faced in calculating the WACC.
When calculating WACC it is a straightforward in theory there are problems faced in the
practical aspects. Problems are faced in calculating cost of debt and equity.
In estimating cost of equity there are different methods used like DDM, CAPM or even
bond yields and risk premiums. Problem arises as at least one variable is estimate like
assumptions are made for growth rate, market risk premiums. Value of beta is difficult to
estimate if stocks are not traded. Variations will be there in estimates will cause cost of
capital to vary.
For estimating the cost of debt risk free rate is taken and risk premium is added to it. As
the rate of debt increases higher risks premiums should be taken. It is difficult to estimate
the costs of bonds with different maturity periods.
Experts are required to include in debt the long term borrowings and leases rates for
deriving the costs of debts.
Complexity of the capital structure of the company makes it even more difficult to
evaluate the WACC .
The WACC is forward looking measures where the calculations are based over the
expected returns and not on the historical returns (Farrell and Gallagher, 2015). For the
equity costs market values are considered not book values.
CONCLUSION
From the above study it could be concluded that finance plays an important role in
managing the operations of company. The ratio analysis shows the valuation of financial position
of company. It is essential for companies to determine the valuation of enterprise using different
methods. The cost of raising funds is also calculated using Weighted average cost of capital.
9

10
⊘ This is a preview!⊘
Do you want full access?
Subscribe today to unlock all pages.
Trusted by 1+ million students worldwide
1 out of 13
Related Documents


Your All-in-One AI-Powered Toolkit for Academic Success.
+13062052269
info@desklib.com
Available 24*7 on WhatsApp / Email
![[object Object]](/_next/static/media/star-bottom.7253800d.svg)
Unlock your academic potential
Copyright © 2020–2026 A2Z Services. All Rights Reserved. Developed and managed by ZUCOL.