RMIT BAFI1042: Investment Analysis of ASX Listed Companies Report
VerifiedAdded on 2023/06/08
|19
|3216
|299
Report
AI Summary
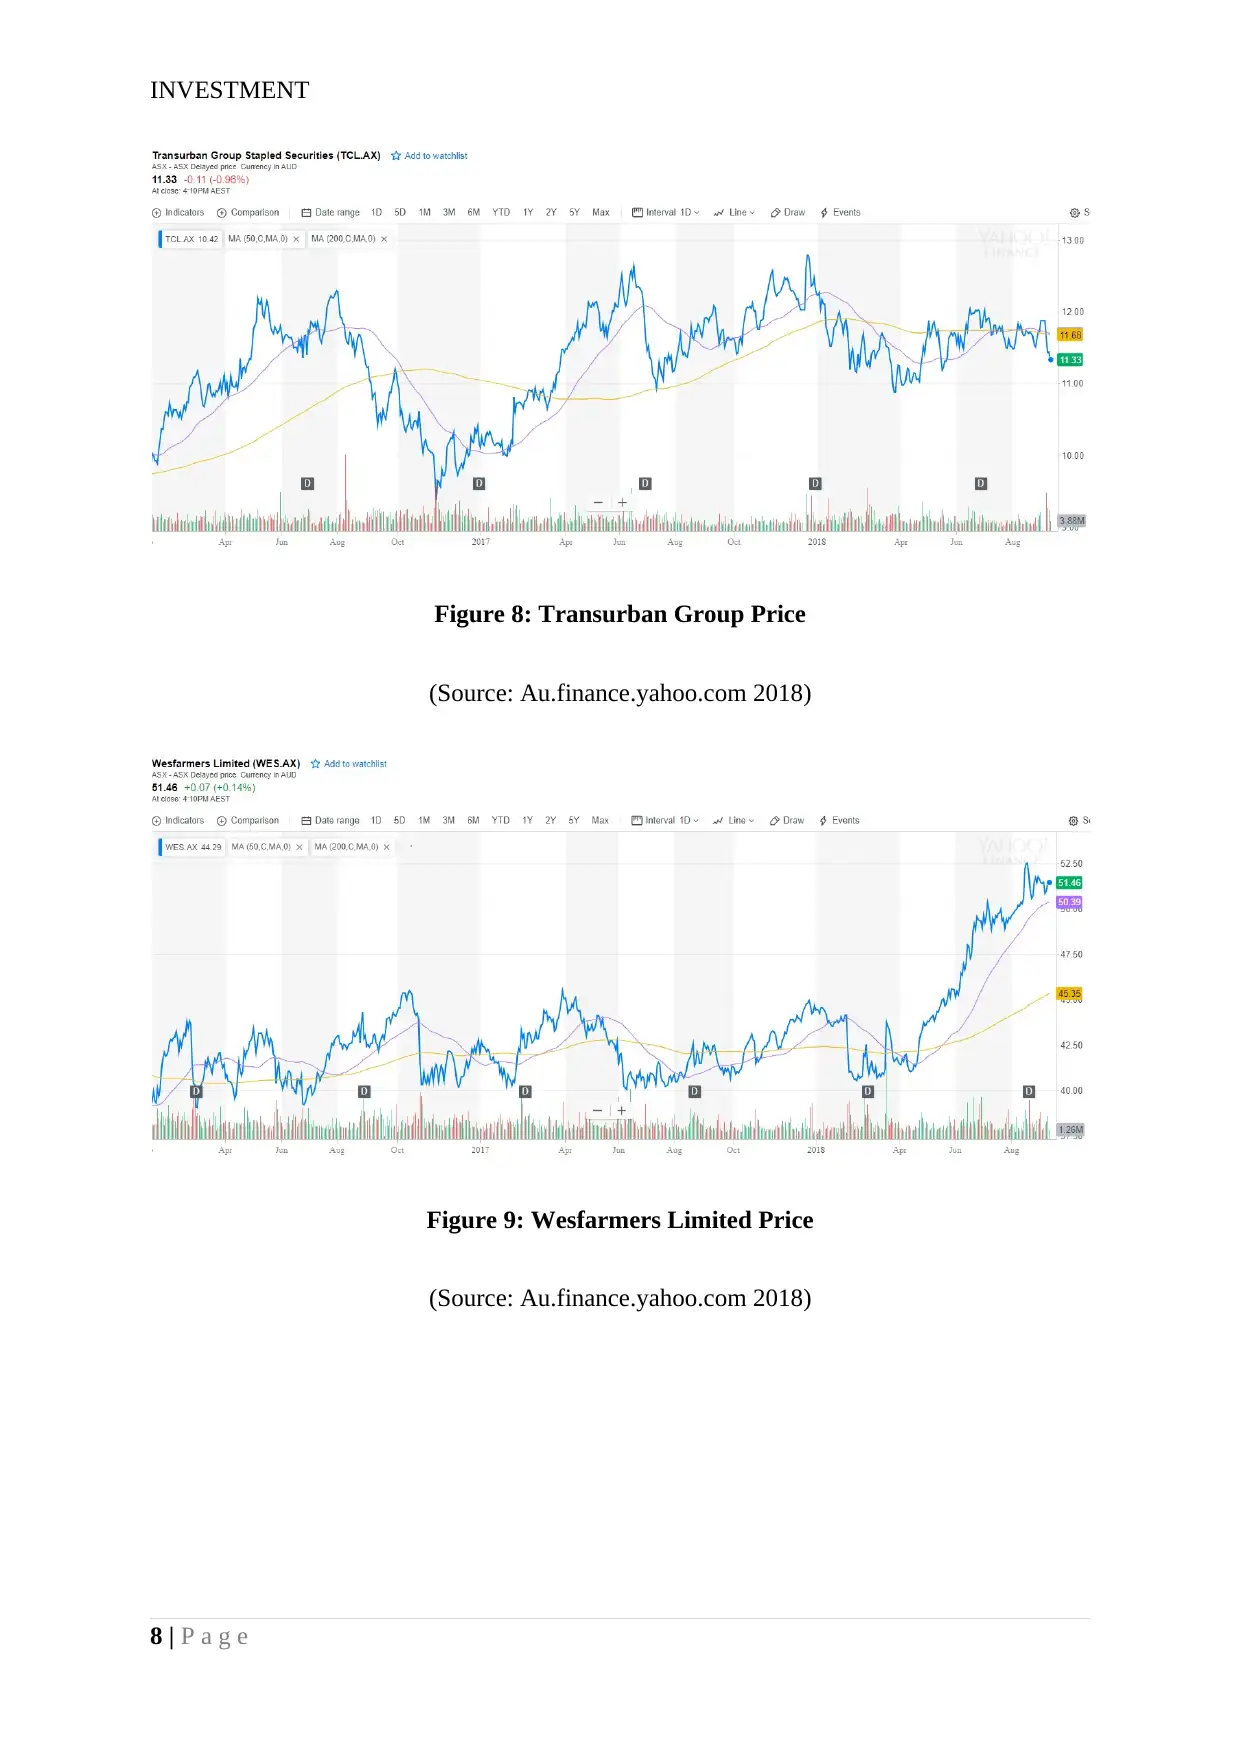
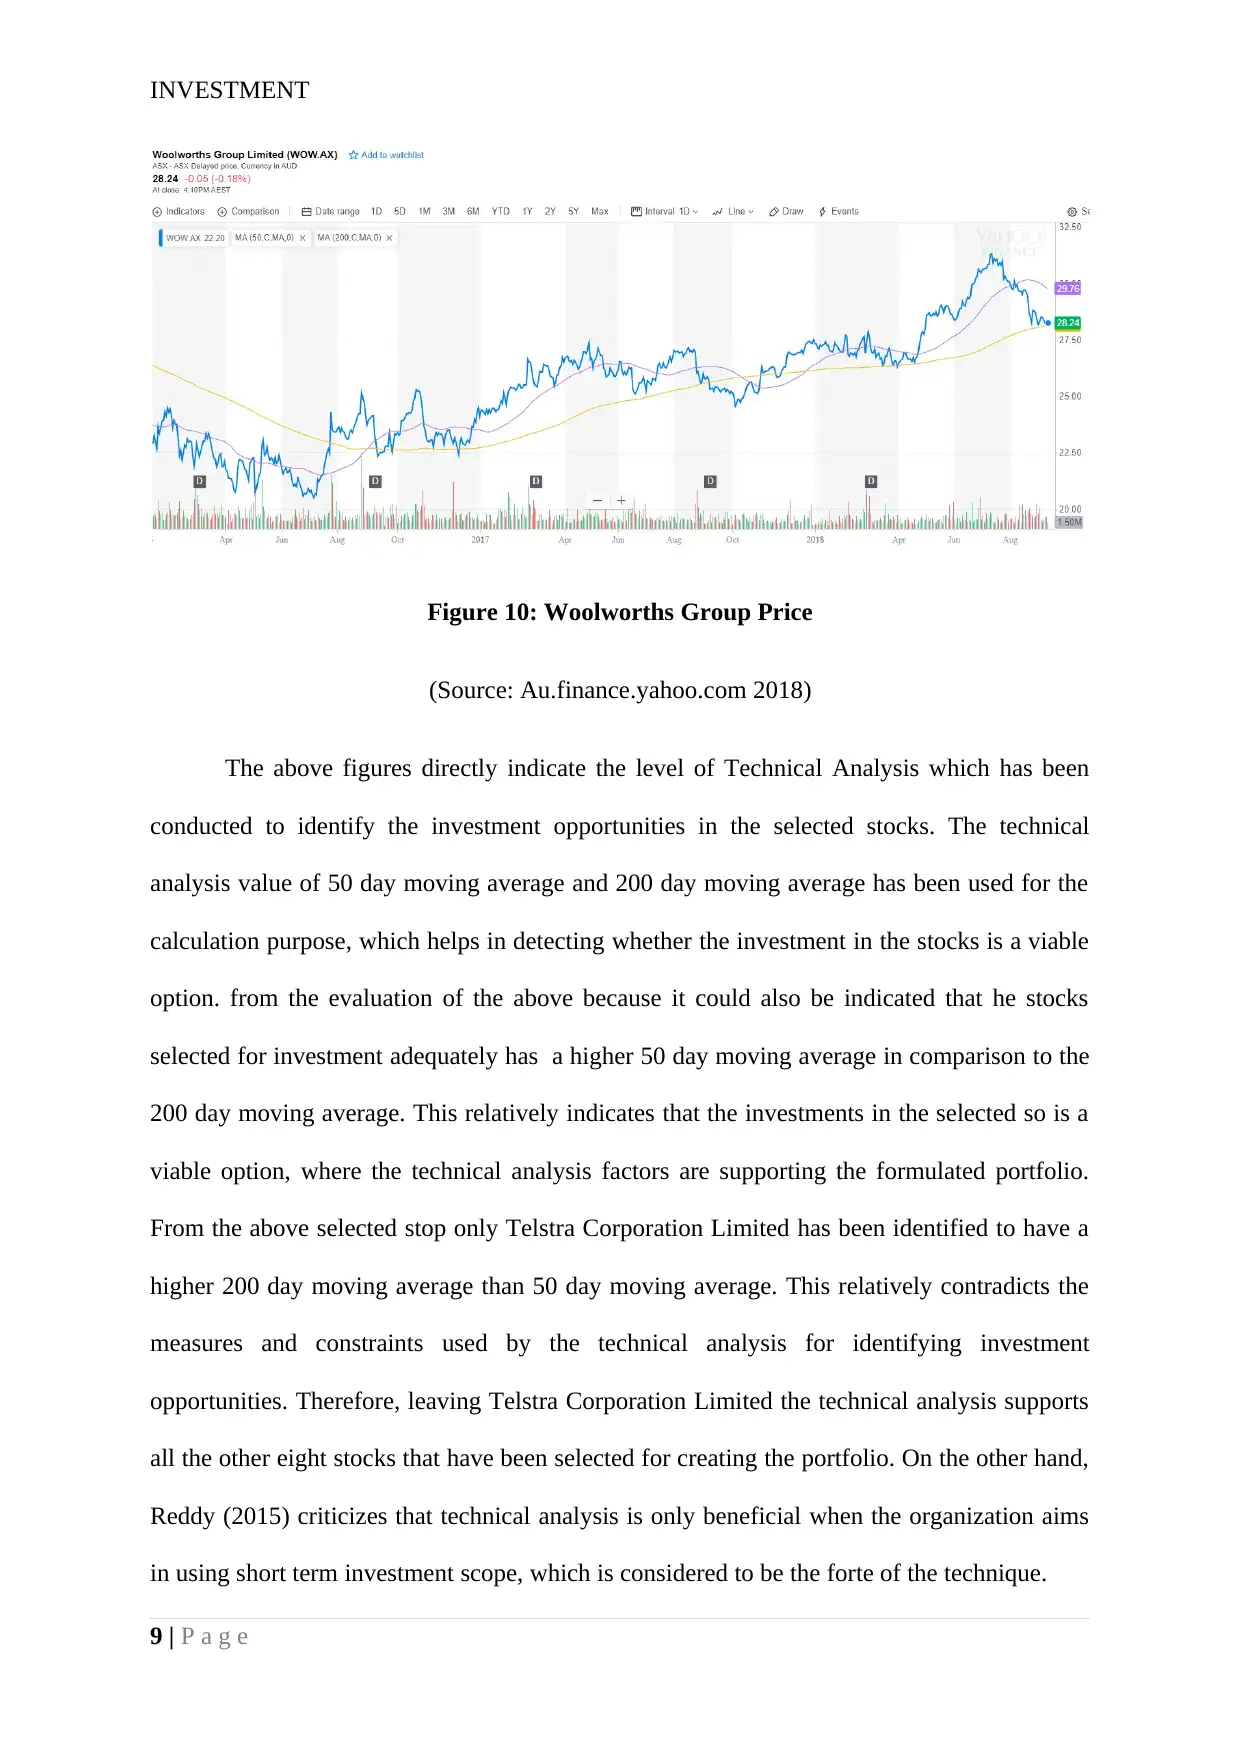
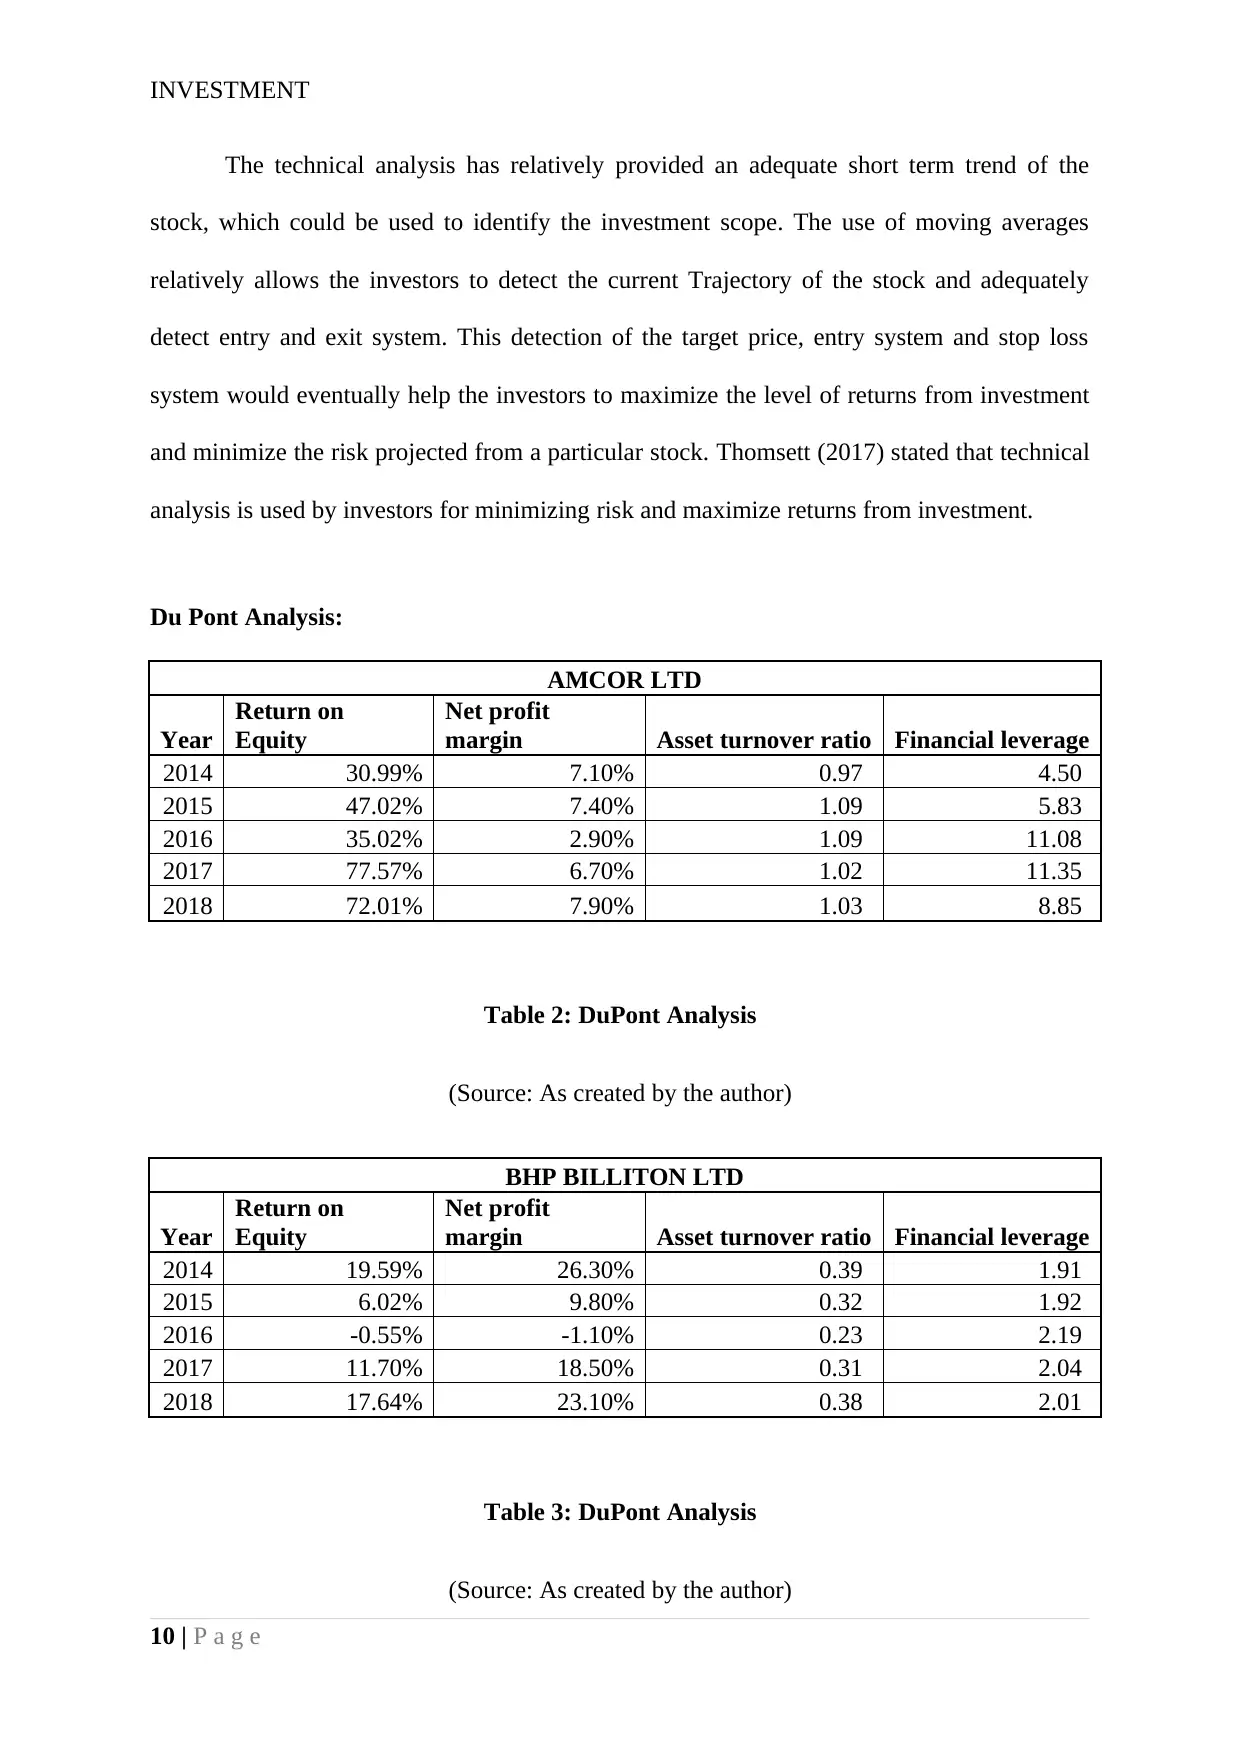
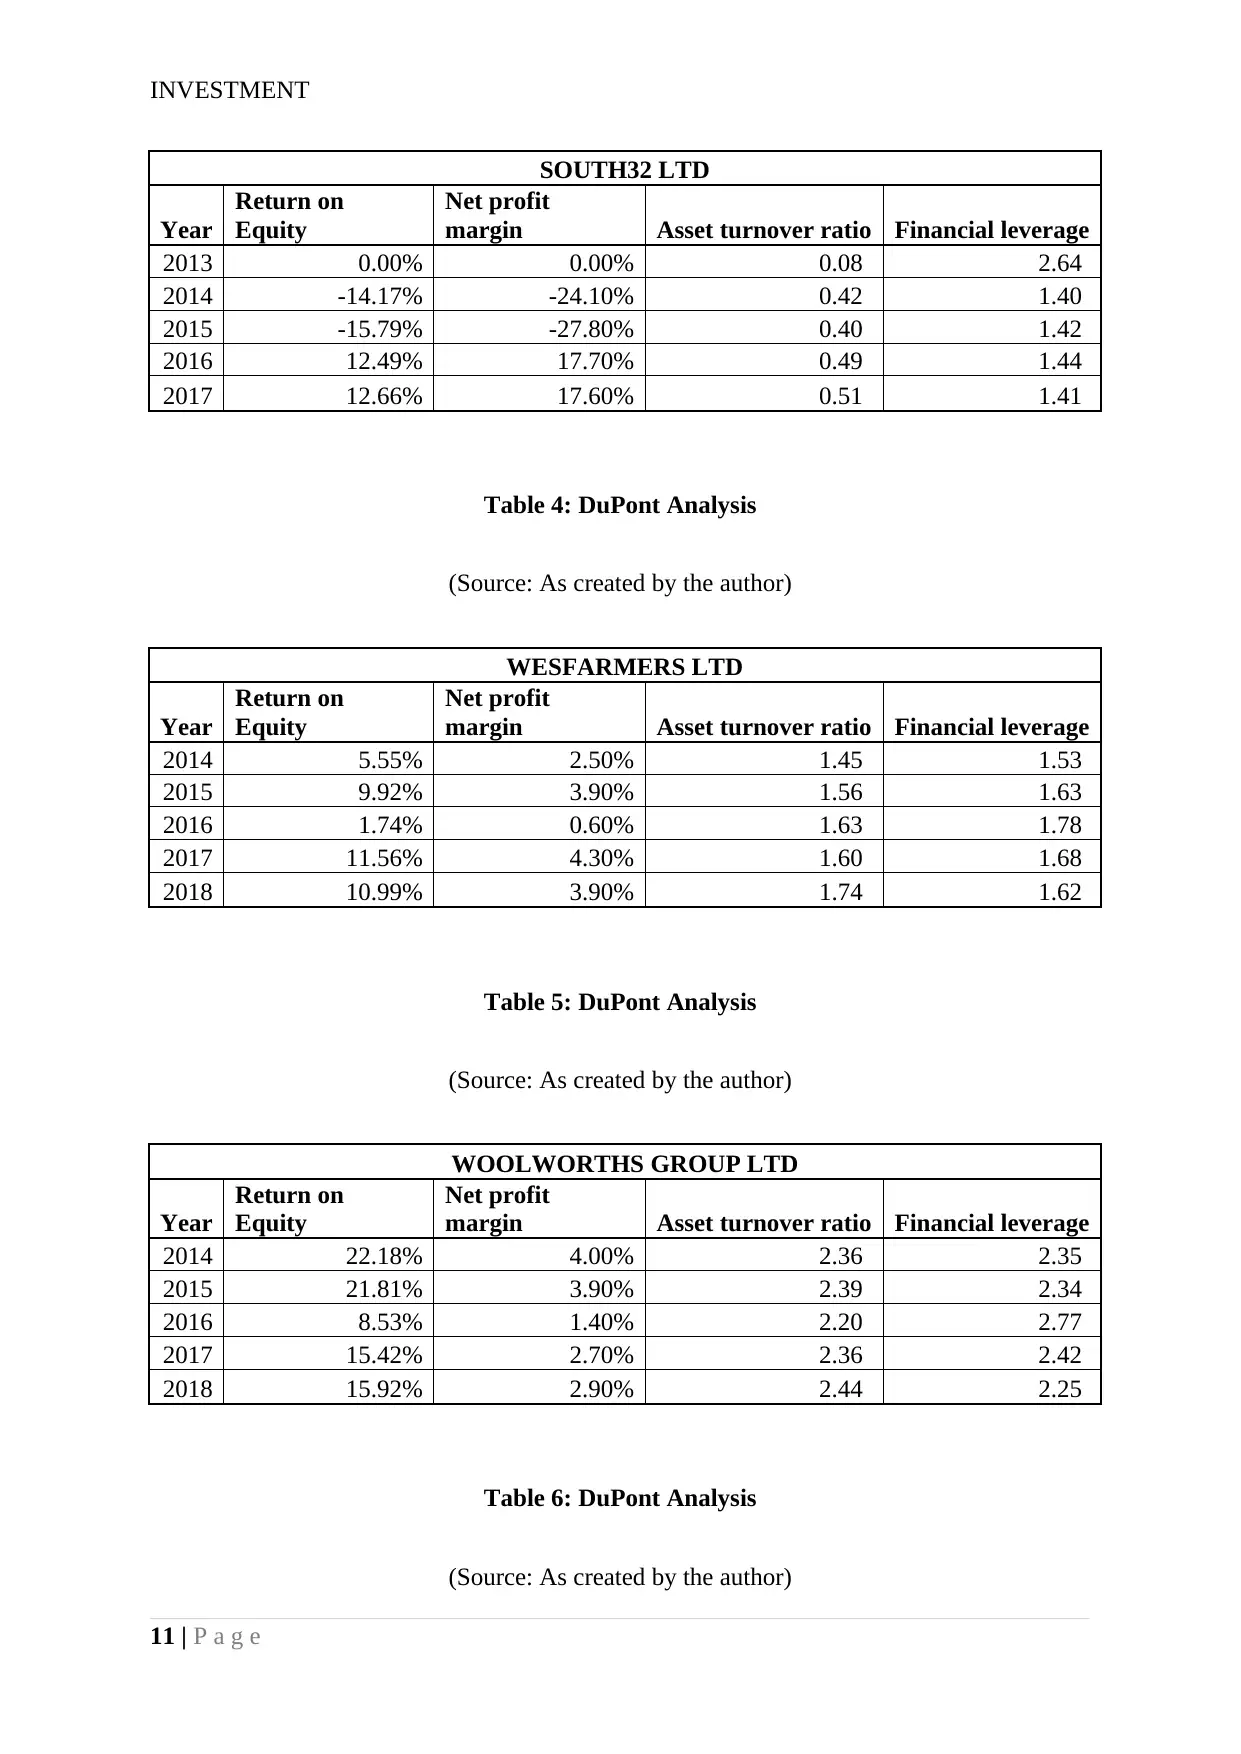
This report presents an investment analysis of nine ASX-listed companies, focusing on both value and growth investing strategies. The analysis includes fundamental analysis using peer comparisons and recommendations, and technical analysis employing moving averages to assess stock trends. DuPont analysis is also conducted to evaluate return on equity, net profit margin, asset turnover, and financial leverage for each company over a five-year period. The report concludes with a portfolio summary, recommending weights for each stock to optimize investment returns. This comprehensive analysis is designed to aid informed investment decisions.

Running head: INVESTMENT
Investment
Name of the Student:
Name of the University:
Authors Note:
Investment
Name of the Student:
Name of the University:
Authors Note:
Paraphrase This Document
Need a fresh take? Get an instant paraphrase of this document with our AI Paraphraser

INVESTMENT
Table of Contents
Introduction:...............................................................................................................................2
Stock Evaluation:.......................................................................................................................2
Fundamental Analysis:...............................................................................................................3
Technical Analysis:....................................................................................................................5
Du Pont Analysis:....................................................................................................................10
Summary and Comparison of the Portfolio:............................................................................14
Reference and Bibliography:....................................................................................................16
1 | P a g e

INVESTMENT
Introduction:
The assessment aims in identifying an adequate portfolio which contains a
combination of stocks that have the components of value investing and growth investing.
Adequate calculation of Technical Analysis and fundamental analysis are conducted in the
assessment to identify stocks which have growth probability. With the calculation of DuPont
Adequate growth and return of equity from the organization can be detected. These relevant
calculations eventually help in identifying the adequate weights in which the stocks will be
invested to form the portfolio. The segregation of 9 stocks from the 20 ASX listed companies
is conducted on the basis of economic and industry trend.
Stock Evaluation:
The stock selection process was mainly conducted on the basis of industry and
economic growth, where industries such as materials, industrials, energy, telecommunication
service, and consumer staple are considered for the investment purpose. The above-
mentioned industries are relatively gaining more income in comparison to other organization,
where the government regulations have allowed the industries to improve the current
operation. On the other hand, other industries such as banking have been under pressure due
to the change in political and regulatory views regarding the interest rates. The Global
demand of oil, energy and mining products has been increasing immensely providing
adequate growth probability for the materials industry. Hence, the stock selected from the
industries portrays adequate growth and return. In this context, Hong and Wu (2014) stated
that stocks can be segregated in two different investing measures, such as value and growth,
which allows investor to maximize the return from their exposures. On the contrary,
Edwards, Magee and Bassetti (2018) argued that without the adequate calculation the created
portfolio might increase losses from investment and hinder the investment capital.
2 | P a g e
⊘ This is a preview!⊘
Do you want full access?
Subscribe today to unlock all pages.

Trusted by 1+ million students worldwide

INVESTMENT
Value Investing Growth Investing
SOUTH32 LTD AMCOR LTD
WESFARMERS LTD BHP BILLITON LTD
WOOLWORTHS GROUP LTD TELSTRA CORPORATION LTD
BRAMBLES LTD ORIGIN ENERGY LTD
TRANSURBAN GROUP
Fundamental Analysis:
Figure 1: Depicting the Peer Analysis of the selected 9 stocks
(Source: Apac1.apps.cp.thomsonreuters.com 2018)
The above figure depicts the fundamental analysis of 9 stock selected for the
portfolio, which are analyzed on seven different fundamental factors. The major factors that
are used for analyzing the current capability of the selected stocks are dividend yield, return
on equity, PB ratio, P/E ratio, net profit margin, total debt to total equity, and long term
growth. The above mentioned factors would eventually help in detecting the current financial
position of the selected stocks. The fundamental analysis directly indicate that selected or
organization have an adequate positive train which would eventually improve the level of
3 | P a g e
Paraphrase This Document
Need a fresh take? Get an instant paraphrase of this document with our AI Paraphraser

INVESTMENT
returns from investment. From the further evaluation it would be detected that only origin
Energy Limited does not pay dividends while other organization adequately provides the
dividend to the investors. The factors used for the fundamental analysis directly indicate that
the selected stocks have a positive fundamental approach, which would eventually January
higher returns from investment. Avramov, Kaplanski and Levy (2016) mentioned that
fundamental analysis is used for detecting the financial position and how an organization
could create value and deliver growth in long term. Bartram and Grinblatt (2018) criticizes
that due to the nature of investment, fundamental analysis mainly losses the gains in long run,
as inflation erodes the capital gains obtained by the investor.
No. Company Recommendation
1 AMCOR LTD Buy
2 BHP BILLITON LTD Buy
3 SOUTH32 LTD Hold
4 WESFARMERS LTD Hold
5 WOOLWORTHS GROUP LTD Hold
6 ORIGIN ENERGY LTD Buy
7 BRAMBLES LTD Hold
8 TRANSURBAN GROUP Buy
9
TELSTRA CORPORATION
LTD Hold
Table 1: Recommendations for the selected stocks
(Source: Apac1.apps.cp.thomsonreuters.com 2018)
The Thomson Reuters Eikon online directly provides the fundamental facts, the
adequate recommendation for a particular stock is depicted. This recommendation is mainly
based on the fundamental analysis conducted by the Eikon Online. The above table represents
the level of recommendation for the selected 9 stocks.
4 | P a g e

INVESTMENT
Technical Analysis:
Figure 2: Amcor Price
(Source: Au.finance.yahoo.com 2018)
Figure 3: BHP Billiton Price
(Source: Au.finance.yahoo.com 2018)
5 | P a g e
Technical Analysis:
Figure 2: Amcor Price
(Source: Au.finance.yahoo.com 2018)
Figure 3: BHP Billiton Price
(Source: Au.finance.yahoo.com 2018)
5 | P a g e
⊘ This is a preview!⊘
Do you want full access?
Subscribe today to unlock all pages.

Trusted by 1+ million students worldwide

INVESTMENT
Figure 4: Brambles Limited Price
(Source: Au.finance.yahoo.com 2018)
Figure 5: Origin Energy Limited Price
(Source: Au.finance.yahoo.com 2018)
6 | P a g e
Figure 4: Brambles Limited Price
(Source: Au.finance.yahoo.com 2018)
Figure 5: Origin Energy Limited Price
(Source: Au.finance.yahoo.com 2018)
6 | P a g e
Paraphrase This Document
Need a fresh take? Get an instant paraphrase of this document with our AI Paraphraser

INVESTMENT
Figure 6: South32 Limited Price
(Source: Au.finance.yahoo.com 2018)
Figure 7: Telstra Corporation Price
(Source: Au.finance.yahoo.com 2018)
7 | P a g e
Figure 6: South32 Limited Price
(Source: Au.finance.yahoo.com 2018)
Figure 7: Telstra Corporation Price
(Source: Au.finance.yahoo.com 2018)
7 | P a g e

INVESTMENT
Figure 8: Transurban Group Price
(Source: Au.finance.yahoo.com 2018)
Figure 9: Wesfarmers Limited Price
(Source: Au.finance.yahoo.com 2018)
8 | P a g e
Figure 8: Transurban Group Price
(Source: Au.finance.yahoo.com 2018)
Figure 9: Wesfarmers Limited Price
(Source: Au.finance.yahoo.com 2018)
8 | P a g e
⊘ This is a preview!⊘
Do you want full access?
Subscribe today to unlock all pages.

Trusted by 1+ million students worldwide

INVESTMENT
Figure 10: Woolworths Group Price
(Source: Au.finance.yahoo.com 2018)
The above figures directly indicate the level of Technical Analysis which has been
conducted to identify the investment opportunities in the selected stocks. The technical
analysis value of 50 day moving average and 200 day moving average has been used for the
calculation purpose, which helps in detecting whether the investment in the stocks is a viable
option. from the evaluation of the above because it could also be indicated that he stocks
selected for investment adequately has a higher 50 day moving average in comparison to the
200 day moving average. This relatively indicates that the investments in the selected so is a
viable option, where the technical analysis factors are supporting the formulated portfolio.
From the above selected stop only Telstra Corporation Limited has been identified to have a
higher 200 day moving average than 50 day moving average. This relatively contradicts the
measures and constraints used by the technical analysis for identifying investment
opportunities. Therefore, leaving Telstra Corporation Limited the technical analysis supports
all the other eight stocks that have been selected for creating the portfolio. On the other hand,
Reddy (2015) criticizes that technical analysis is only beneficial when the organization aims
in using short term investment scope, which is considered to be the forte of the technique.
9 | P a g e
Paraphrase This Document
Need a fresh take? Get an instant paraphrase of this document with our AI Paraphraser

INVESTMENT
The technical analysis has relatively provided an adequate short term trend of the
stock, which could be used to identify the investment scope. The use of moving averages
relatively allows the investors to detect the current Trajectory of the stock and adequately
detect entry and exit system. This detection of the target price, entry system and stop loss
system would eventually help the investors to maximize the level of returns from investment
and minimize the risk projected from a particular stock. Thomsett (2017) stated that technical
analysis is used by investors for minimizing risk and maximize returns from investment.
Du Pont Analysis:
AMCOR LTD
Year
Return on
Equity
Net profit
margin Asset turnover ratio Financial leverage
2014 30.99% 7.10% 0.97 4.50
2015 47.02% 7.40% 1.09 5.83
2016 35.02% 2.90% 1.09 11.08
2017 77.57% 6.70% 1.02 11.35
2018 72.01% 7.90% 1.03 8.85
Table 2: DuPont Analysis
(Source: As created by the author)
BHP BILLITON LTD
Year
Return on
Equity
Net profit
margin Asset turnover ratio Financial leverage
2014 19.59% 26.30% 0.39 1.91
2015 6.02% 9.80% 0.32 1.92
2016 -0.55% -1.10% 0.23 2.19
2017 11.70% 18.50% 0.31 2.04
2018 17.64% 23.10% 0.38 2.01
Table 3: DuPont Analysis
(Source: As created by the author)
10 | P a g e

INVESTMENT
SOUTH32 LTD
Year
Return on
Equity
Net profit
margin Asset turnover ratio Financial leverage
2013 0.00% 0.00% 0.08 2.64
2014 -14.17% -24.10% 0.42 1.40
2015 -15.79% -27.80% 0.40 1.42
2016 12.49% 17.70% 0.49 1.44
2017 12.66% 17.60% 0.51 1.41
Table 4: DuPont Analysis
(Source: As created by the author)
WESFARMERS LTD
Year
Return on
Equity
Net profit
margin Asset turnover ratio Financial leverage
2014 5.55% 2.50% 1.45 1.53
2015 9.92% 3.90% 1.56 1.63
2016 1.74% 0.60% 1.63 1.78
2017 11.56% 4.30% 1.60 1.68
2018 10.99% 3.90% 1.74 1.62
Table 5: DuPont Analysis
(Source: As created by the author)
WOOLWORTHS GROUP LTD
Year
Return on
Equity
Net profit
margin Asset turnover ratio Financial leverage
2014 22.18% 4.00% 2.36 2.35
2015 21.81% 3.90% 2.39 2.34
2016 8.53% 1.40% 2.20 2.77
2017 15.42% 2.70% 2.36 2.42
2018 15.92% 2.90% 2.44 2.25
Table 6: DuPont Analysis
(Source: As created by the author)
11 | P a g e
⊘ This is a preview!⊘
Do you want full access?
Subscribe today to unlock all pages.

Trusted by 1+ million students worldwide
1 out of 19
Related Documents

Your All-in-One AI-Powered Toolkit for Academic Success.
+13062052269
info@desklib.com
Available 24*7 on WhatsApp / Email
Unlock your academic potential
Copyright © 2020–2025 A2Z Services. All Rights Reserved. Developed and managed by ZUCOL.