BAFN200 Principles of Finance: Retail Food Group Analysis (2018)
VerifiedAdded on 2023/06/12
|9
|2005
|357
Report
AI Summary
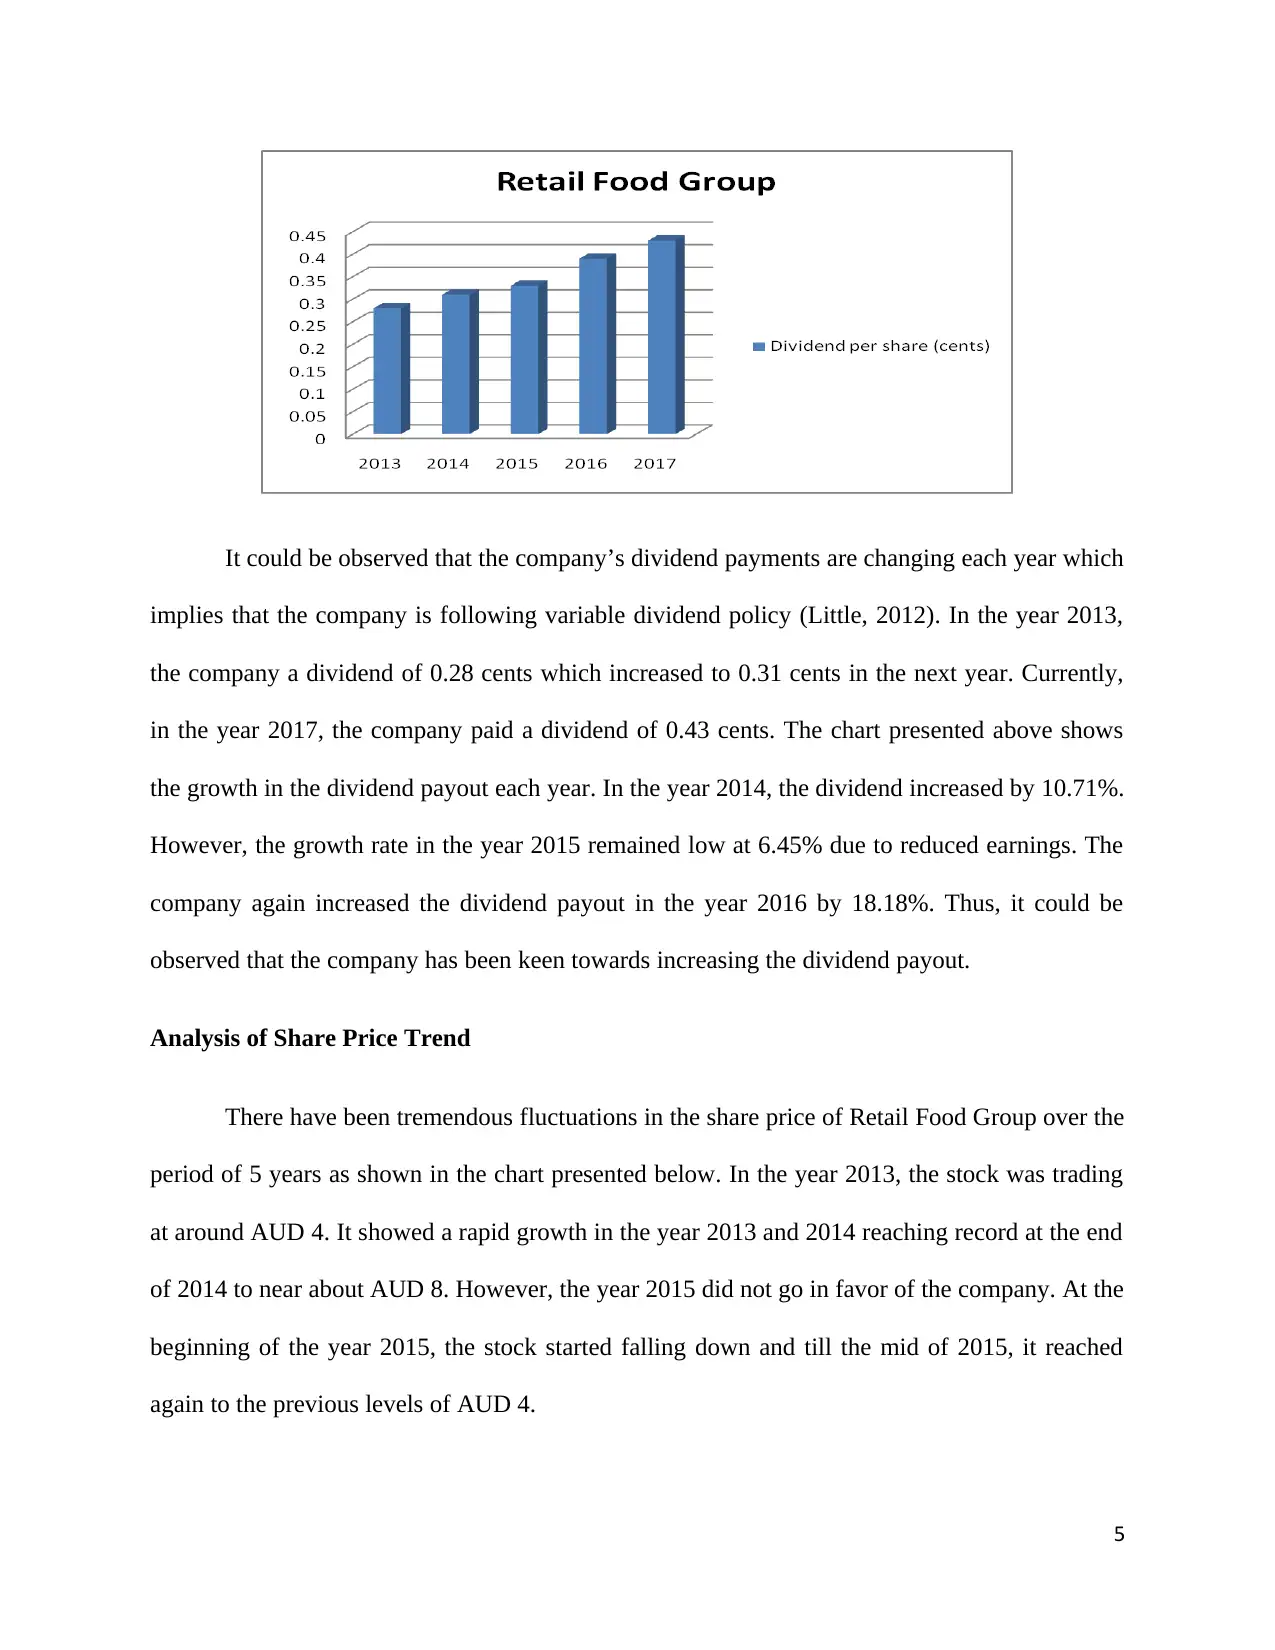
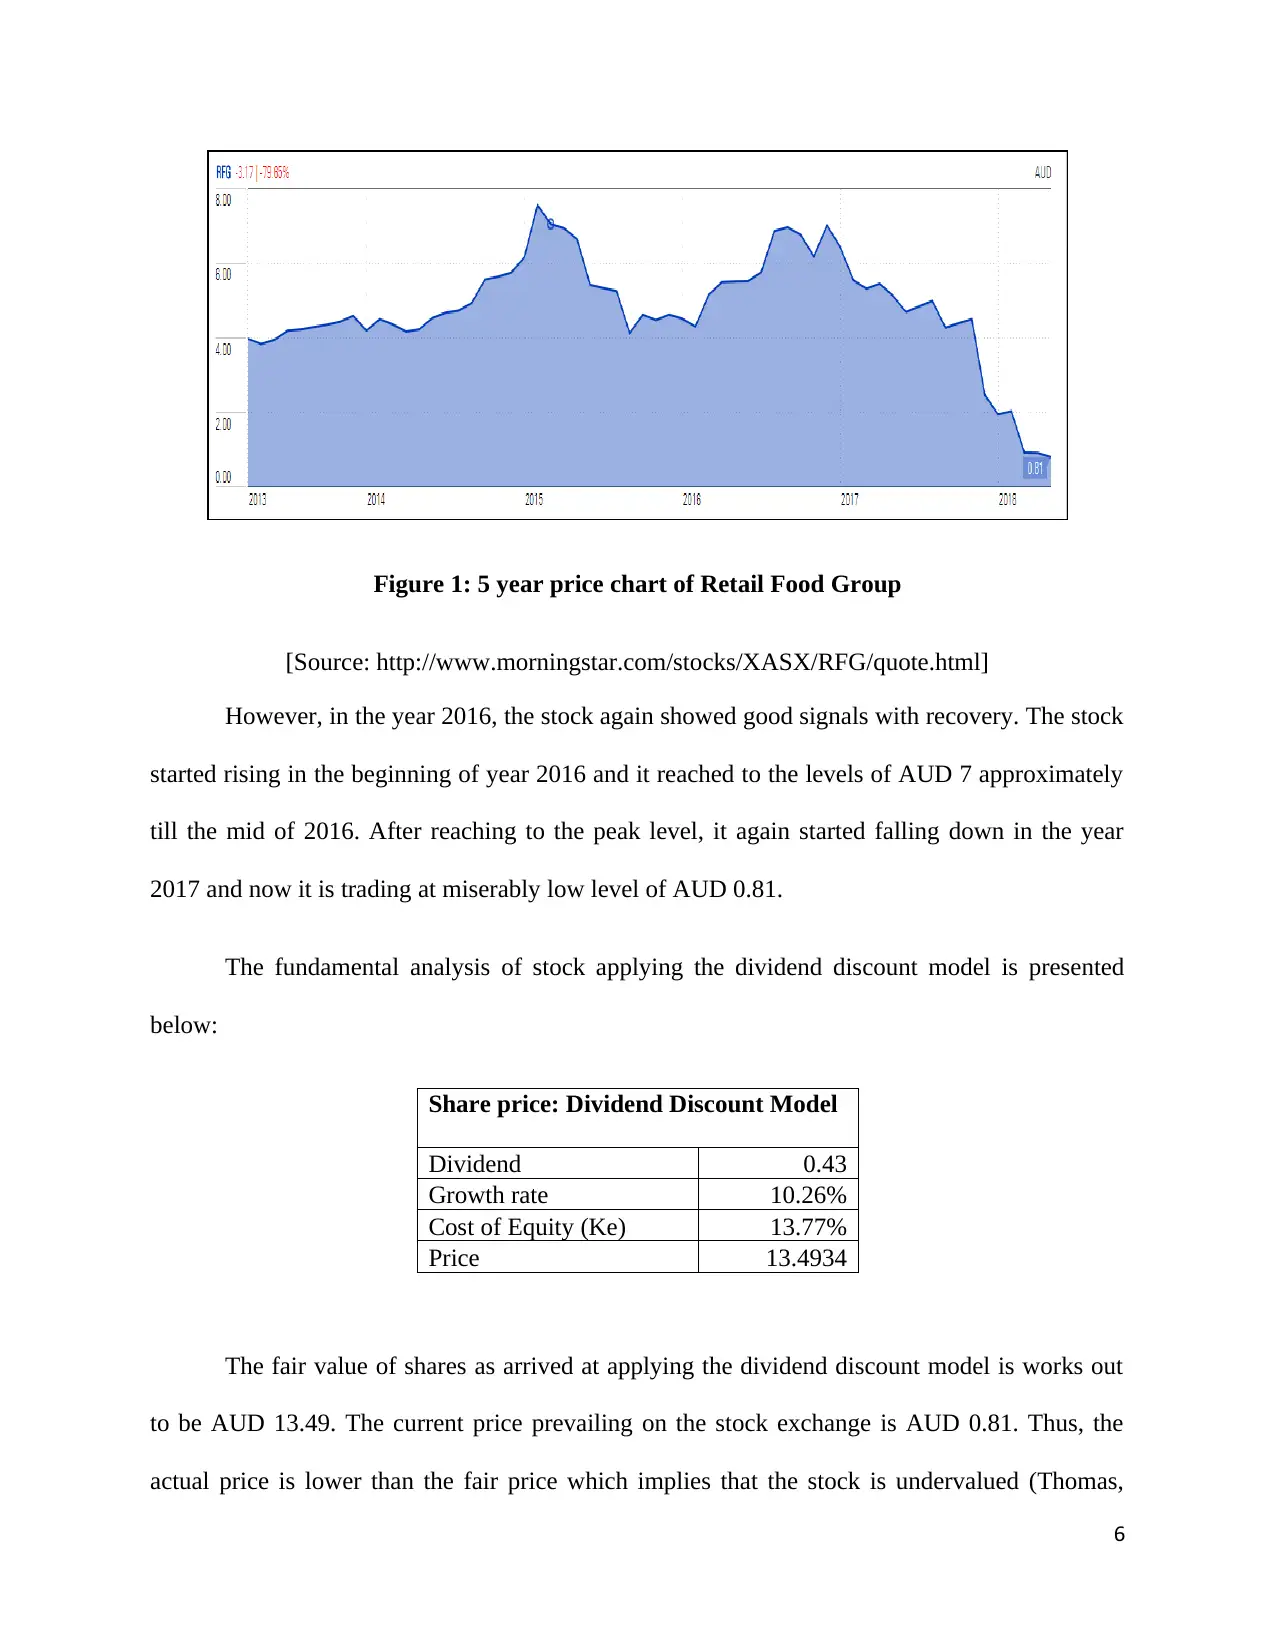
This report provides an analysis of Retail Food Group Limited, focusing on its capital structure, dividend policy, and share price trends over a five-year period. The analysis assesses whether the company's capital structure is optimal by examining its debt-to-equity ratio and comparing it to industry standards, concluding that the company has not maintained an optimal capital structure. The report also evaluates the company's dividend history, noting its variable dividend policy and consistent dividend growth. Furthermore, the share price trend is analyzed, revealing significant fluctuations and a recent sharp decline. A dividend discount model suggests the stock is undervalued, but concerns about the company's franchise system raise questions about its investment attractiveness. The report concludes that while the company's financial performance has been good, current challenges within the franchise system warrant caution for potential investors.

Principles of Finance
1
1
Paraphrase This Document
Need a fresh take? Get an instant paraphrase of this document with our AI Paraphraser

Introduction
This report presents an analysis of capital structure, dividend policy and the trend in share
price of Retail Food Group Limited, a company listed on the Australian Stock Exchange. Retail
Food Group Limited operates through various franchises in Australia in the retail food sector.
The primary business of the company includes coffee roasting and wholesale of coffee. The
company was founded in the year 1989 and since then it has grown manifold to hold at present
2500 outlets with 12 brands spread in 83 territories across Australia (RFG, 2018).
The main purpose of the report is find out whether the company’s capital structure is
optimal or not and whether or not the company is a worthy investment choice for the investors.
For this purpose, the analysis has been extended on the data for a period of 5 years.
Analysis of Capital Structure
The capital structure of a company comprises the component of capital such as equity,
preferred capital, and debt. Every company needs money to finance its assets and this financing
need is accomplished by raising money from equity and debt (Grabowski, Nunes, and
Harrington, 2017). Thus, equity and debt are the two major components of the capital structure
of the company. The equity and debt differs in terms of risk and return characteristics and it is
therefore necessary for a company to maintain proper balance between these two. The overall
return of a company is increased when the company utilizes an optimal capital structure. An
optimal capital structure is one which comprises the debt and equity in the adequate proportions.
Ideally when the company has debt and equity in the ratio of 2:1, it is considered that it has
optimal capital structure (Grabowski, Nunes, and Harrington, 2017). However, this is not the
2

rigid requirement, a company with debt more than 2/3rd or less than 2/3rd could also be said to
have optimal capital structure having regards to the type of industry in which it operates.
In relation to Retail Food Group, the capital structure over the period of 5 years has been
analyzed as under:
Capital Structure: Retail Food Group
AUD Million
2013 2014 2015 2016 2017
Debt 109 71 208 207 246
Equity 240 310 404 434 465
Debt to
Equity 45.42% 22.90% 51.49% 47.70% 52.90%
[Source: Morning Star, 2018]
It could be observed that the debt equity ratio of the company has been fluctuating over
the period of 5 years. In the year 2013, the ratio was 45.42% and it reduced to 22.90% in the year
2014. This shows that the company relied more on the equity and repaid the debt owed in the
year 2013. However, in the next year, the ratio again rose to 51.49% and finally it stands at
52.90% in the year 2017. Therefore, presently the company uses debt amounting to 52.90% of
total equity which seems to be low looking at the ideal ratio. According to ideal ratio, the
company can use debt amounting to 200% of the total equity. Thus, there is scope of raising
more debt. The increase in debt would reduce of cost of capital and enhance wealth of the
shareholders. Further, the company’s profitability is increasing rapidly which implies that the
company has good capacity to repay its debt. The net profit of the company in the year 2013 was
3
⊘ This is a preview!⊘
Do you want full access?
Subscribe today to unlock all pages.

Trusted by 1+ million students worldwide

AUD 32 Million which increased to AUD 62 million in the year 2017 (Morning Star, 2018).
Thus, it could be inferred that the company has not been able to maintain an optimal capital
structure (Grabowski, Nunes, and Harrington, 2017).
Analysis of Dividend History
The analysis of dividend paid by the company is essential from the view point of the
investors. The investors look for dividend payout and consider the companies paying good
dividend as attractive for investment. There are various policies in respect of dividend payment
that a company may follow (Little, 2012). A company may follow constant dividend amount
policy wherein the company pays a constant amount of dividend per share each year. Further, a
company may also follow variable dividend policies wherein the company pays dividend as a
certain percentage of its earnings. Moreover, a company may also use a combination of constant
and variable dividend payout (Little, 2012). In the case of Retail Food Group, the dividend
payments over the period of past 5 years have been analyzed as under:
Dividend History:
Retail Food Group
2013 2014 2015 2016 2017
Dividend per share
(cents) 0.28 0.31 0.33 0.39 0.43
Growth rate 10.71% 6.45% 18.18% 10.26%
4
Paraphrase This Document
Need a fresh take? Get an instant paraphrase of this document with our AI Paraphraser

It could be observed that the company’s dividend payments are changing each year which
implies that the company is following variable dividend policy (Little, 2012). In the year 2013,
the company a dividend of 0.28 cents which increased to 0.31 cents in the next year. Currently,
in the year 2017, the company paid a dividend of 0.43 cents. The chart presented above shows
the growth in the dividend payout each year. In the year 2014, the dividend increased by 10.71%.
However, the growth rate in the year 2015 remained low at 6.45% due to reduced earnings. The
company again increased the dividend payout in the year 2016 by 18.18%. Thus, it could be
observed that the company has been keen towards increasing the dividend payout.
Analysis of Share Price Trend
There have been tremendous fluctuations in the share price of Retail Food Group over the
period of 5 years as shown in the chart presented below. In the year 2013, the stock was trading
at around AUD 4. It showed a rapid growth in the year 2013 and 2014 reaching record at the end
of 2014 to near about AUD 8. However, the year 2015 did not go in favor of the company. At the
beginning of the year 2015, the stock started falling down and till the mid of 2015, it reached
again to the previous levels of AUD 4.
5

Figure 1: 5 year price chart of Retail Food Group
[Source: http://www.morningstar.com/stocks/XASX/RFG/quote.html]
However, in the year 2016, the stock again showed good signals with recovery. The stock
started rising in the beginning of year 2016 and it reached to the levels of AUD 7 approximately
till the mid of 2016. After reaching to the peak level, it again started falling down in the year
2017 and now it is trading at miserably low level of AUD 0.81.
The fundamental analysis of stock applying the dividend discount model is presented
below:
Share price: Dividend Discount Model
Dividend 0.43
Growth rate 10.26%
Cost of Equity (Ke) 13.77%
Price 13.4934
The fair value of shares as arrived at applying the dividend discount model is works out
to be AUD 13.49. The current price prevailing on the stock exchange is AUD 0.81. Thus, the
actual price is lower than the fair price which implies that the stock is undervalued (Thomas,
6
⊘ This is a preview!⊘
Do you want full access?
Subscribe today to unlock all pages.

Trusted by 1+ million students worldwide

2014). Further, the analysis of dividend and earnings of the company also shows that the stock
has capacity to create wealth for the shareholders. However, recently it has been observed to be
going to a record low.
The efficient market hypothesis states that the prices of stocks are not affected by the
flow of information in the market. However, the recent collapse of the stock of Retail Food
Group shows that efficient hypothesis market is not true (Thomas, 2014). The stock of Retail
Food Group fell sharply down to lowest level of 10 years. There has been announcement from
the company to shut down its 200 stores by the end of 2019 (Chau, 2018). This news in the
market has creates chaos among the investors causing reduction in the stock’s price.
Evaluation of Attractiveness of Investment
The results of fundamental analysis show that the company’s financial performance has
been good. It earned a profit of AUD 62 million in the year 2017 which is up from the last year’s
profits of AUD 53 million. Further, the company has been paying attractive dividends over the
past years which also support attractiveness of the company’s stock. However, the capital
structure of the company has not been optimal. If the company changes its capital structure a
little by increasing the portion of debt, the earnings of the company might further improve in the
future years. Apart from these observations, the results of dividend discount model shows that
the company’s stock is underpriced. Thus, if we go based on the fundamental analysis purely, the
stock of the company appears worth investing (Thomas, 2014).
However, the company has been seen to be facing big problems with its franchise system
recently. There are various franchises which are not happy with the functioning of the company
and they are considering disassociating themselves with the company. It is important to take note
7
Paraphrase This Document
Need a fresh take? Get an instant paraphrase of this document with our AI Paraphraser

that the major earnings of the company are dependent upon the franchise system. If the franchise
system fails, the company might incur huge losses. There are apprehensions in the market that
the franchise network of the company will be broken in future and due to these apprehensions,
the stock has fallen down to a record level (Chau, 2018).
Thus, overall it could be inferred that the company is good for investment but considering
the current situation company facing problems, the investors are advised to refrain from
investing in the company.
Conclusion
The report provides a succinct discussion on the financial performance of Retail Food
Group and its attractiveness for the investors. The financial performance of the company seems
to be good, but the company is struggling with its franchise system which is key to the
company’s success.
8

References
Chau, D. 2018. Retail Food Group stocks hit 10-year low on $88m loss and 200 stores to be
closed. [Online]. Available at: http://www.abc.net.au/news/2018-03-05/retail-food-group-shares-
plunge-on-store-closures/9509156 [Accessed on: May 21, 2018].
Grabowski, R.J., Nunes, C., and Harrington, J.P. 2017. 2017 Valuation Handbook - U.S. Guide
to Cost of Capital. John Wiley & Sons.
Little, K. 2012. Teach Yourself Investing In 24 Easy Lessons, 2e. Penguin.
Morning Star. 2018. Retail Food Group Ltd. [Online]. Available at:
RFG http://financials.morningstar.com/income-statement/is.html?
t=RFG®ion=aus&culture=en-US&platform=sal [Accessed on: May 21, 2018].
RFG. 2018. Welcome to RFG (Retail Food Group). [Online]. Available at:
http://rfg.com.au/about/ [Accessed on: May 21, 2018].
Thomas, S. 2014. Security Analysis and Portfolio Management. PHI Learning Pvt. Ltd.
9
⊘ This is a preview!⊘
Do you want full access?
Subscribe today to unlock all pages.

Trusted by 1+ million students worldwide
1 out of 9
Related Documents
Your All-in-One AI-Powered Toolkit for Academic Success.
+13062052269
info@desklib.com
Available 24*7 on WhatsApp / Email
Unlock your academic potential
Copyright © 2020–2025 A2Z Services. All Rights Reserved. Developed and managed by ZUCOL.


