Analyzing CMI Company's Performance: A Balanced Scorecard Project
VerifiedAdded on 2021/11/16
|12
|3002
|497
Project
AI Summary
This project presents a comprehensive analysis of CMI Company's performance and strategic planning using the Balanced Scorecard framework. The project begins with a detailed sales and production budget, including calculations for direct material usage, material purchase, direct labor, fixed production overhead, and the value of closing finished stock, culminating in a budgeted profit and loss account. It then delves into variance analysis, calculating and interpreting direct material, direct labor, variable production overhead, fixed overhead, and sales variances to assess the effectiveness of cost control and sales strategies. Finally, the project applies the Balanced Scorecard, outlining its components, perspectives (financial, customer, internal processes, and learning & growth), and strategic objectives, including a strategy map for high-quality product and furniture to customers, to evaluate and improve CMI Company's overall performance, providing a framework for strategic alignment and performance measurement.
1
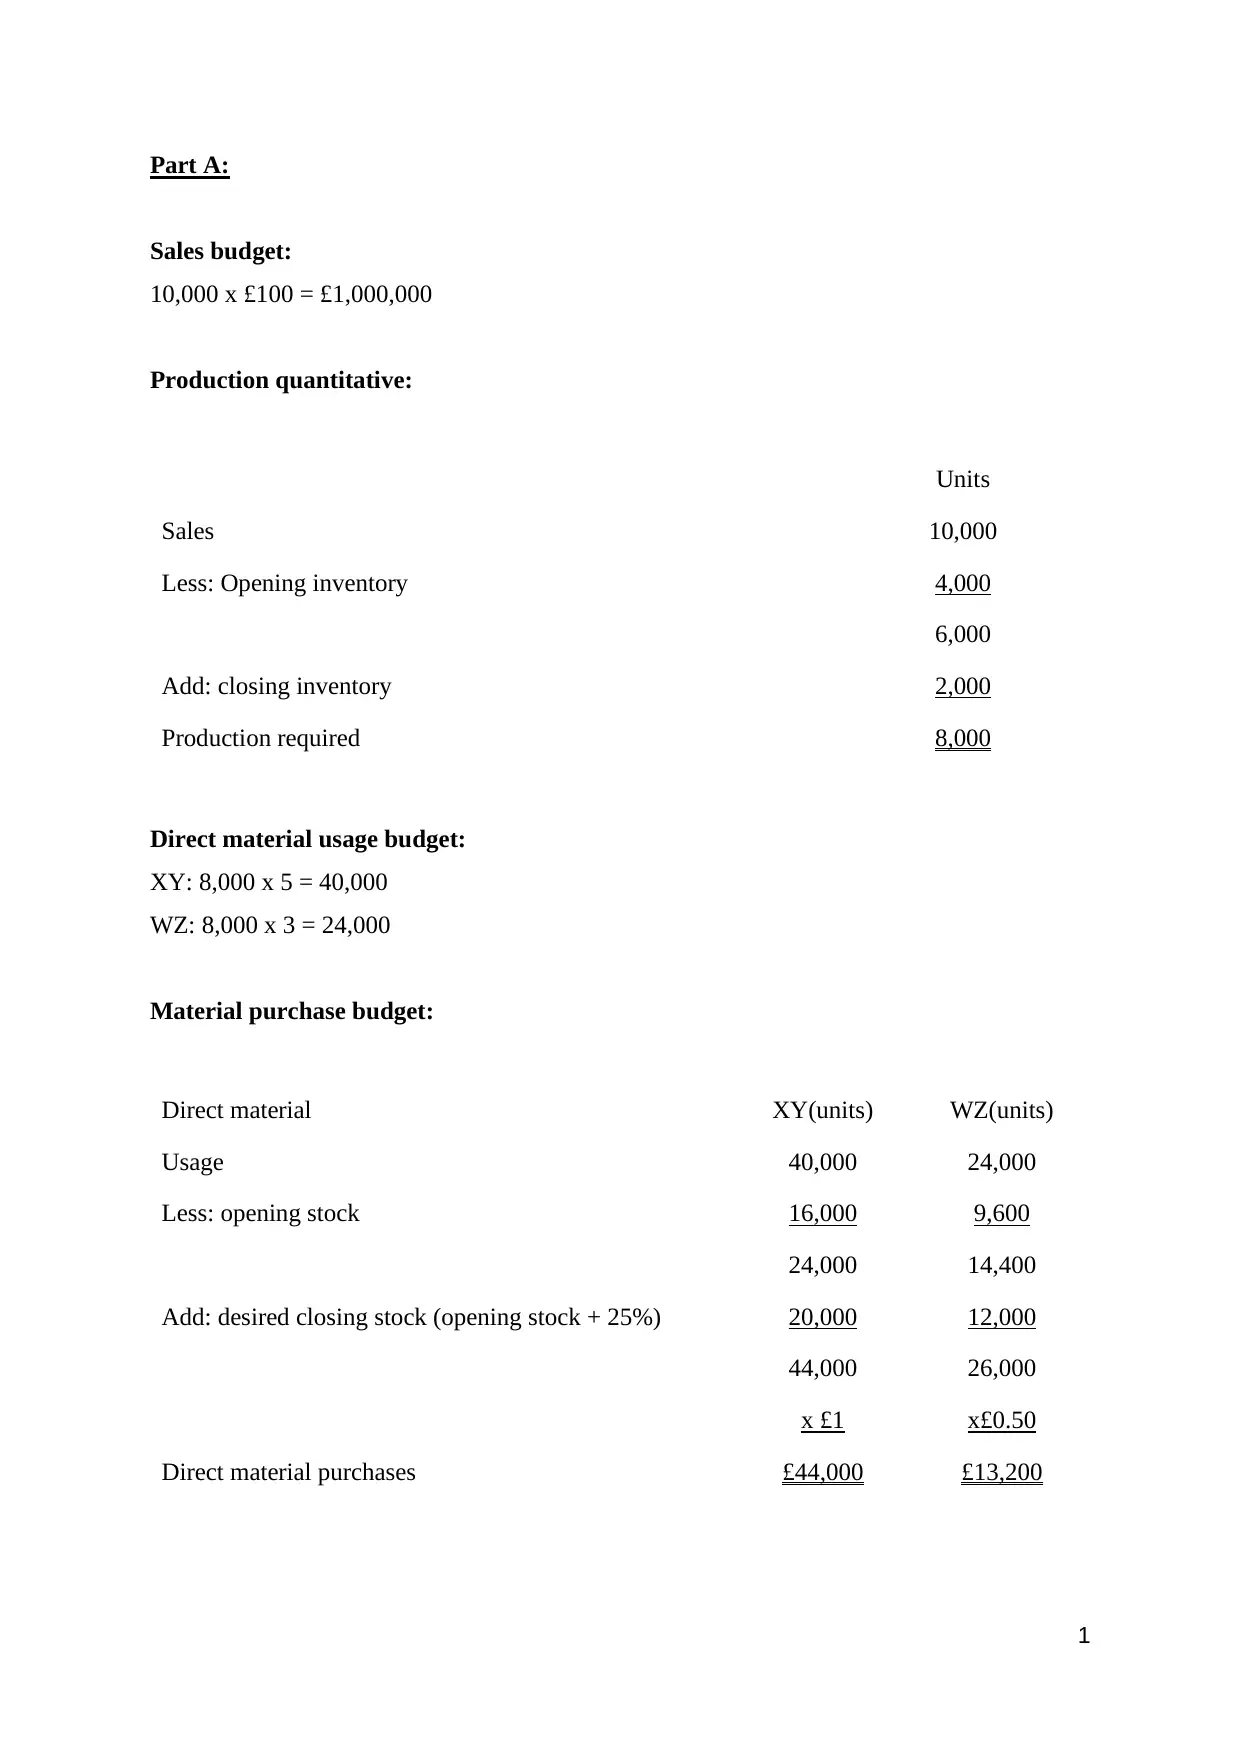
Part A:
Sales budget:
10,000 x £100 = £1,000,000
Production quantitative:
Units
Sales 10,000
Less: Opening inventory 4,000
6,000
Add: closing inventory 2,000
Production required 8,000
Direct material usage budget:
XY: 8,000 x 5 = 40,000
WZ: 8,000 x 3 = 24,000
Material purchase budget:
Direct material XY(units) WZ(units)
Usage 40,000 24,000
Less: opening stock 16,000 9,600
24,000 14,400
Add: desired closing stock (opening stock + 25%) 20,000 12,000
44,000 26,000
x £1 x£0.50
Direct material purchases £44,000 £13,200
Paraphrase This Document
Need a fresh take? Get an instant paraphrase of this document with our AI Paraphraser
2
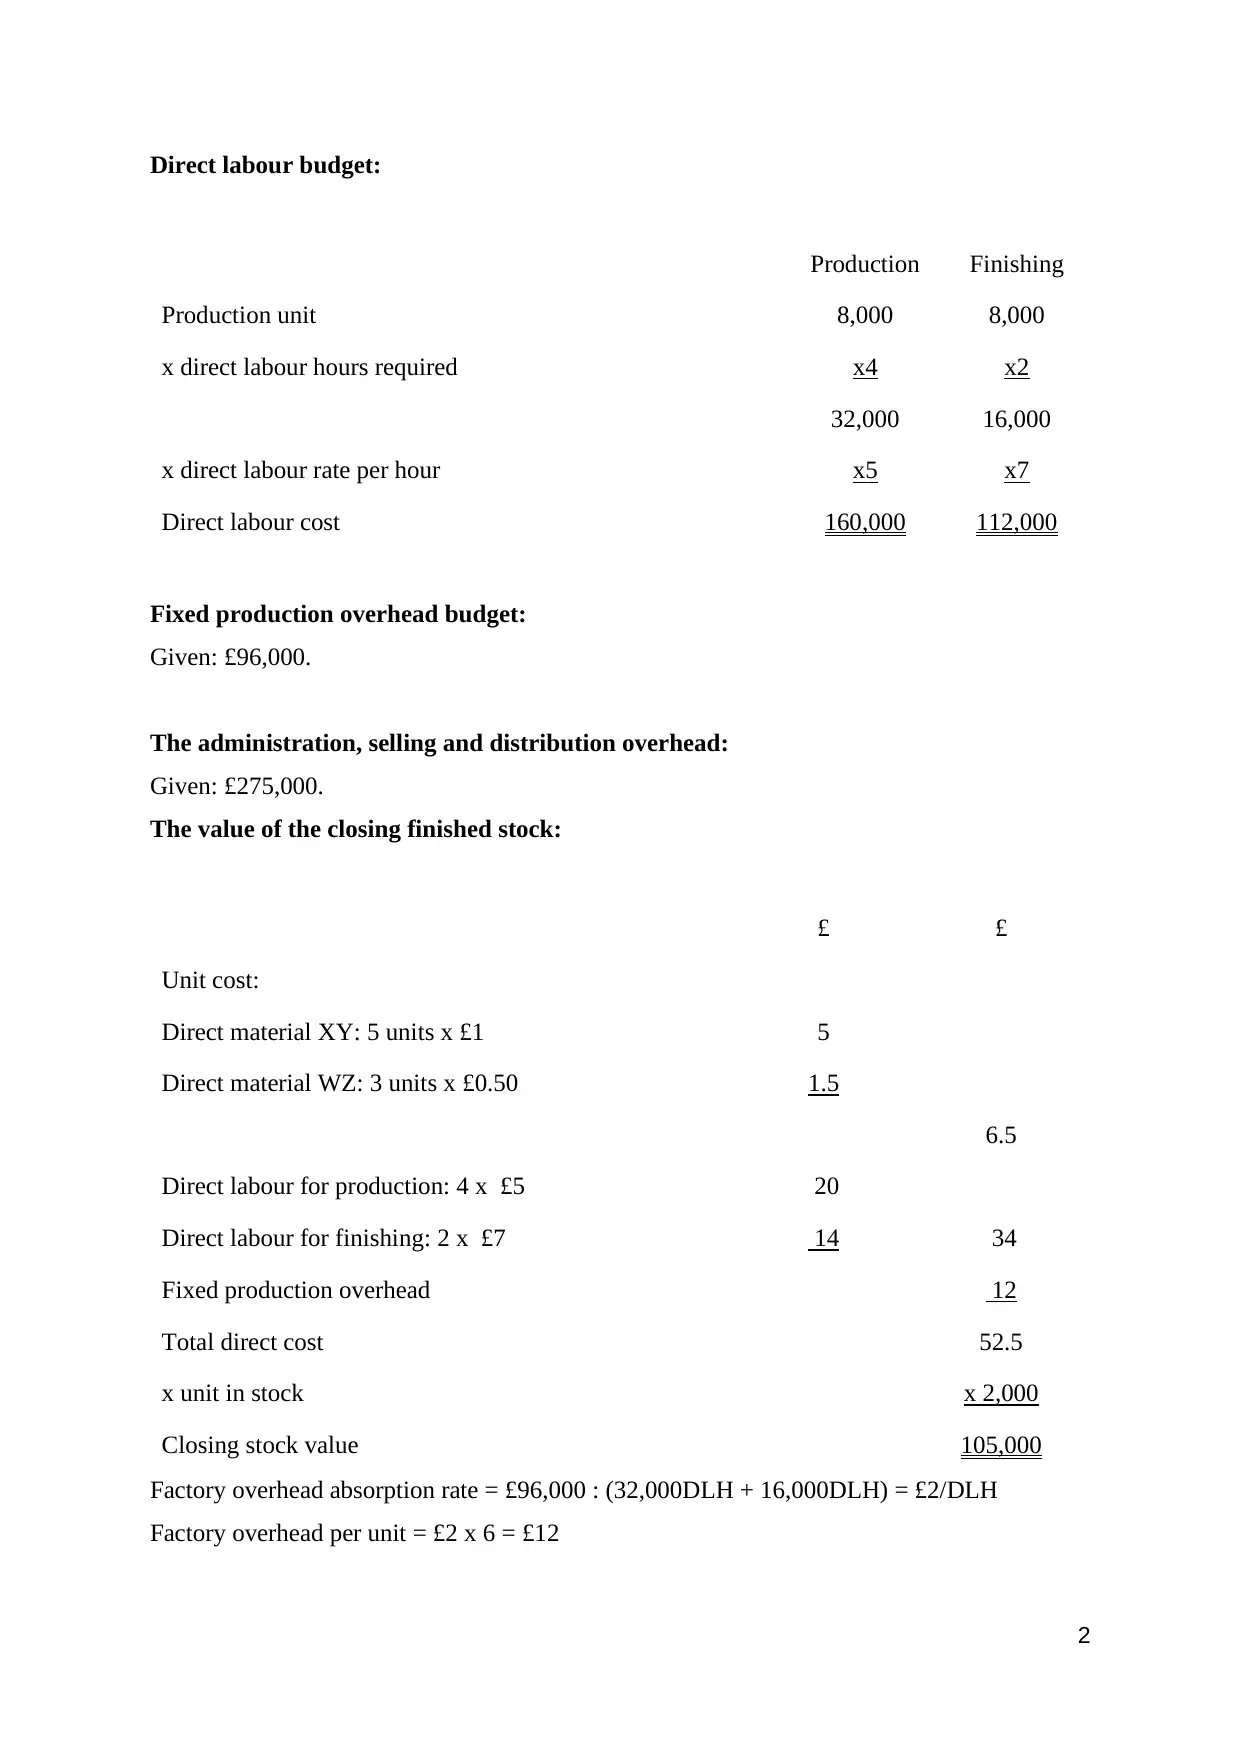
Direct labour budget:
Production Finishing
Production unit 8,000 8,000
x direct labour hours required x4 x2
32,000 16,000
x direct labour rate per hour x5 x7
Direct labour cost 160,000 112,000
Fixed production overhead budget:
Given: £96,000.
The administration, selling and distribution overhead:
Given: £275,000.
The value of the closing finished stock:
£ £
Unit cost:
Direct material XY: 5 units x £1 5
Direct material WZ: 3 units x £0.50 1.5
6.5
Direct labour for production: 4 x £5 20
Direct labour for finishing: 2 x £7 14 34
Fixed production overhead 12
Total direct cost 52.5
x unit in stock x 2,000
Closing stock value 105,000
Factory overhead absorption rate = £96,000 : (32,000DLH + 16,000DLH) = £2/DLH
Factory overhead per unit = £2 x 6 = £12
3
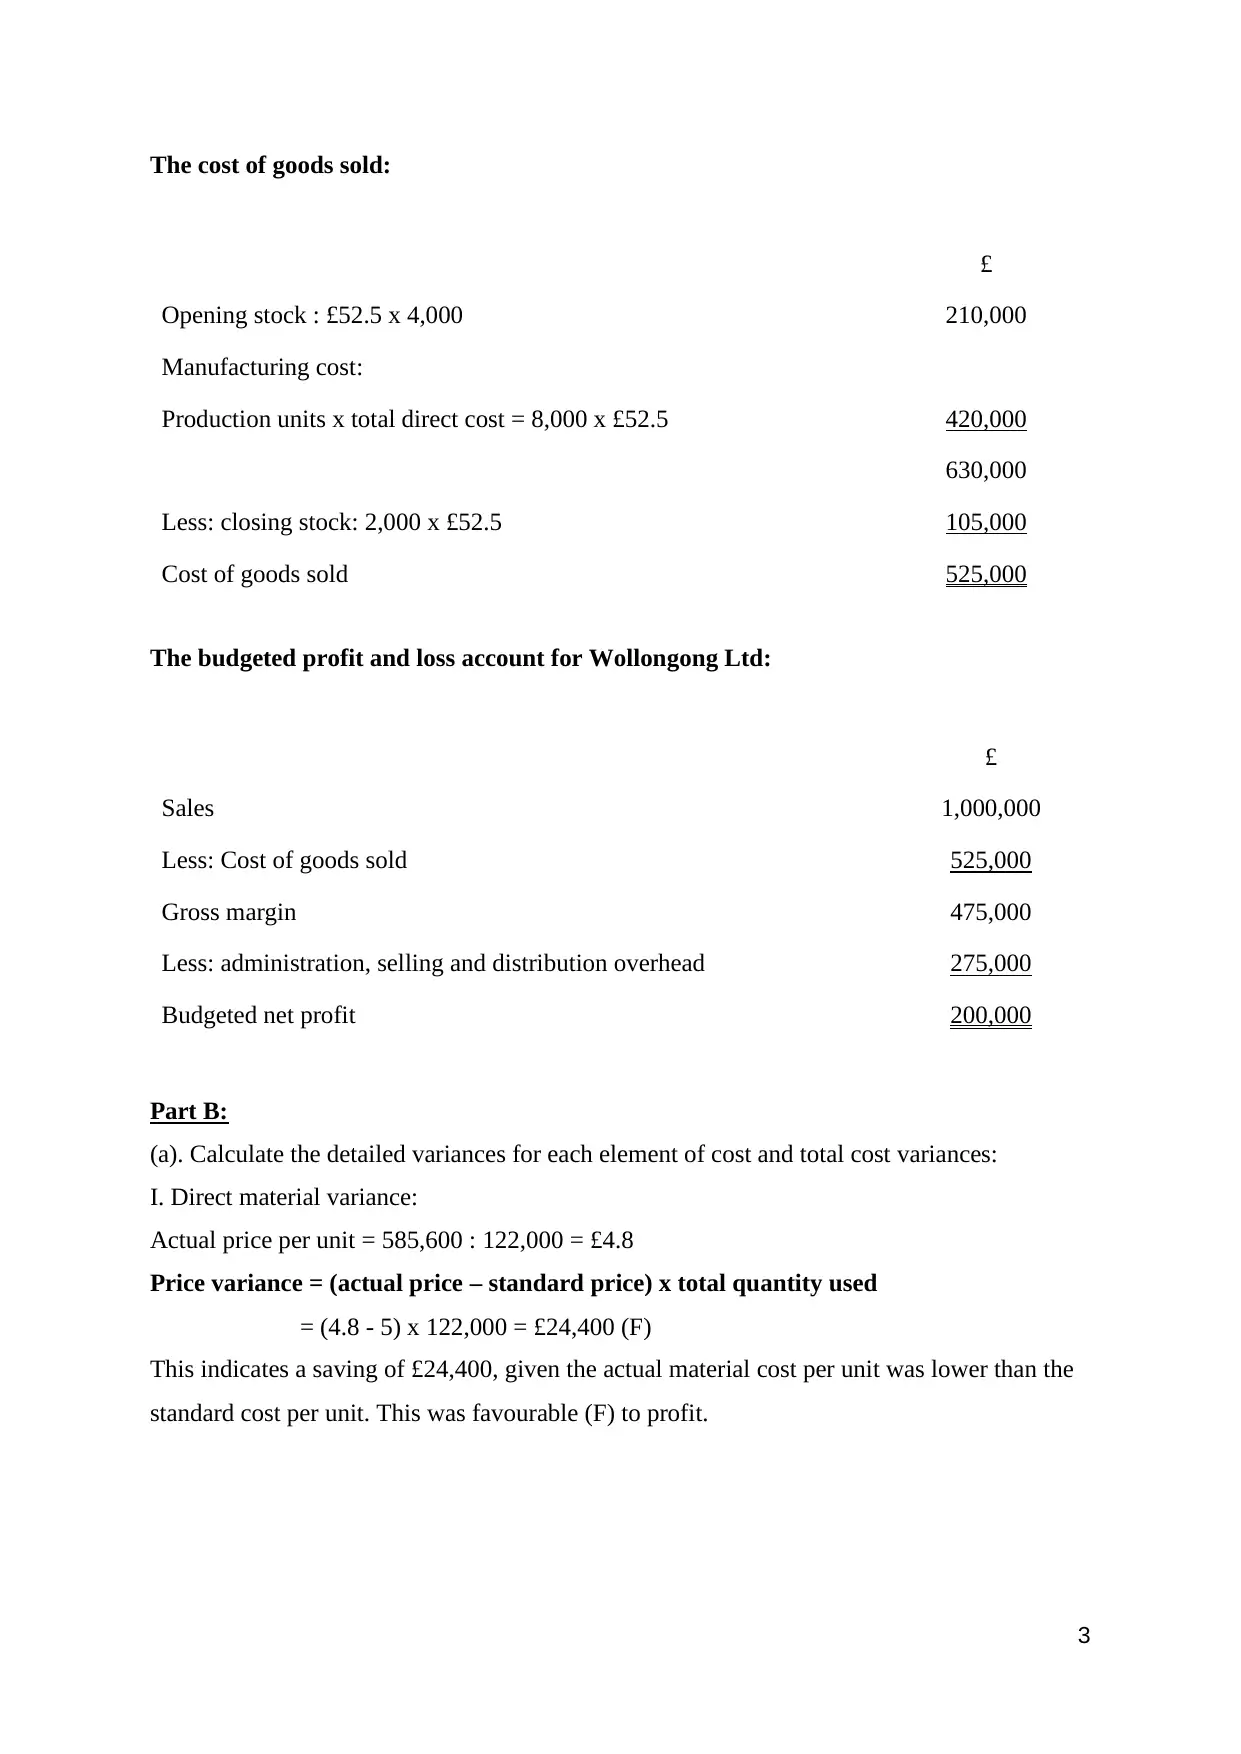
The cost of goods sold:
£
Opening stock : £52.5 x 4,000 210,000
Manufacturing cost:
Production units x total direct cost = 8,000 x £52.5 420,000
630,000
Less: closing stock: 2,000 x £52.5 105,000
Cost of goods sold 525,000
The budgeted profit and loss account for Wollongong Ltd:
£
Sales 1,000,000
Less: Cost of goods sold 525,000
Gross margin 475,000
Less: administration, selling and distribution overhead 275,000
Budgeted net profit 200,000
Part B:
(a). Calculate the detailed variances for each element of cost and total cost variances:
I. Direct material variance:
Actual price per unit = 585,600 : 122,000 = £4.8
Price variance = (actual price – standard price) x total quantity used
= (4.8 - 5) x 122,000 = £24,400 (F)
This indicates a saving of £24,400, given the actual material cost per unit was lower than the
standard cost per unit. This was favourable (F) to profit.
⊘ This is a preview!⊘
Do you want full access?
Subscribe today to unlock all pages.
Trusted by 1+ million students worldwide
4
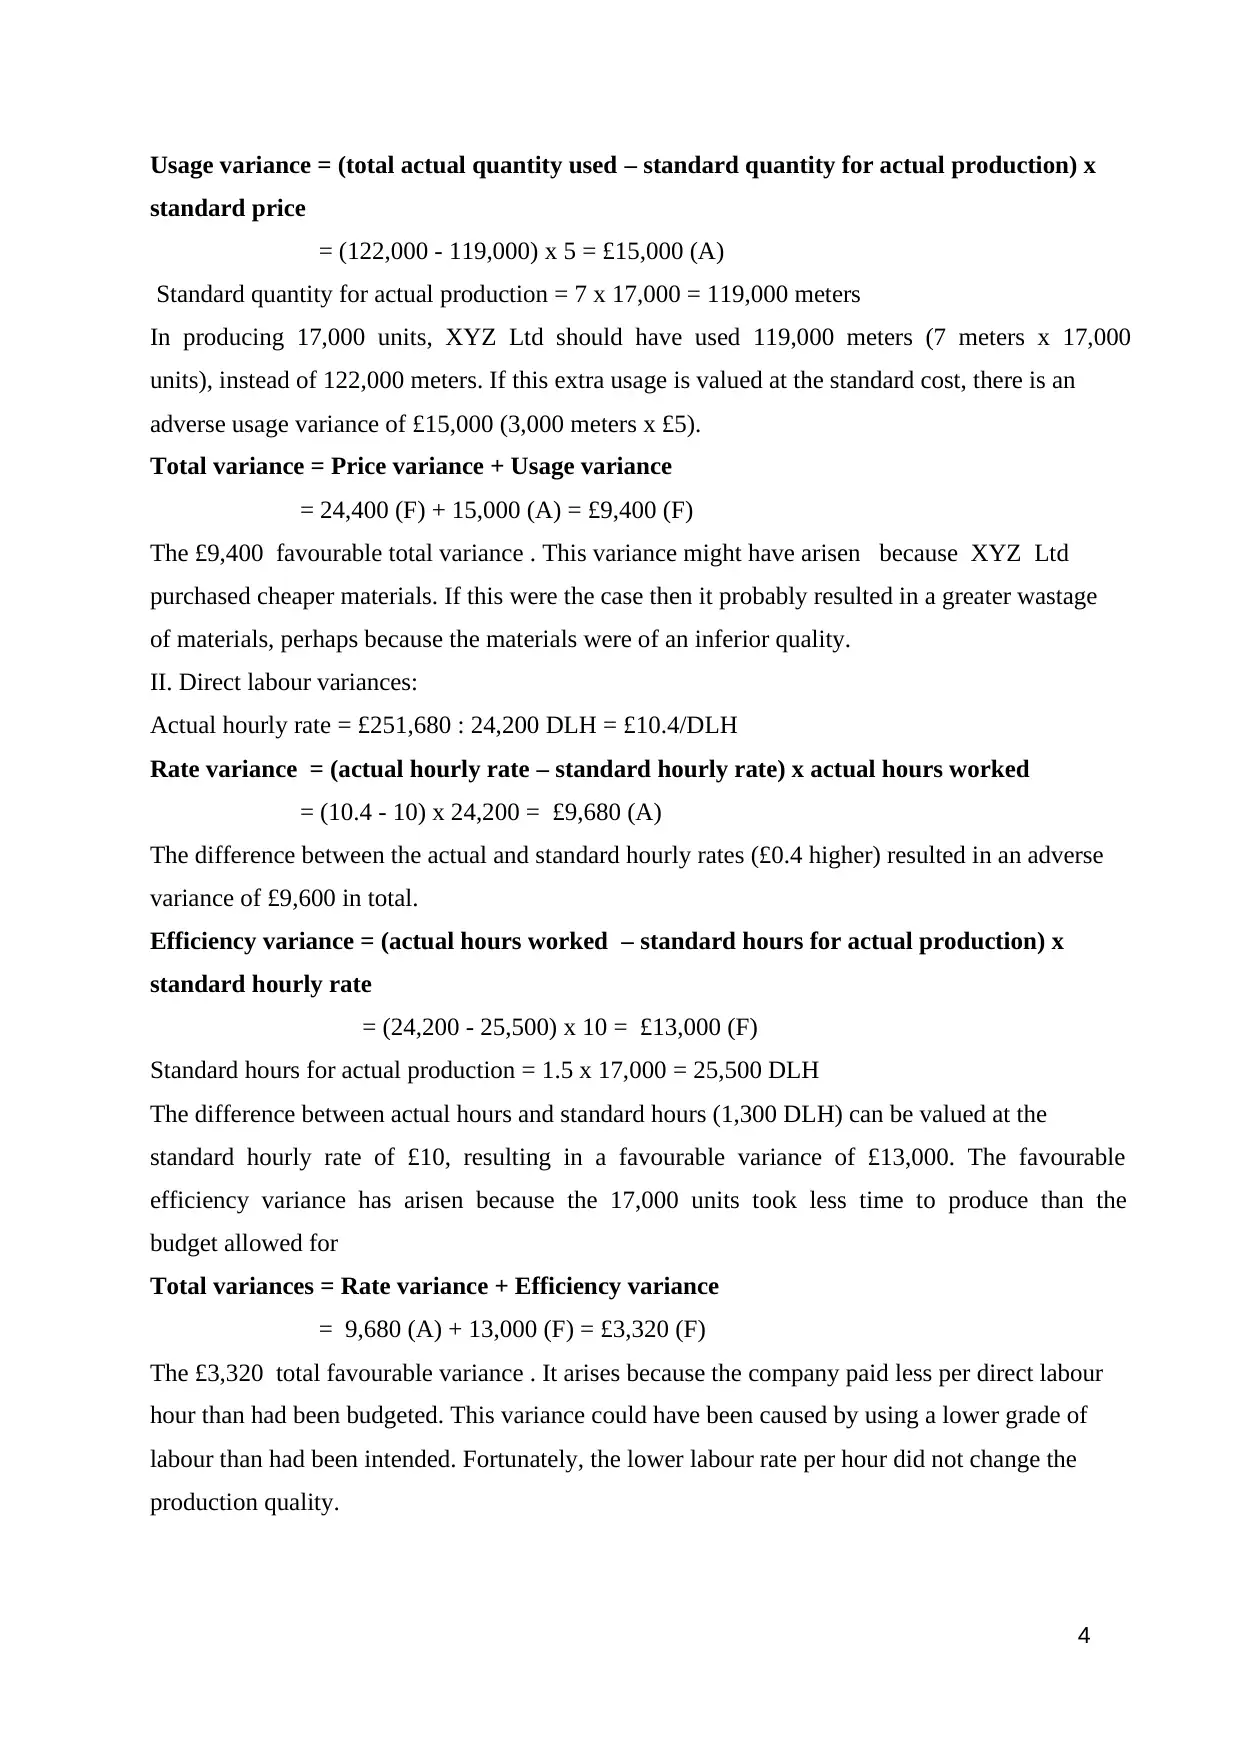
Usage variance = (total actual quantity used – standard quantity for actual production) x
standard price
= (122,000 - 119,000) x 5 = £15,000 (A)
Standard quantity for actual production = 7 x 17,000 = 119,000 meters
In producing 17,000 units, XYZ Ltd should have used 119,000 meters (7 meters x 17,000
units), instead of 122,000 meters. If this extra usage is valued at the standard cost, there is an
adverse usage variance of £15,000 (3,000 meters x £5).
Total variance = Price variance + Usage variance
= 24,400 (F) + 15,000 (A) = £9,400 (F)
The £9,400 favourable total variance . This variance might have arisen because XYZ Ltd
purchased cheaper materials. If this were the case then it probably resulted in a greater wastage
of materials, perhaps because the materials were of an inferior quality.
II. Direct labour variances:
Actual hourly rate = £251,680 : 24,200 DLH = £10.4/DLH
Rate variance = (actual hourly rate – standard hourly rate) x actual hours worked
= (10.4 - 10) x 24,200 = £9,680 (A)
The difference between the actual and standard hourly rates (£0.4 higher) resulted in an adverse
variance of £9,600 in total.
Efficiency variance = (actual hours worked – standard hours for actual production) x
standard hourly rate
= (24,200 - 25,500) x 10 = £13,000 (F)
Standard hours for actual production = 1.5 x 17,000 = 25,500 DLH
The difference between actual hours and standard hours (1,300 DLH) can be valued at the
standard hourly rate of £10, resulting in a favourable variance of £13,000. The favourable
efficiency variance has arisen because the 17,000 units took less time to produce than the
budget allowed for
Total variances = Rate variance + Efficiency variance
= 9,680 (A) + 13,000 (F) = £3,320 (F)
The £3,320 total favourable variance . It arises because the company paid less per direct labour
hour than had been budgeted. This variance could have been caused by using a lower grade of
labour than had been intended. Fortunately, the lower labour rate per hour did not change the
production quality.
Paraphrase This Document
Need a fresh take? Get an instant paraphrase of this document with our AI Paraphraser
5
III. Variable production overhead:
Variable overhead absorption rate = 6 : 1.5 = £4/DLH
Expenditure = actual variable overhead – (actual hours worked x Variable overhead
absorption rate)
= 98,000 - (24,200 x 4) = £1,200 (A)
The actual expenditure was £1,200 more than the budgeted expenditure based on actual
production.
Efficiency = (Actual hours worked - Standard hours for actual production) x Variable
overhead absorption rate
= (24,200 - 25,500) x 4 = £5,200 (F)
The actual efficiency was £5,200 less than the budgeted efficiency based on actual production.
Total = expenditure + efficiency
= £1,200 (A) + £5,200 (F) = £4,000 (F)
The favourable variance caused by lower actual direct labour hours can compensate for the
adverse expenditure variance although the actual Variable overhead is higher than the standard
Variable overhead.
IV. Fixed overhead variances:
Expenditure = Actual fixed overhead – Budgeted fixed expenditure
= 108,000 - 100,000 = £8,000 (A)
Budgeted fixed expenditure = 1,200,000 : 12 = £100,000
This actual expenditure was £8,000 more than the budgeted expenditure.
Total = Expenditure = £8,000 (A)
As the actual activity was more than the budgeted activity, there was £108,000 of fixed
overhead was absorbed into production instead of £100,000 expected in the budget.
V. Total cost variances:
Total cost variances = Total fixed overhead variances + total variable production
overhead + total direct labour variances + total direct material variance
= £8,000 (A) + £4,000 (F) + £3,320 (F) + £9,400 (F) = £8,720(F)
(b) Calculate the sales variances:
Sales volume profit variance = (actual quantity – budgeted quantity) x standard profit
per unit
= (17,000 - 15,000) x 14 = £28,000 (F)
Sales volume profit has a Favourable variance because 17,000 units were sold instead of
15,000 units as budgeted, therefore more profit contribution by £28,000
6
Selling price variance = (actual selling price per unit – standard selling price per unit) x
actual sales quantity
= (67 - 70) x 17,000 = £51,000 (A)
Actual selling price per unit = 1,139,000 : 17,000 = £67
The actual selling price was £3 less than the standard selling price, so the variance is adverse
by £51,000
Total sales variance = Sales volume profit + selling price
= £28,000 (F) + £51,000 (A) = £23,000 (A)
The adverse variance caused by higher units sold but the actual selling price was lower
budgeted selling price.
⊘ This is a preview!⊘
Do you want full access?
Subscribe today to unlock all pages.
Trusted by 1+ million students worldwide
1
Part B:
(c) Standard cost operating statement:
XYZ Ltd. Standard cost operating statement for the year to 31 january:
£
Budgeted sale: (15,000 x £70 per unit) 1,050,000
Less: Budgeted COGS: (15,000 x £56 per unit) 840,000
Budgeted contribution 210,000
Less: Budgeted fixed 100,000
Budgeted net profit 110,000
Sale volume profit variance 28,000
Budgeted profit from actual sales 138,000
Variance (F) (A)
£ £
Sale price 51,000
Direct material price 24,400
Direct material usage 15,000
Direct labour rate 9,680
Direct labour efficiency 13,000
Variable overhead expenditure 1,200
Variable overhead efficiency 5,200
Fixed overhead expenditure ______ 8,000
Actual contribution margin 42,600 84,280 42,280
Actual profit 95,720
Paraphrase This Document
Need a fresh take? Get an instant paraphrase of this document with our AI Paraphraser
8
Part C:
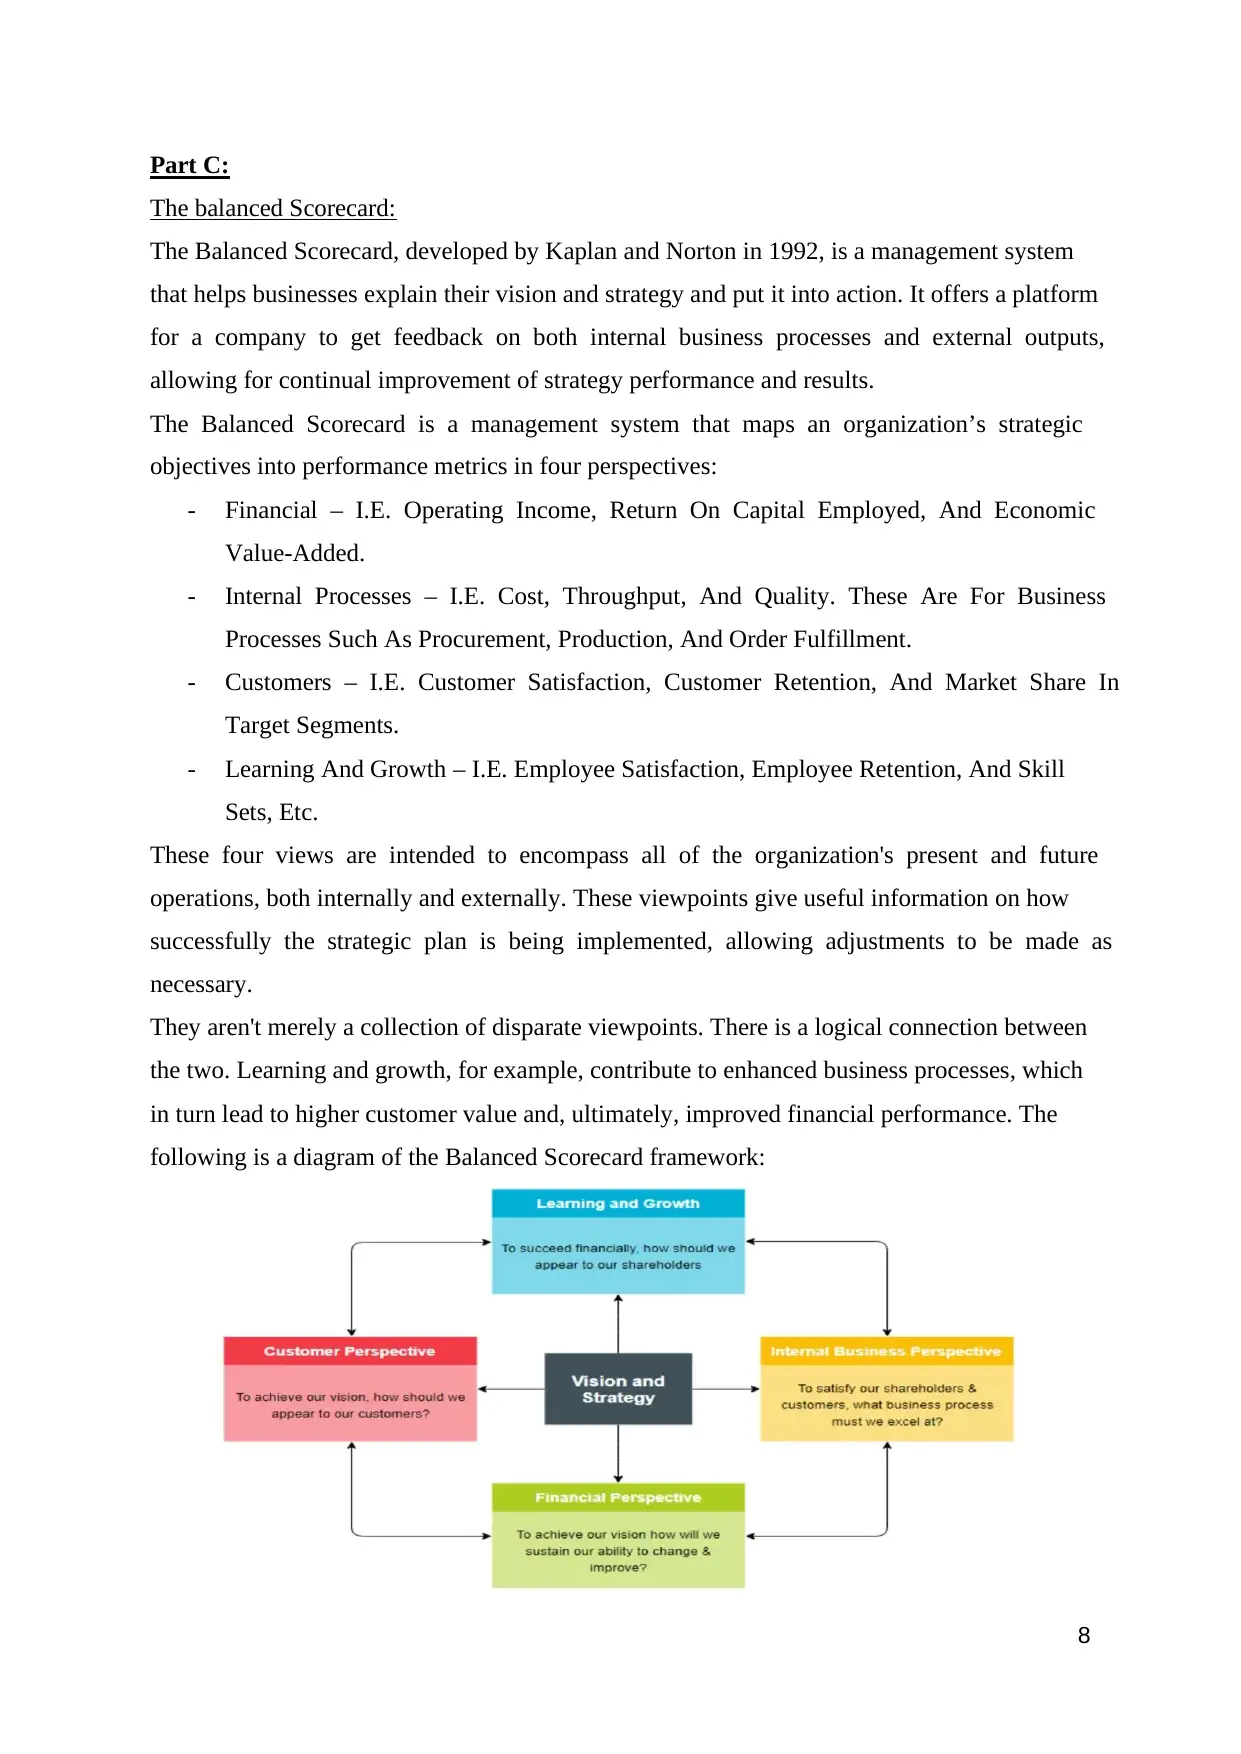
The balanced Scorecard:
The Balanced Scorecard, developed by Kaplan and Norton in 1992, is a management system
that helps businesses explain their vision and strategy and put it into action. It offers a platform
for a company to get feedback on both internal business processes and external outputs,
allowing for continual improvement of strategy performance and results.
The Balanced Scorecard is a management system that maps an organization’s strategic
objectives into performance metrics in four perspectives:
- Financial – I.E. Operating Income, Return On Capital Employed, And Economic
Value-Added.
- Internal Processes – I.E. Cost, Throughput, And Quality. These Are For Business
Processes Such As Procurement, Production, And Order Fulfillment.
- Customers – I.E. Customer Satisfaction, Customer Retention, And Market Share In
Target Segments.
- Learning And Growth – I.E. Employee Satisfaction, Employee Retention, And Skill
Sets, Etc.
These four views are intended to encompass all of the organization's present and future
operations, both internally and externally. These viewpoints give useful information on how
successfully the strategic plan is being implemented, allowing adjustments to be made as
necessary.
They aren't merely a collection of disparate viewpoints. There is a logical connection between
the two. Learning and growth, for example, contribute to enhanced business processes, which
in turn lead to higher customer value and, ultimately, improved financial performance. The
following is a diagram of the Balanced Scorecard framework:
Part C:
The balanced Scorecard:
The Balanced Scorecard, developed by Kaplan and Norton in 1992, is a management system
that helps businesses explain their vision and strategy and put it into action. It offers a platform
for a company to get feedback on both internal business processes and external outputs,
allowing for continual improvement of strategy performance and results.
The Balanced Scorecard is a management system that maps an organization’s strategic
objectives into performance metrics in four perspectives:
- Financial – I.E. Operating Income, Return On Capital Employed, And Economic
Value-Added.
- Internal Processes – I.E. Cost, Throughput, And Quality. These Are For Business
Processes Such As Procurement, Production, And Order Fulfillment.
- Customers – I.E. Customer Satisfaction, Customer Retention, And Market Share In
Target Segments.
- Learning And Growth – I.E. Employee Satisfaction, Employee Retention, And Skill
Sets, Etc.
These four views are intended to encompass all of the organization's present and future
operations, both internally and externally. These viewpoints give useful information on how
successfully the strategic plan is being implemented, allowing adjustments to be made as
necessary.
They aren't merely a collection of disparate viewpoints. There is a logical connection between
the two. Learning and growth, for example, contribute to enhanced business processes, which
in turn lead to higher customer value and, ultimately, improved financial performance. The
following is a diagram of the Balanced Scorecard framework:
9
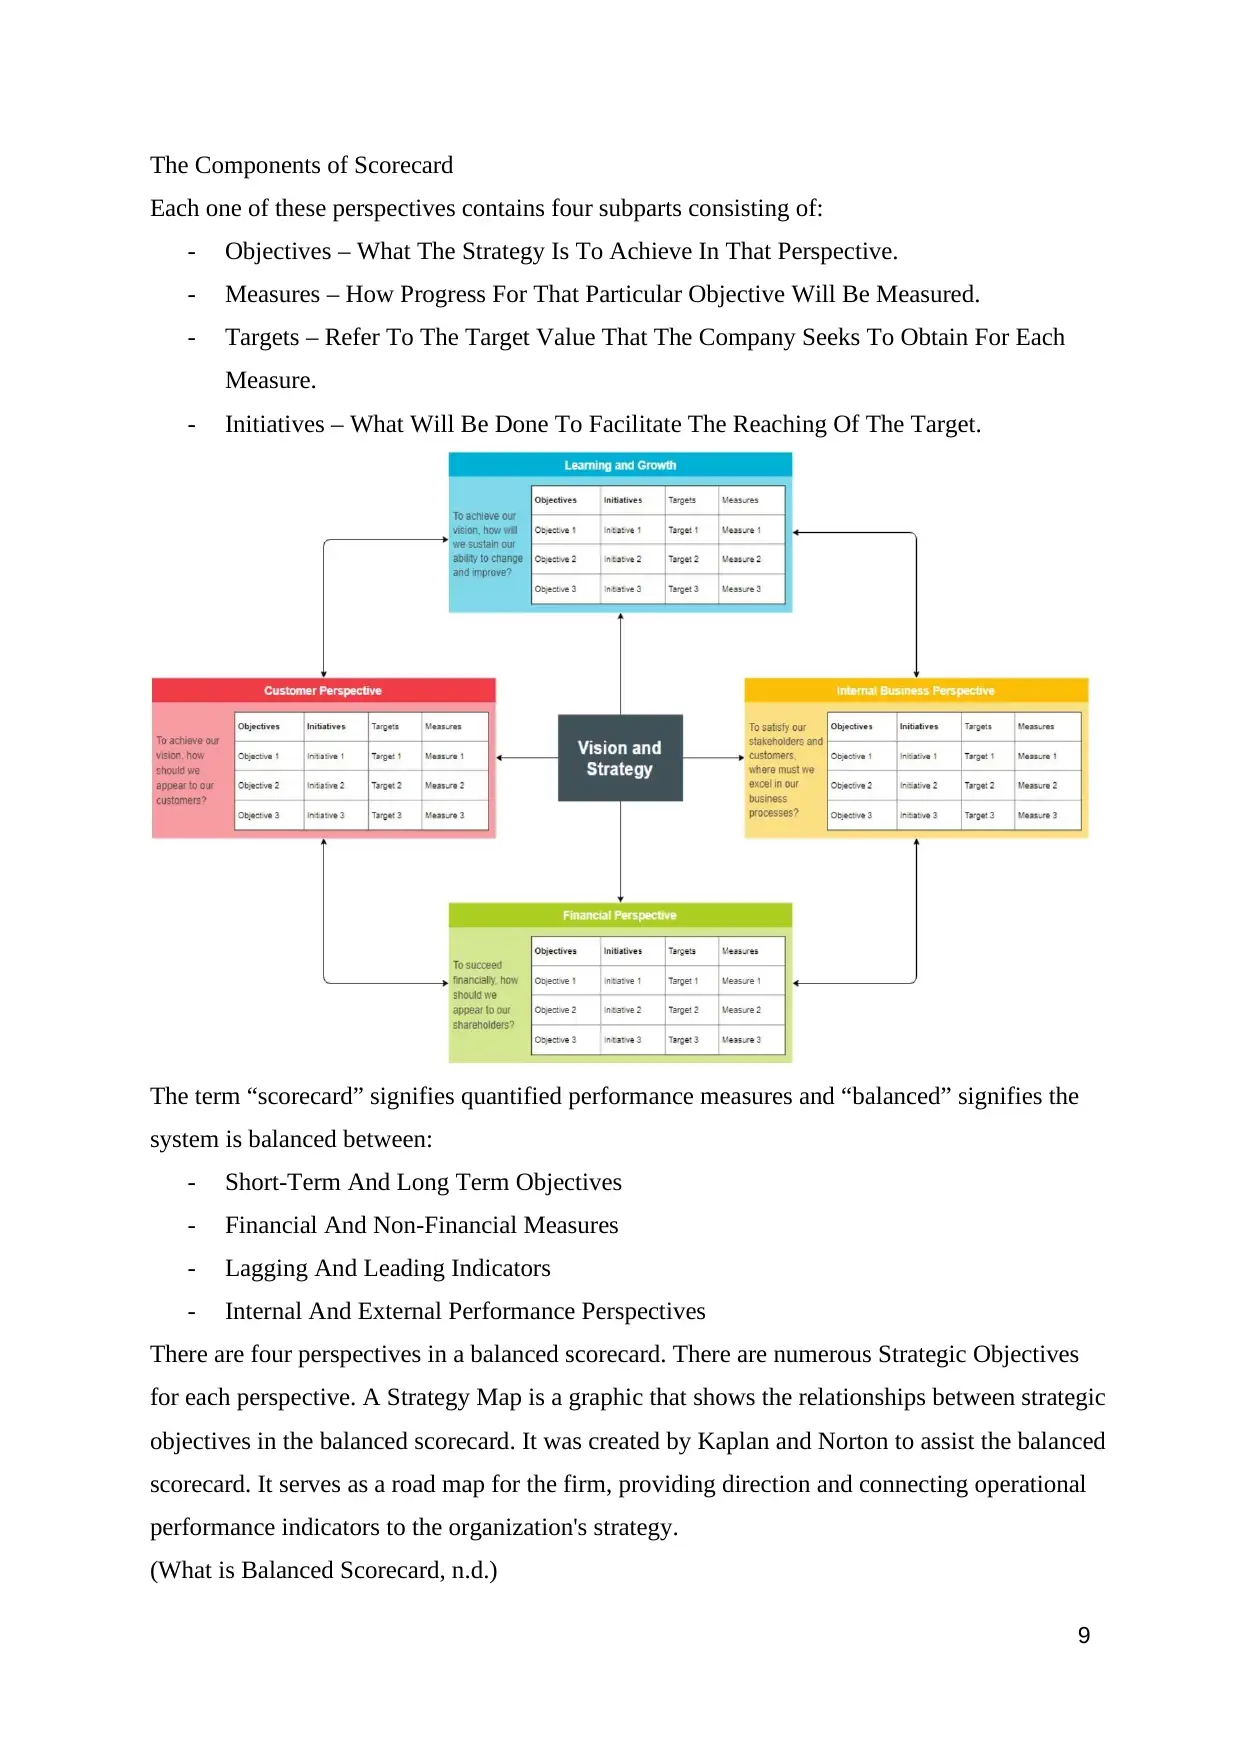
The Components of Scorecard
Each one of these perspectives contains four subparts consisting of:
- Objectives – What The Strategy Is To Achieve In That Perspective.
- Measures – How Progress For That Particular Objective Will Be Measured.
- Targets – Refer To The Target Value That The Company Seeks To Obtain For Each
Measure.
- Initiatives – What Will Be Done To Facilitate The Reaching Of The Target.
The term “scorecard” signifies quantified performance measures and “balanced” signifies the
system is balanced between:
- Short-Term And Long Term Objectives
- Financial And Non-Financial Measures
- Lagging And Leading Indicators
- Internal And External Performance Perspectives
There are four perspectives in a balanced scorecard. There are numerous Strategic Objectives
for each perspective. A Strategy Map is a graphic that shows the relationships between strategic
objectives in the balanced scorecard. It was created by Kaplan and Norton to assist the balanced
scorecard. It serves as a road map for the firm, providing direction and connecting operational
performance indicators to the organization's strategy.
(What is Balanced Scorecard, n.d.)
⊘ This is a preview!⊘
Do you want full access?
Subscribe today to unlock all pages.
Trusted by 1+ million students worldwide
2
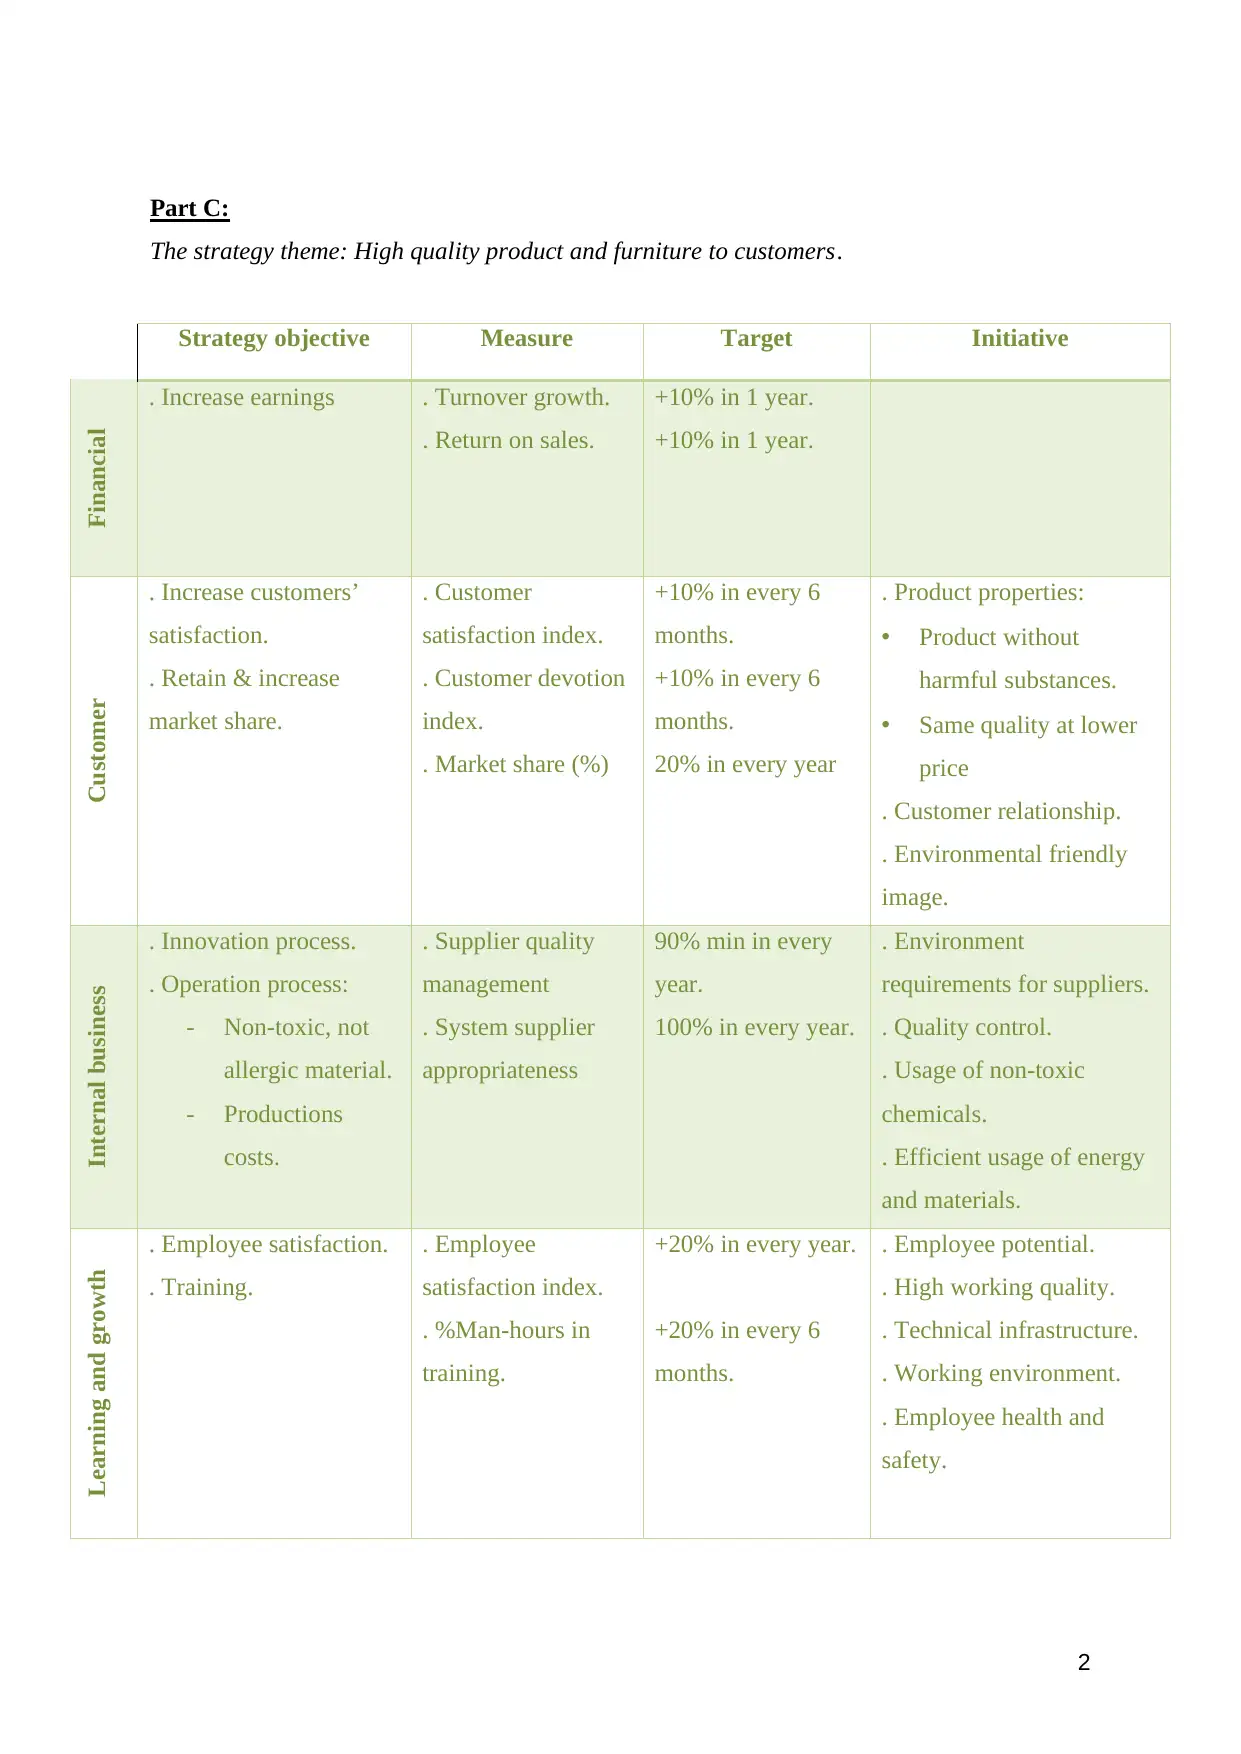
Part C:
The strategy theme: High quality product and furniture to customers.
Strategy objective Measure Target Initiative
Financial . Increase earnings . Turnover growth.
. Return on sales.
+10% in 1 year.
+10% in 1 year.
Customer
. Increase customers’
satisfaction.
. Retain & increase
market share.
. Customer
satisfaction index.
. Customer devotion
index.
. Market share (%)
+10% in every 6
months.
+10% in every 6
months.
20% in every year
. Product properties:
• Product without
harmful substances.
• Same quality at lower
price
. Customer relationship.
. Environmental friendly
image.
Internal business
. Innovation process.
. Operation process:
- Non-toxic, not
allergic material.
- Productions
costs.
. Supplier quality
management
. System supplier
appropriateness
90% min in every
year.
100% in every year.
. Environment
requirements for suppliers.
. Quality control.
. Usage of non-toxic
chemicals.
. Efficient usage of energy
and materials.
Learning and growth . Employee satisfaction.
. Training.
. Employee
satisfaction index.
. %Man-hours in
training.
+20% in every year.
+20% in every 6
months.
. Employee potential.
. High working quality.
. Technical infrastructure.
. Working environment.
. Employee health and
safety.
Paraphrase This Document
Need a fresh take? Get an instant paraphrase of this document with our AI Paraphraser
3
The strategy map of balanced scorecard is about High quality products and furniture to
customer of CMI company:
Beginning with the financial perspective of the strategy map, there is just one main objective:
"Increase Earnings." With two measurements are turnover growth and return on sales. There
are four different types of company's strategies: clean, efficient, innovative and progressive. A
company which follows the strategy on environmental and social objectives and measures to
reduce their costs. It will strive for identifying and exploiting “win-win-situations” and will
thus aim for the measures that help assess whether environmental and social standards are met
in the most cost efficient way. Its main objective is to minimize the cost-related ecological
damage per product or service unit, typically realized by savings of materials, energy, water
and waste. Measures would look at cost savings from pollution prevention rather than
monitoring end-of-pipe solutions. So that the target of two measurements is rise up to 10% in
the beginning year applying and can increase higher after years.
Concerning the consumer, two goals are stated: “Increase Customer Satisfaction” and “Retain
& Increase Market Share.” The metric "Customer Satisfaction Index" is offered for "Customer
Satisfaction," while two measures, "Customer Devotion Index" and "Percentage of Market
Share," are determined for "Retain & Increase Market Share." The third measure in this specific
theme and perspective (Percentage of Market Share), concerns the change of share (%), which
in turn comes from the qualitative characteristics contribution of company’s products. From
the customer’s perspective it is vital to tender products with lower price but of the same quality.
It is crucial for the company to be able to compete with the other producers on the market. The
price of a product is related to production costs as well as environmental friendly the products
are. It depends on the efficient use of energy and materials. So the eco-efficiency strategy is
very appropriate for the require about health aspect in nowadays of consumers with expect
products not to contain toxic and allergenic materials and not to cause allergies. The percentage
of “Customer Satisfaction Index”, "Customer Devotion Index" and "Percentage of Market
Share" measure, must be monitored and measured every six months from the started day of
eco-efficiency strategy and in every year for market share, and the target for this objective
suggests that increase 10% for Customer Satisfaction Index as well as Customer Devotion
Index and 20% for market shares.
4
For internal business has two objectives: Innovation process and Operation process (Non-toxic,
not allergic material, productions costs). The two measures for these objectives are supplier
quality and system supplier appropriateness. The company’s suppliers must have been
approved by any accredited quality assurance organization. Purchased parts that do not
conform to specifications can impact every aspect of the company’s business. Both the buyer’s
approach and specification management are keys to controlling supplier quality. Competitive
cost, service, delivery time and product quality are fundamental criteria of the supplier
evaluation The initiative for internal business: environment requirements for suppliers quality
control, usage of non-toxic chemicals, efficient usage of energy and materials are very
important so that supplier quality management need to reach the target at least 90% min in
every year and the system supplier appropriateness has the target with 100% each year.
The two Internal Business objectives are associated with the respective objectives of learning
and growth perspective, “Training” and “Improve Employee Satisfaction”. The measure for
the first one (Training) is “Percentage of Man-hours in Training” with the target is increase
20% in each 6 months. Employees’ training is central to company’s strategy. Because the
company's goal is to produce eco-friendly products, the employees need to be trained in the
basics of the production process. Training will start from the managers and supervisors
afterwards will gradually increase the percentage of employees trained to 20% every six
months. “Employee Satisfaction Index” is the measure for the second objective (Improve
Employee Satisfaction) has the target is rise 20% in every year. The company's current goal is
to produce and supply healthy as well as environmentally friendly products. There will be many
changes in work that make employees feel pressure to learn new knowledge, so it is very
important for the company to pay attention to employee satisfaction during this time. So that
the initiative for this perspective is employee potential, high working quality, technical
infrastructure, working environment and employee health and safety for the target of rising up
employees satisfaction to 20% in each year.
⊘ This is a preview!⊘
Do you want full access?
Subscribe today to unlock all pages.
Trusted by 1+ million students worldwide
1 out of 12
Related Documents


Your All-in-One AI-Powered Toolkit for Academic Success.
+13062052269
info@desklib.com
Available 24*7 on WhatsApp / Email
![[object Object]](/_next/static/media/star-bottom.7253800d.svg)
Unlock your academic potential
Copyright © 2020–2026 A2Z Services. All Rights Reserved. Developed and managed by ZUCOL.