Business Decision Making Report for Balti Palace Restaurant
VerifiedAdded on 2020/01/15
|26
|5497
|471
Report
AI Summary
This report provides a comprehensive analysis of the business decision-making process for Balti Palace, an Indian restaurant in the UK, focusing on its potential expansion to London. It begins with an introduction to decision-making and its impact on financial structures. The report details the collection of primary and secondary data, including survey methodology, questionnaire design, and sampling frames to understand customer preferences. Data analysis techniques, such as central tendency and measures of dispersion, are employed to evaluate sales and profit margins. The report incorporates graphical representations like column and bar graphs, trend lines, and critical path analysis to aid in informed decision-making. Investment appraisal techniques and network diagrams are utilized to conclude the report, offering insights into the restaurant's financial performance and strategic planning for its expansion.
Business Decision Making
Paraphrase This Document
Need a fresh take? Get an instant paraphrase of this document with our AI Paraphraser
TABLE OF CONTENTS
Introduction......................................................................................................................................3
Task 1...............................................................................................................................................3
1.1. Primary and Secondary sources of data collection...............................................................3
1.2. Survey methodology and Sampling frame............................................................................4
1.3. Questionnaire........................................................................................................................4
2.1. Collected and Summarized data............................................................................................6
2.2. Central tendency...................................................................................................................8
2.3/2.4. Measures of Dispersion:.................................................................................................9
Task 2.............................................................................................................................................11
3.1. Graph presentation..............................................................................................................11
3.2. Trend lines:.........................................................................................................................14
3.3. Power point presentation:...................................................................................................15
3.4. Business report:...................................................................................................................15
Task 3.............................................................................................................................................17
4.1. Information processing tools:.............................................................................................17
4.2. Critical path:........................................................................................................................18
4.3. Use of financial tools for decision-making.........................................................................20
Conclusion.....................................................................................................................................21
References......................................................................................................................................22
2
Index of Tables
Table 1: Questionnaire.....................................................................................................................6
Table 2: Sales and Profit margin....................................................................................................10
Table 3: Central tendency..............................................................................................................11
Table 4: Sale and Profit margin.....................................................................................................11
Table 5: Standard deviation...........................................................................................................11
Table 6: Correlation coefficient.....................................................................................................12
Table 7: Quartile............................................................................................................................12
Table 8: Percentile.........................................................................................................................13
Table 9: Sales and Profit margin....................................................................................................13
Table 10: Forecasting table............................................................................................................16
Table 11: Business report...............................................................................................................17
Table 12: Process and its time of completion................................................................................20
Table 13: NPV and IRR.................................................................................................................22
3
⊘ This is a preview!⊘
Do you want full access?
Subscribe today to unlock all pages.
Trusted by 1+ million students worldwide
Illustration Index
Illustration 1: Column graph..........................................................................................................13
Illustration 2: Bar graph.................................................................................................................14
Illustration 3: line graph.................................................................................................................15
Illustration 4: Cone graph..............................................................................................................15
Illustration 5: Trend line................................................................................................................17
Illustration 6: Network diagram.....................................................................................................21
Illustration 7: Critical path.............................................................................................................21
4
Paraphrase This Document
Need a fresh take? Get an instant paraphrase of this document with our AI Paraphraser
INTRODUCTION
Decision making plays a vital role in success of any business organisation. It involves the
process in which decision-makers come out with best possible alternatives. Financial structure of
any firm is also affected by the business decision-making processes (Zsambok and Klein, 2014).
The present report is based on decision-making process of Balti Palace of the UK. It is an Indian
restaurant basically situated in Wombwell (Small town of England). Balti Palace's management
is planning to open second chain restaurant in London.
Furthermore, the report contains the ways for collection and analysis of data for the
opening of second restaurant. Primary and secondary sources of data collection are highlighted in
the present report. Techniques like measures of dispersion and central tendency are discussed
further for effective analysis of data. In addition, information in graphs and figures formats is
used to help management to make proper decisions. Investment appraisal techniques and
network diagrams are used for concluding the final report.
TASK 1
1.1. Creation of a plan for collection of Primary and Secondary data
Data collection is the process which involves collection data by using two different types
of primary and secondary sources (What is primary data and secondary data in Statistics and
research methods?, 2016). Data collected is used in decision-making process. The plan for data
collection will comprise of the following two steps:
Plan for Collection of Primary data: This source of data collection is the first hand data. Here,
data is collected by investigators themselves from the field. It basically means the original data
which is collected with a particular purpose of study. Data collected can be through
questionnaires, survey methodology, sampling, personal interviews and telephonic interviews
(Liberman‐Yaconi, Hooper and Hutchings, 2010). Balti Palace can use these ways to bring out
the data and information from their customers and can make decisions accordingly. The primary
data collection will help the restaurant to create a base for the second opening restaurant opening.
Plan for Collection of Secondary data: Data collected through secondary sources are the second
hand data. It is the information which is already collected by some other person and also for
some other use (Black 2011). Balti Palace can use the data for its own purpose. This type of data
5
collection is less costly and even consumes less time and efforts. Balti Palace can generate this
data firstly from its internal sources and then from its external sources. Internal sources include
the sales records, marketing activities, cost information and distributor reports (Kline, 2010).
External sources of information for Balti Palace can be books, journals, magazines, newspapers
and internet. These secondary data collection will help Balti Palace in clarifying its need of
research.
1.2. Presentation of Survey methodology and Sampling frame
Survey Methodology is an efficient way for the collection of quantitative data. It is a type
of primary sources of data collection. Questionnaires, personal interviews, telephonic interviews,
and Mail survey are the types of survey methodology (Zolfani and et.al., 2013.). Balti Palace can
use these survey method for gathering data for the successful decision making of its new
opening. In this report, questionnaire is the method which is used for surveying and collecting
data from the local residents of London. Through this Balti Palace can get the information about
the taste and preferences of customers and according to the same can decided the prices and
variety of food. Questionnaire will also help the restaurant to decide the location for new start-up
plan.
Sampling frame is also a type of the primary source of data collection where a sample
size is decided for data collection (Barry and Edgman-Levitan, 2012). This method also gather
quantitative information for the research. The sample size the part of population which acts on
the behalf of total population. Sampling frame consist of random sampling, judgement sampling
and quota sampling. In this study of Balti Palace, random sampling is the method which is used
for the data collection. Here sample size of 100 customers can used for information collection.
Under random sampling of 100 customer every one have the neutral chance of being picked up.
Information gathered through random sampling for Balti Palace is diversified.
1.3. Designing a Questionnaire
Questionnaire is the part of survey methodology form which Balti Palace can collect their
relevant information regarding customer satisfaction (Elango and et.al., 2010). Information taken
out is from sample size 100 consumers.
6
⊘ This is a preview!⊘
Do you want full access?
Subscribe today to unlock all pages.
Trusted by 1+ million students worldwide
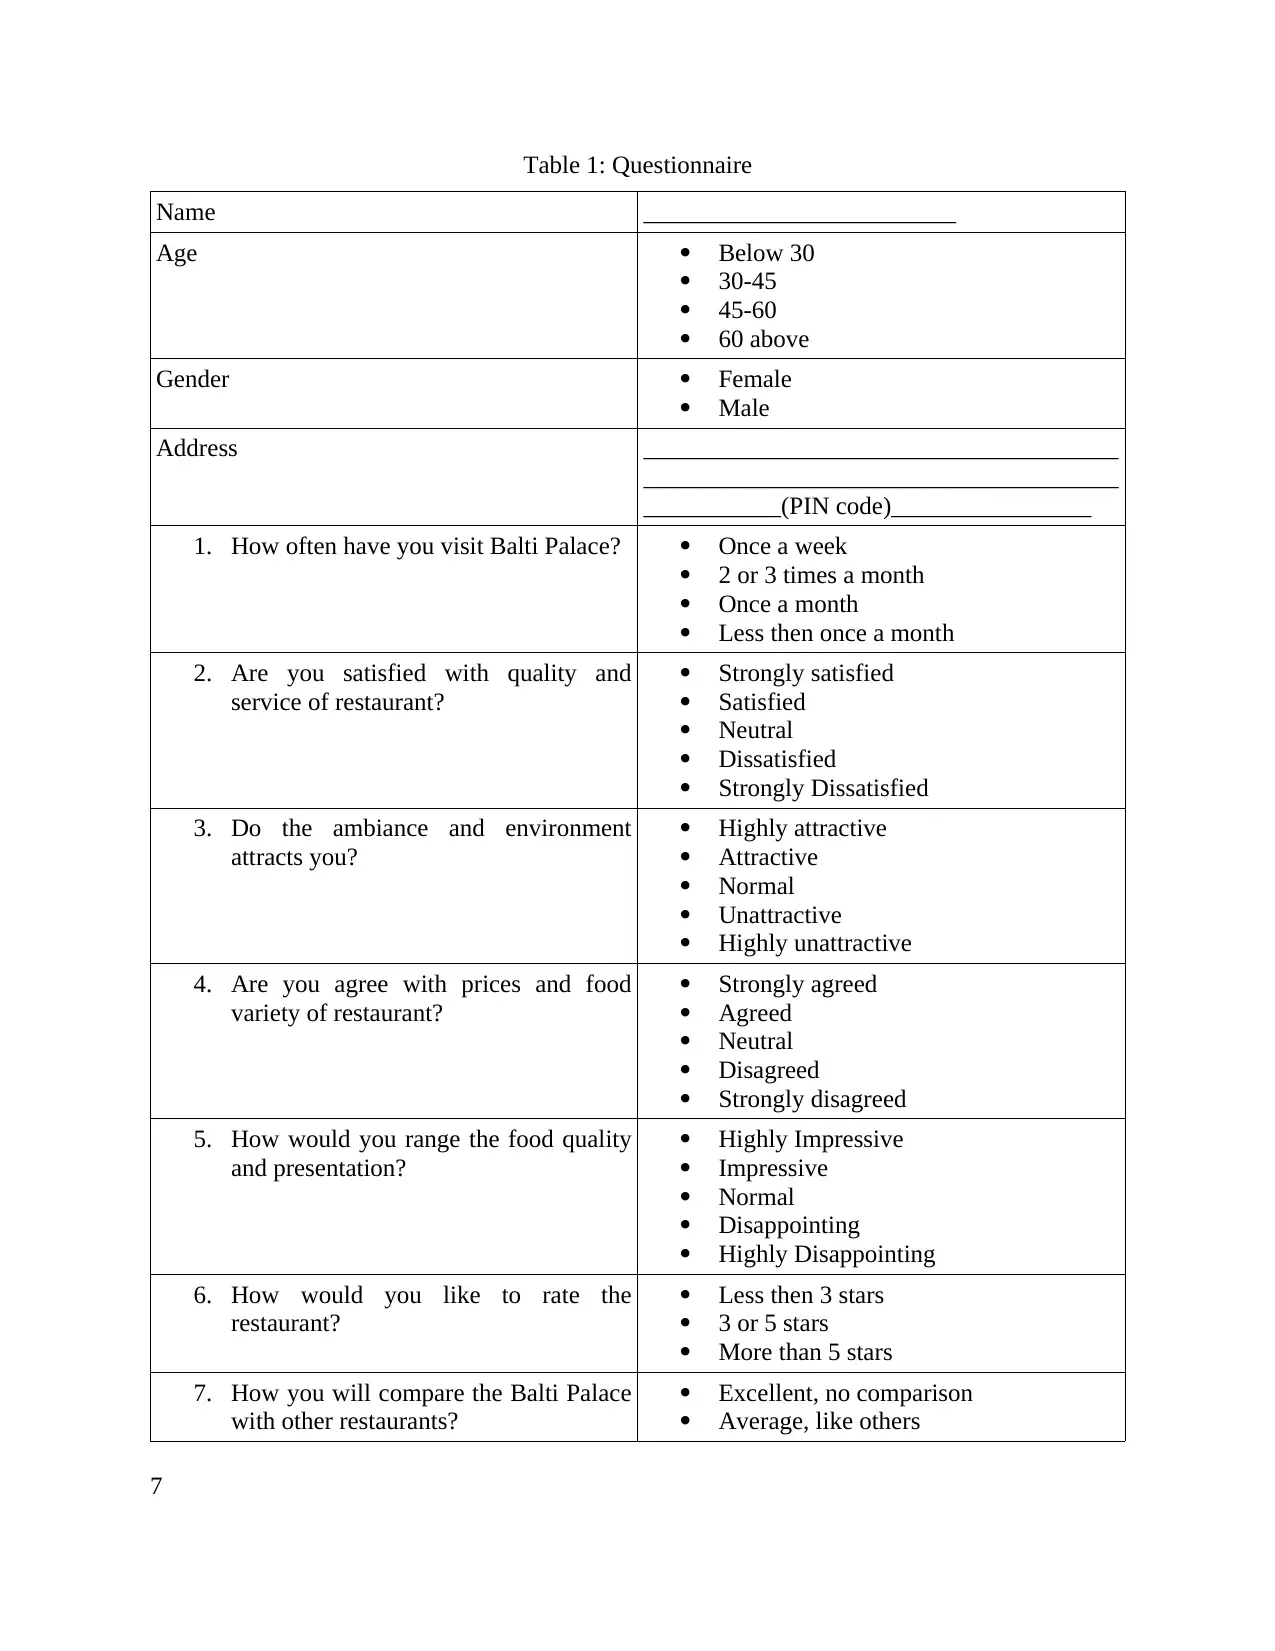
Table 1: Questionnaire
Name _________________________
Age Below 30
30-45
45-60
60 above
Gender Female
Male
Address ______________________________________
______________________________________
___________(PIN code)________________
1. How often have you visit Balti Palace? Once a week
2 or 3 times a month
Once a month
Less then once a month
2. Are you satisfied with quality and
service of restaurant?
Strongly satisfied
Satisfied
Neutral
Dissatisfied
Strongly Dissatisfied
3. Do the ambiance and environment
attracts you?
Highly attractive
Attractive
Normal
Unattractive
Highly unattractive
4. Are you agree with prices and food
variety of restaurant?
Strongly agreed
Agreed
Neutral
Disagreed
Strongly disagreed
5. How would you range the food quality
and presentation?
Highly Impressive
Impressive
Normal
Disappointing
Highly Disappointing
6. How would you like to rate the
restaurant?
Less then 3 stars
3 or 5 stars
More than 5 stars
7. How you will compare the Balti Palace
with other restaurants?
Excellent, no comparison
Average, like others
7
Paraphrase This Document
Need a fresh take? Get an instant paraphrase of this document with our AI Paraphraser
Worst, can not compare
8. What location you would love to see
the opening of chain restaurant in
London?
Lake side view
Locality, middle of the city
Easy approach
Near airport
Other (If, where?)
______________________
9. Suggestions for improvement _________________________
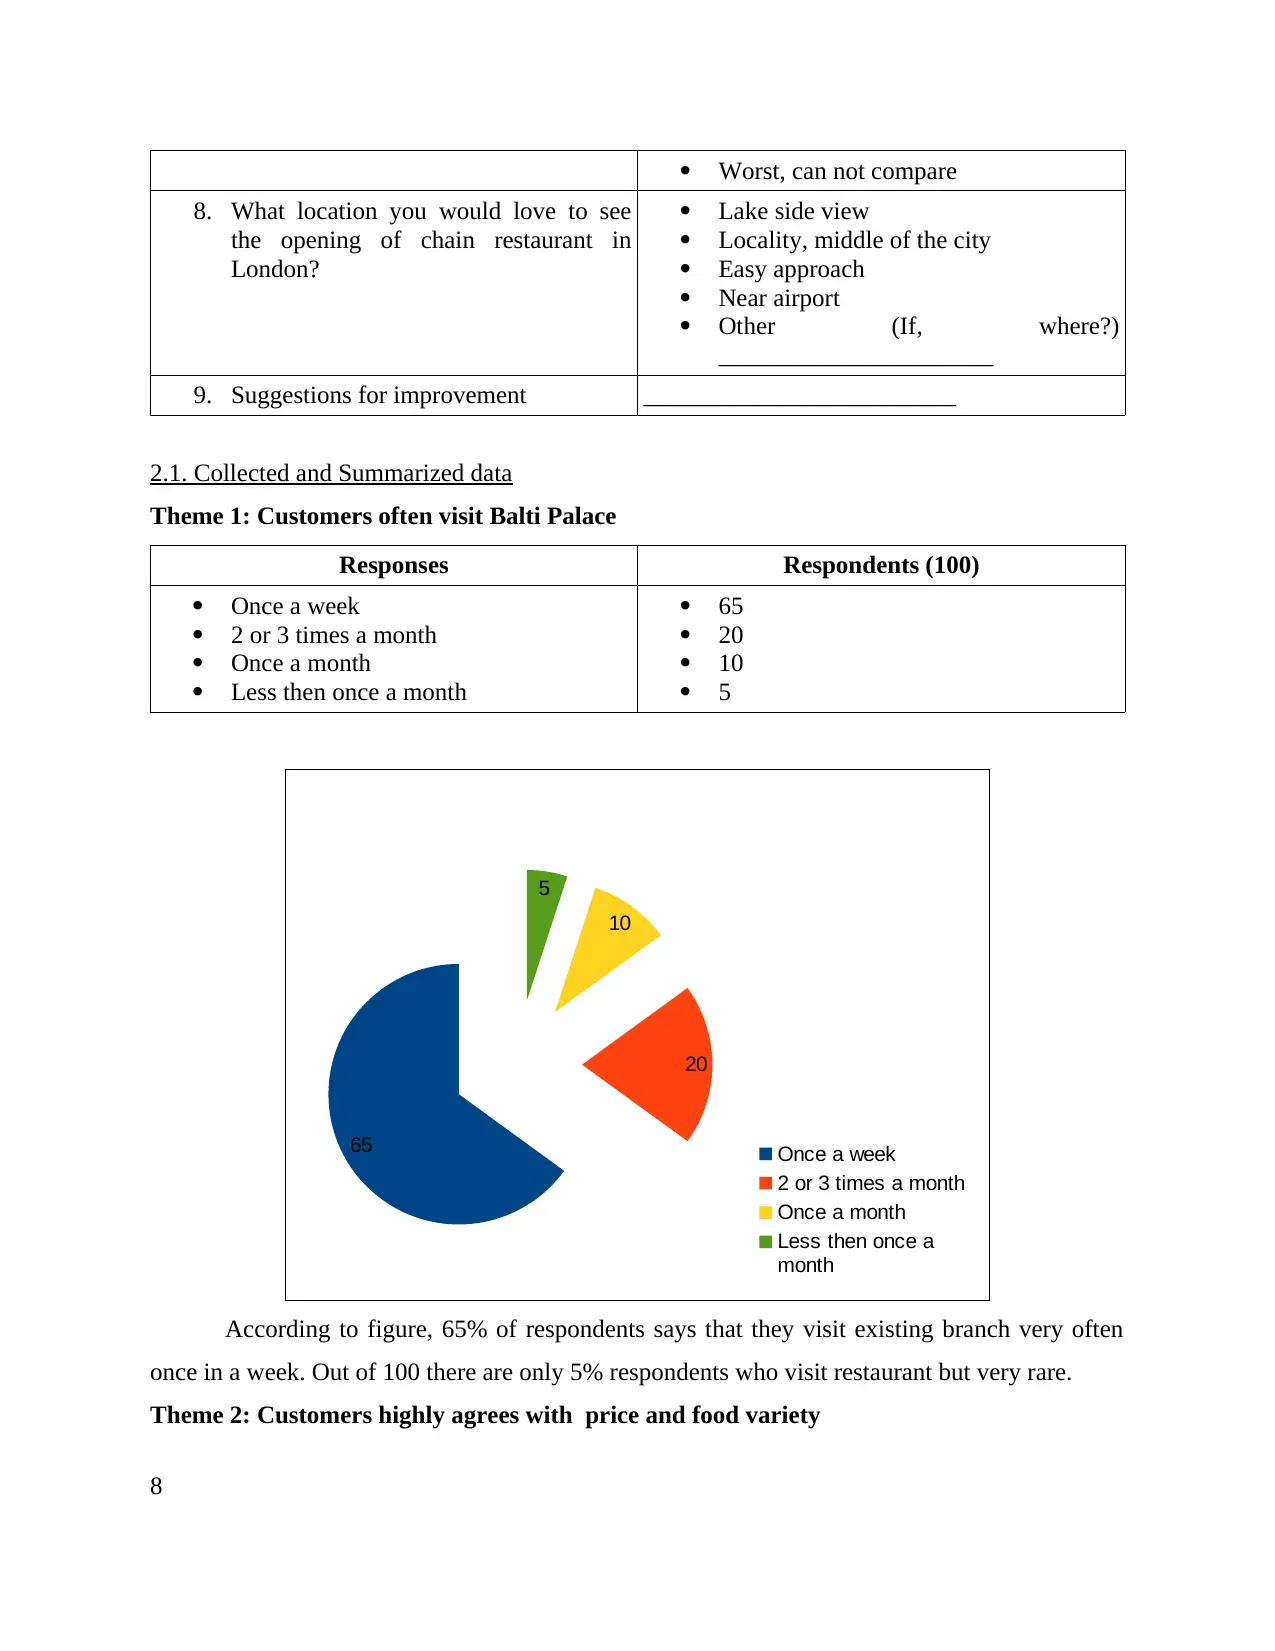
2.1. Collected and Summarized data
Theme 1: Customers often visit Balti Palace
Responses Respondents (100)
Once a week
2 or 3 times a month
Once a month
Less then once a month
65
20
10
5
According to figure, 65% of respondents says that they visit existing branch very often
once in a week. Out of 100 there are only 5% respondents who visit restaurant but very rare.
Theme 2: Customers highly agrees with price and food variety
8
65
20
10
5
Once a week
2 or 3 times a month
Once a month
Less then once a
month
8. What location you would love to see
the opening of chain restaurant in
London?
Lake side view
Locality, middle of the city
Easy approach
Near airport
Other (If, where?)
______________________
9. Suggestions for improvement _________________________
2.1. Collected and Summarized data
Theme 1: Customers often visit Balti Palace
Responses Respondents (100)
Once a week
2 or 3 times a month
Once a month
Less then once a month
65
20
10
5
According to figure, 65% of respondents says that they visit existing branch very often
once in a week. Out of 100 there are only 5% respondents who visit restaurant but very rare.
Theme 2: Customers highly agrees with price and food variety
8
65
20
10
5
Once a week
2 or 3 times a month
Once a month
Less then once a
month
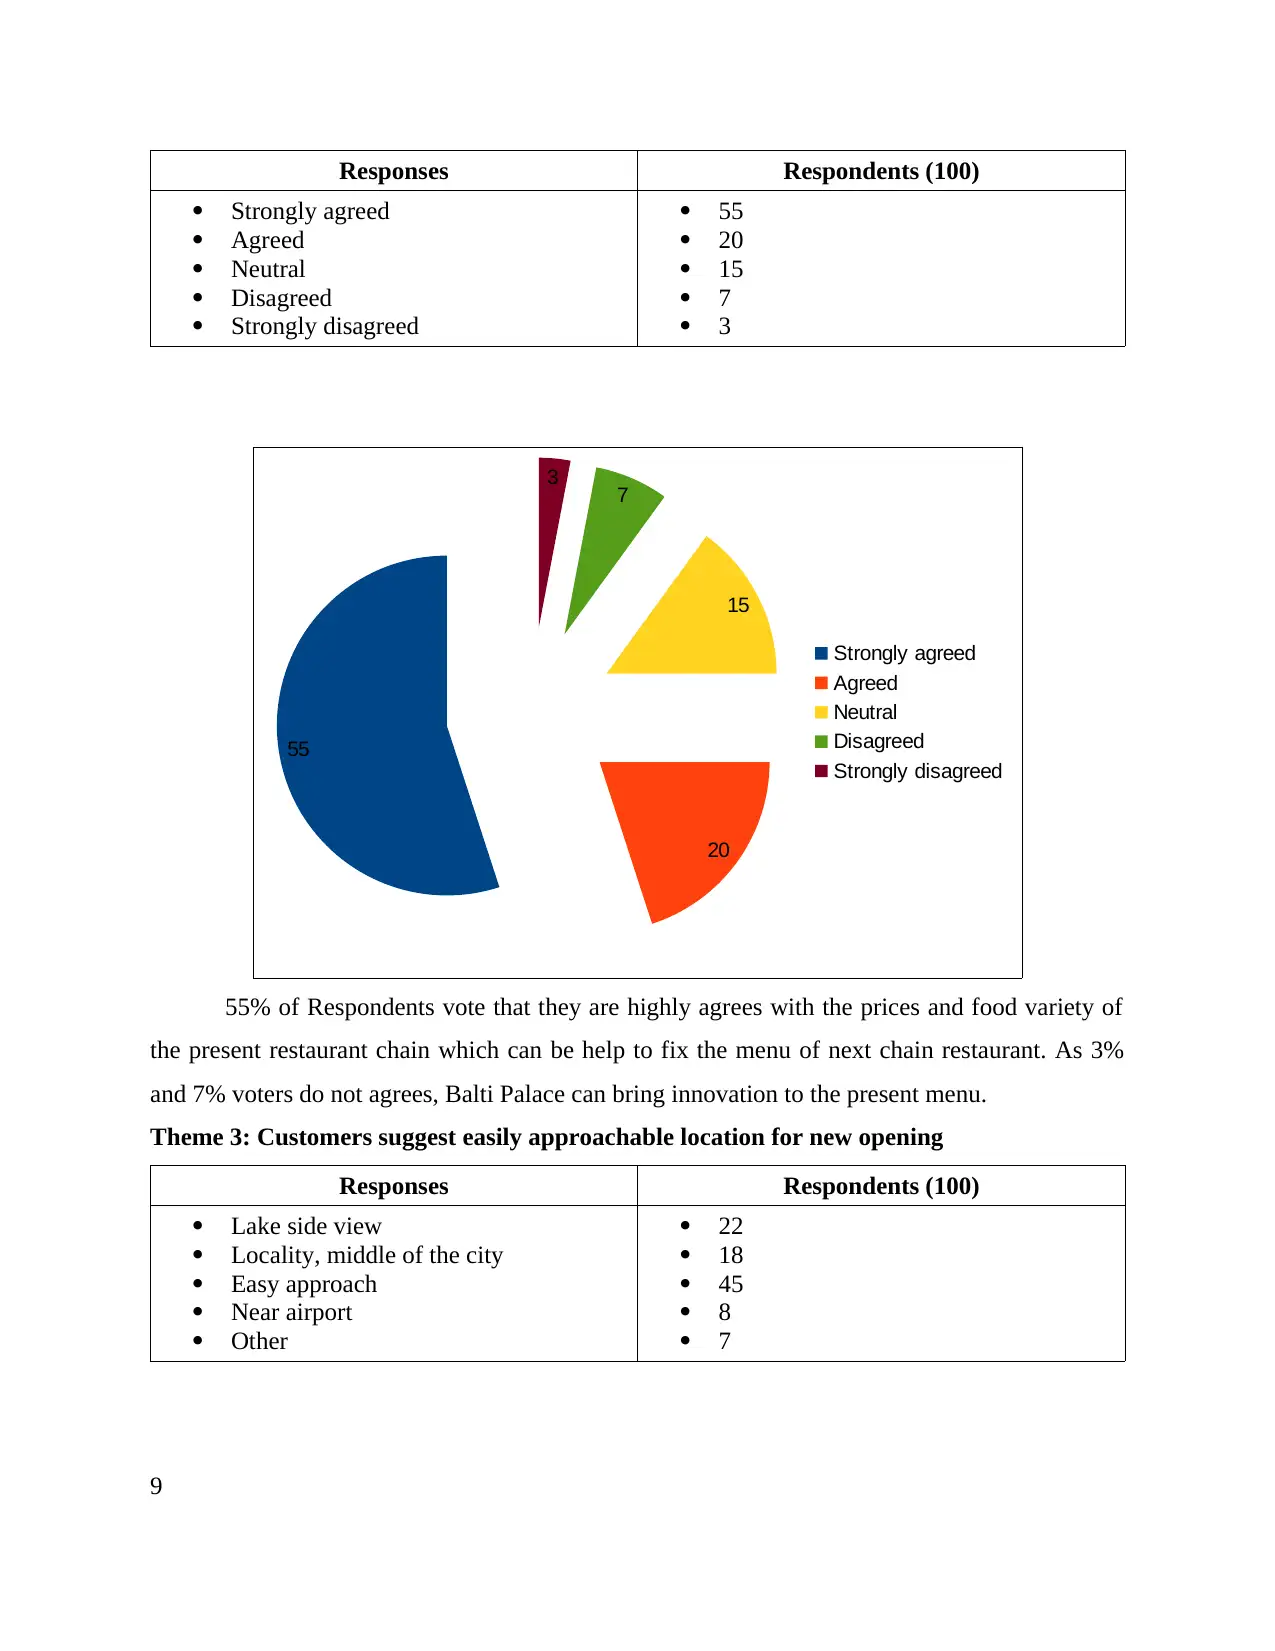
Responses Respondents (100)
Strongly agreed
Agreed
Neutral
Disagreed
Strongly disagreed
55
20
15
7
3
55% of Respondents vote that they are highly agrees with the prices and food variety of
the present restaurant chain which can be help to fix the menu of next chain restaurant. As 3%
and 7% voters do not agrees, Balti Palace can bring innovation to the present menu.
Theme 3: Customers suggest easily approachable location for new opening
Responses Respondents (100)
Lake side view
Locality, middle of the city
Easy approach
Near airport
Other
22
18
45
8
7
9
55
20
15
7
3
Strongly agreed
Agreed
Neutral
Disagreed
Strongly disagreed
Strongly agreed
Agreed
Neutral
Disagreed
Strongly disagreed
55
20
15
7
3
55% of Respondents vote that they are highly agrees with the prices and food variety of
the present restaurant chain which can be help to fix the menu of next chain restaurant. As 3%
and 7% voters do not agrees, Balti Palace can bring innovation to the present menu.
Theme 3: Customers suggest easily approachable location for new opening
Responses Respondents (100)
Lake side view
Locality, middle of the city
Easy approach
Near airport
Other
22
18
45
8
7
9
55
20
15
7
3
Strongly agreed
Agreed
Neutral
Disagreed
Strongly disagreed
⊘ This is a preview!⊘
Do you want full access?
Subscribe today to unlock all pages.
Trusted by 1+ million students worldwide
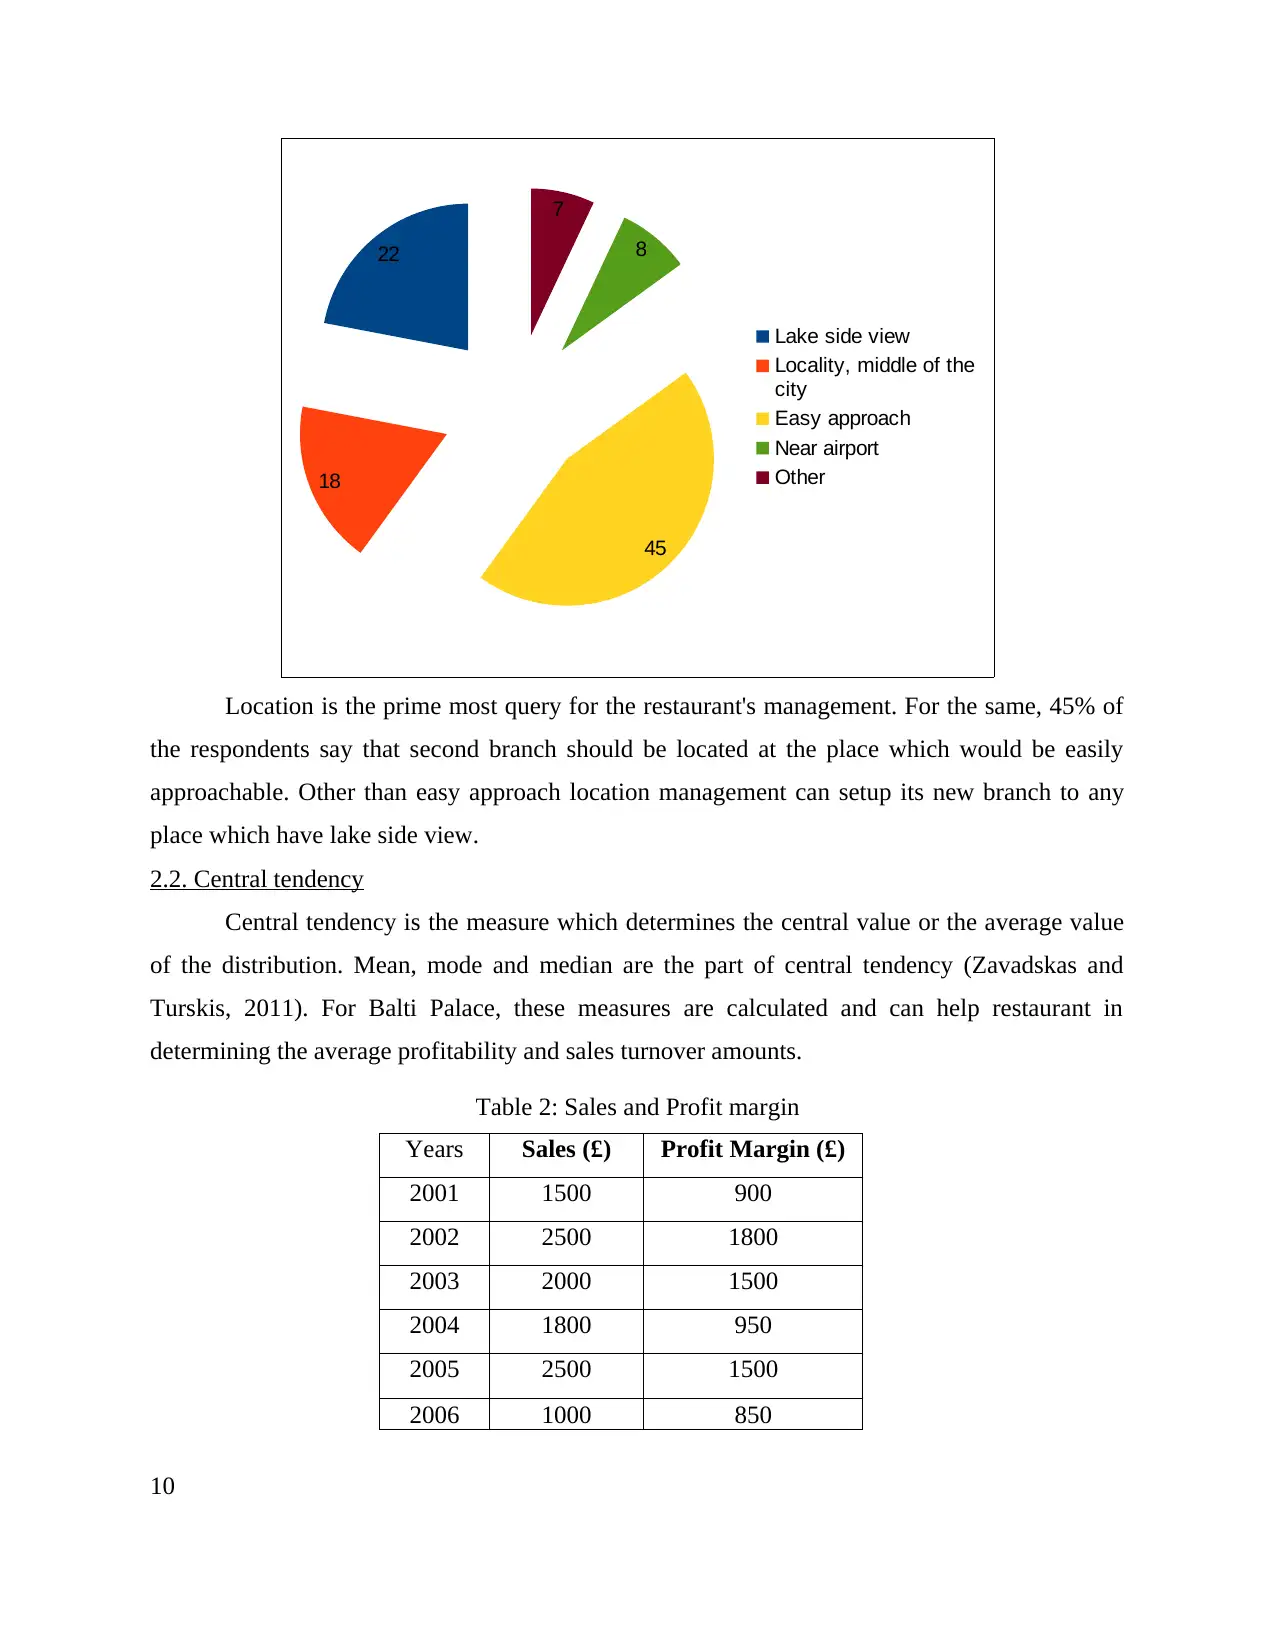
Location is the prime most query for the restaurant's management. For the same, 45% of
the respondents say that second branch should be located at the place which would be easily
approachable. Other than easy approach location management can setup its new branch to any
place which have lake side view.
2.2. Central tendency
Central tendency is the measure which determines the central value or the average value
of the distribution. Mean, mode and median are the part of central tendency (Zavadskas and
Turskis, 2011). For Balti Palace, these measures are calculated and can help restaurant in
determining the average profitability and sales turnover amounts.
Table 2: Sales and Profit margin
Years Sales (£) Profit Margin (£)
2001 1500 900
2002 2500 1800
2003 2000 1500
2004 1800 950
2005 2500 1500
2006 1000 850
10
22
18
45
8
7
Lake side view
Locality, middle of the
city
Easy approach
Near airport
Other
Paraphrase This Document
Need a fresh take? Get an instant paraphrase of this document with our AI Paraphraser
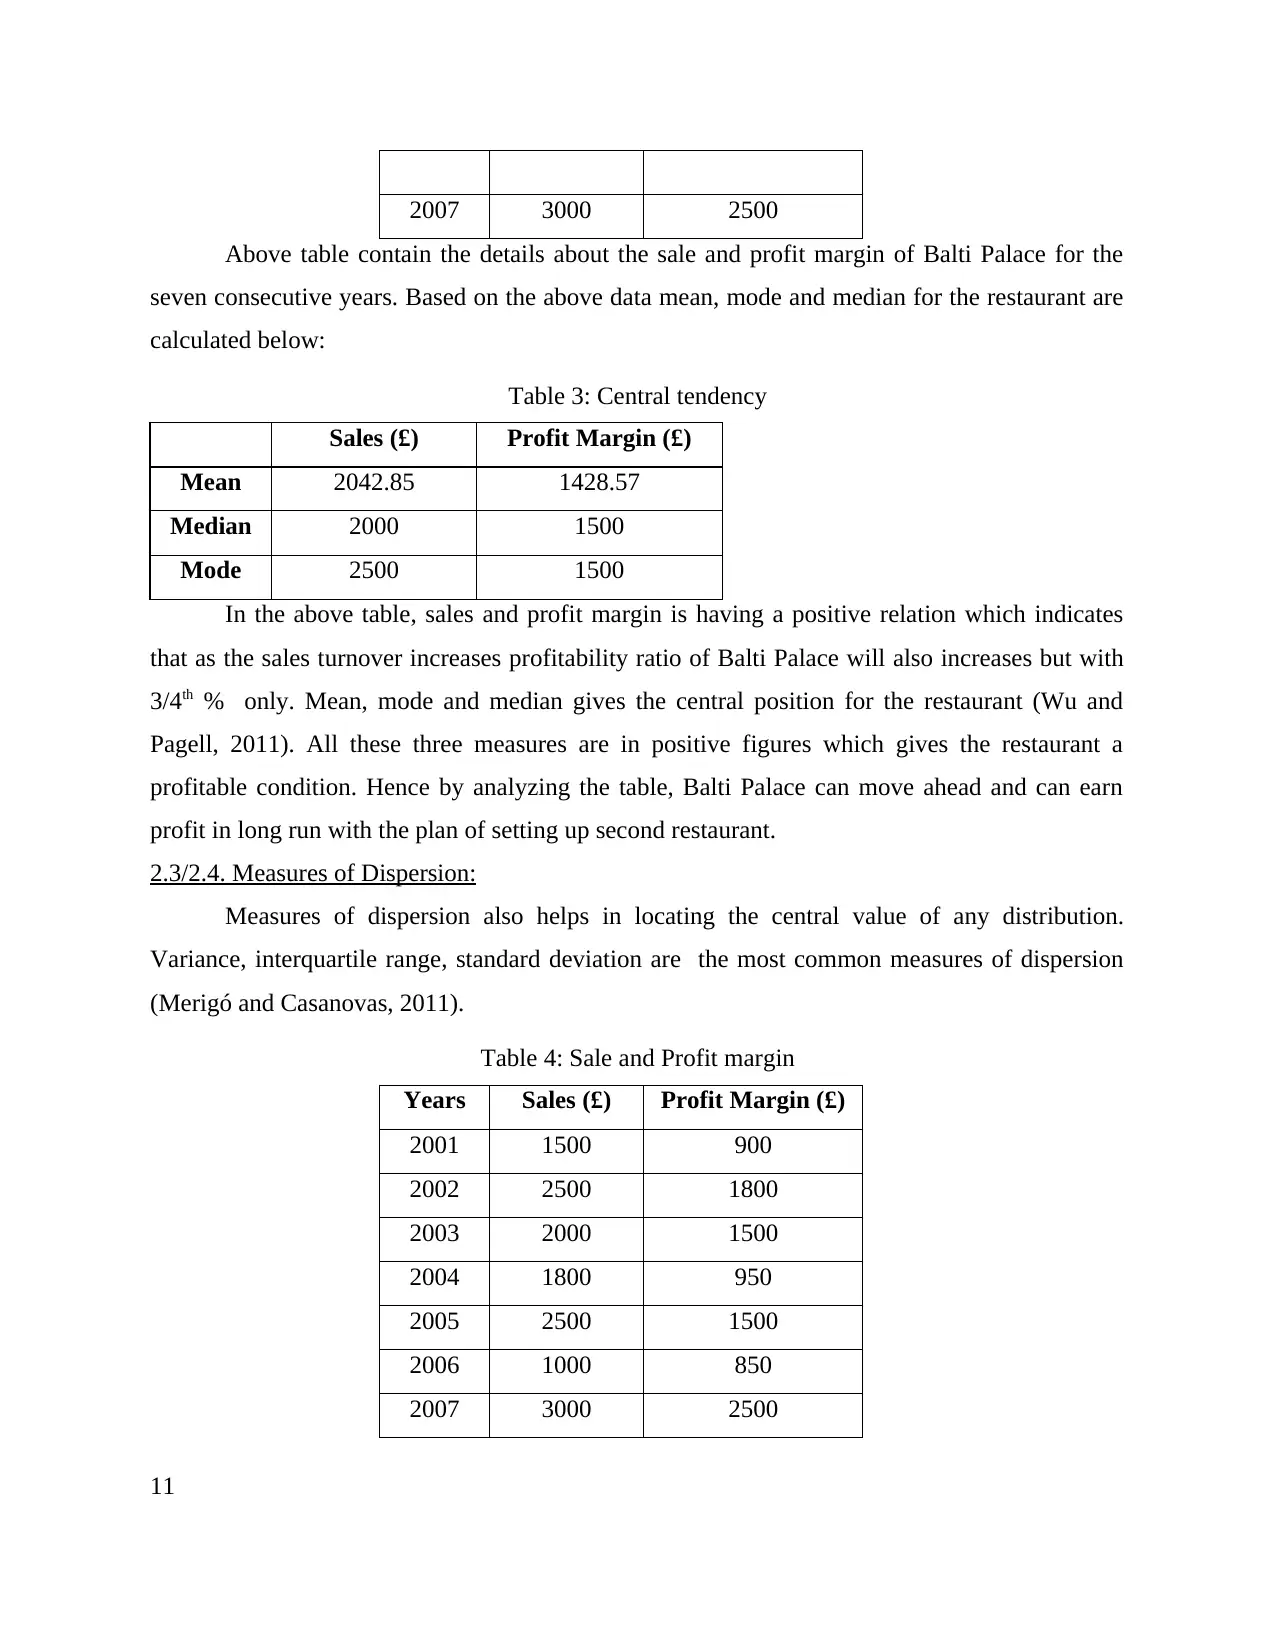
2007 3000 2500
Above table contain the details about the sale and profit margin of Balti Palace for the
seven consecutive years. Based on the above data mean, mode and median for the restaurant are
calculated below:
Table 3: Central tendency
Sales (£) Profit Margin (£)
Mean 2042.85 1428.57
Median 2000 1500
Mode 2500 1500
In the above table, sales and profit margin is having a positive relation which indicates
that as the sales turnover increases profitability ratio of Balti Palace will also increases but with
3/4th % only. Mean, mode and median gives the central position for the restaurant (Wu and
Pagell, 2011). All these three measures are in positive figures which gives the restaurant a
profitable condition. Hence by analyzing the table, Balti Palace can move ahead and can earn
profit in long run with the plan of setting up second restaurant.
2.3/2.4. Measures of Dispersion:
Measures of dispersion also helps in locating the central value of any distribution.
Variance, interquartile range, standard deviation are the most common measures of dispersion
(Merigó and Casanovas, 2011).
Table 4: Sale and Profit margin
Years Sales (£) Profit Margin (£)
2001 1500 900
2002 2500 1800
2003 2000 1500
2004 1800 950
2005 2500 1500
2006 1000 850
2007 3000 2500
11
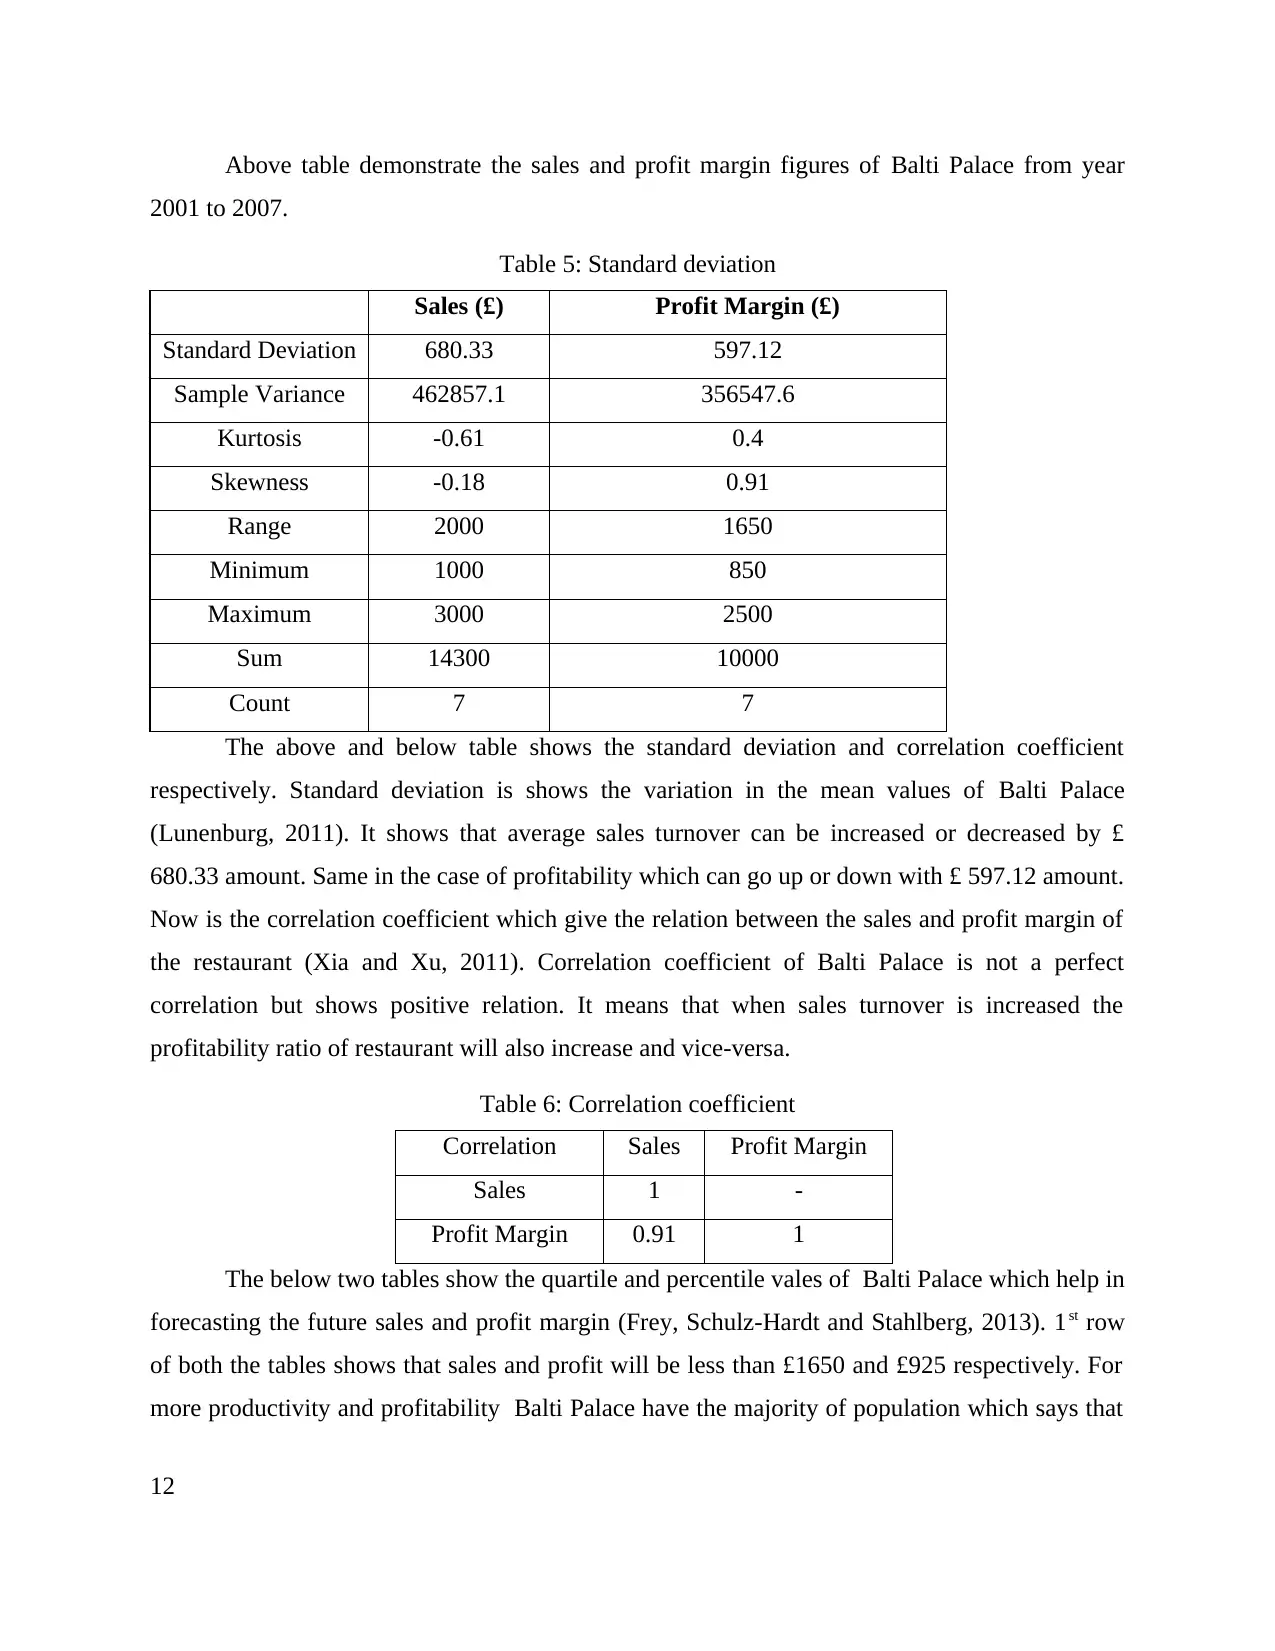
Above table demonstrate the sales and profit margin figures of Balti Palace from year
2001 to 2007.
Table 5: Standard deviation
Sales (£) Profit Margin (£)
Standard Deviation 680.33 597.12
Sample Variance 462857.1 356547.6
Kurtosis -0.61 0.4
Skewness -0.18 0.91
Range 2000 1650
Minimum 1000 850
Maximum 3000 2500
Sum 14300 10000
Count 7 7
The above and below table shows the standard deviation and correlation coefficient
respectively. Standard deviation is shows the variation in the mean values of Balti Palace
(Lunenburg, 2011). It shows that average sales turnover can be increased or decreased by £
680.33 amount. Same in the case of profitability which can go up or down with £ 597.12 amount.
Now is the correlation coefficient which give the relation between the sales and profit margin of
the restaurant (Xia and Xu, 2011). Correlation coefficient of Balti Palace is not a perfect
correlation but shows positive relation. It means that when sales turnover is increased the
profitability ratio of restaurant will also increase and vice-versa.
Table 6: Correlation coefficient
Correlation Sales Profit Margin
Sales 1 -
Profit Margin 0.91 1
The below two tables show the quartile and percentile vales of Balti Palace which help in
forecasting the future sales and profit margin (Frey, Schulz-Hardt and Stahlberg, 2013). 1st row
of both the tables shows that sales and profit will be less than £1650 and £925 respectively. For
more productivity and profitability Balti Palace have the majority of population which says that
12
⊘ This is a preview!⊘
Do you want full access?
Subscribe today to unlock all pages.
Trusted by 1+ million students worldwide
1 out of 26
Related Documents


Your All-in-One AI-Powered Toolkit for Academic Success.
+13062052269
info@desklib.com
Available 24*7 on WhatsApp / Email
![[object Object]](/_next/static/media/star-bottom.7253800d.svg)
Unlock your academic potential
Copyright © 2020–2026 A2Z Services. All Rights Reserved. Developed and managed by ZUCOL.