Business Decision Making Report: Balti Palace Franchise
VerifiedAdded on 2019/12/28
|17
|4930
|342
Report
AI Summary
This report analyzes business decision-making processes, focusing on the case of Balti Palace, a restaurant chain planning a franchise expansion. The report begins with an introduction to business decisions and their importance, followed by a detailed discussion on gathering data from primary and secondary sources. The primary data collection method includes a survey with a questionnaire administered to both existing and potential customers. The report summarizes the survey responses, analyzes the data collected, and draws conclusions regarding customer preferences and the potential for a successful franchise. The analysis includes the evaluation of the restaurant's financial performance over several years. Further, it presents graphical representations of data and discusses trend lines for future forecasting, along with the application of appropriate tools for project management. Finally, the report concludes with a recommendation based on the findings and analysis, highlighting the potential for Balti Palace's successful franchise expansion.
BUSINESS DECISION
MAKING
MAKING
Paraphrase This Document
Need a fresh take? Get an instant paraphrase of this document with our AI Paraphraser
Table of Contents
INTRODUCTION...........................................................................................................................3
TASK 1............................................................................................................................................3
1.1 Plan for gathering data through different sources.................................................................3
1.2 Survey methodology.............................................................................................................4
1.3 Questionnaire for Balti palace...............................................................................................5
2.1 Summarisation of data collected through questionnaire.......................................................6
2.2 Result analysis to draw valid conclusion..............................................................................8
2.3& 2.4 Analysis of data using measure of dispersion by drawing valid conclusion.............10
TASK 2..........................................................................................................................................11
3.1 Graphical presentation........................................................................................................11
3.2 Trend line for better future forecasting...............................................................................13
3.3 Covered in power point.......................................................................................................13
3.4 Formal business report........................................................................................................13
TASK 3..........................................................................................................................................14
4.1& 4.2 Use of appropriate tools and determine the critical path system...............................14
4.3 Financial tools for decision making....................................................................................14
CONCLUSION..............................................................................................................................15
REFRENCES.................................................................................................................................16
INTRODUCTION
A business is consisting of many acts into that which are known as its operation. All of
these actions should have to get accomplish in a proper and systematic manner. Thus decision
are also a part of an organisation management(Akpalu, Alnaa and Aglobitse, 2012). These
decision are known as the business decision. It consist of both the environment internal and
external. An infective decision leads in promoting growth and sustainability for long run.
Consumers are the essential elements of a firm on which consideration all task get accomplish.
Hence, for new project it is mandatory for a business to consult it from their consumers. In this
concern they can use certain number of approaches which are primary and secondary source of
information. This can get done with the help of preparing a number of questions and made a
survey on a population which is a sample of whole. Also by using proper financial tool they can
analyse all risk, profit related factor for a successful business project. The present report is based
on Balti palace which is one of the well establish hotel in London and now they want to open up
their another franchise in London. For this concern they conduct a survey on some number of
people through which they can identify that which place is suitable for them and what kind of
activities they have to add on in their new project.
TASK 1
1.1 Plan for gathering data through different sources
Collection and gathering of data before any new project is must. It is because it lead in
analyse all the market variances and changes which are taking place(Brown and et. al., 2010).
Along with such things it also leads in taking customer opinion in a proper and appropriate
manner. Hence, for collecting and gathering of data promotes in making a successful business
project. There are two major sources which Balti palace have to taken into account for collecting
adequate amount of information so that their new project tends to work in a positive manner. The
two major sources are:
1. Primary source2. Secondary source
a) Primary source: It is a process or act through which adequate information can gather. Such
type of information get collected while conducting personal interviews etc. The main reason
behind this process is to collect right information. Various type of methodology are use in this
⊘ This is a preview!⊘
Do you want full access?
Subscribe today to unlock all pages.
Trusted by 1+ million students worldwide
concern like questionnaire, telephonic feedback, interviews etc. hence, primary source of
information is time consuming process but promote purity of information(Çağman and
Enginoğlu, 2010).
Balti palace can use this source of information and promote sustainability of their project.
It leads in managing all their resources in a proper manner. Also one of the major thing which is
related with this process is to identify that what are the chances of this new hotel success. They
prepare questionnaire and ask them to some number of people out of them some are regular user
of their services and some are non users.
b) Secondary sources: This source of information specifies that all the data which get gather is
based on previous research. The best thing about this approach is to make a valid conclusion
without so much problems and interpretation(Chai, Liu and Ngai, 2013). The main origin
through which all relevant data get collected are the internet, books, journals etc.
Balti palace can use this method for collecting more and more data and know about the
customer preferences and opinion of such locality where they want to establish their firm.
For this research primary data is utilise for analysing choice of their costumers and non
users. Primary data aid them in getting more relevant information for their new project. If they
found positive response of their respondent then they have to open up a new franchise over in
London street. So for this purpose sample framing survey methodology is use in which questions
get asked to some group of people which do not know each other very well.
1.2 Survey methodology
Survey is a process which is conducting on some number of people. The main purpose of
any kind of survey is to gather all type of information which is related with population which
further help in taking effective decision for such group of persons (Power and Phillips-Wren,
2011). Methodology refer to some number of techniques through which this research and survey
process get accomplished. Hence, as per the definition of both terms it is clearly identify that
survey methodology are the approaches which are beneficial for an organisation to draw a valid
result. Some of the well known survey methods are:
1. Questionnaire
2. Interviews
3. Documentation Review
Paraphrase This Document
Need a fresh take? Get an instant paraphrase of this document with our AI Paraphraser
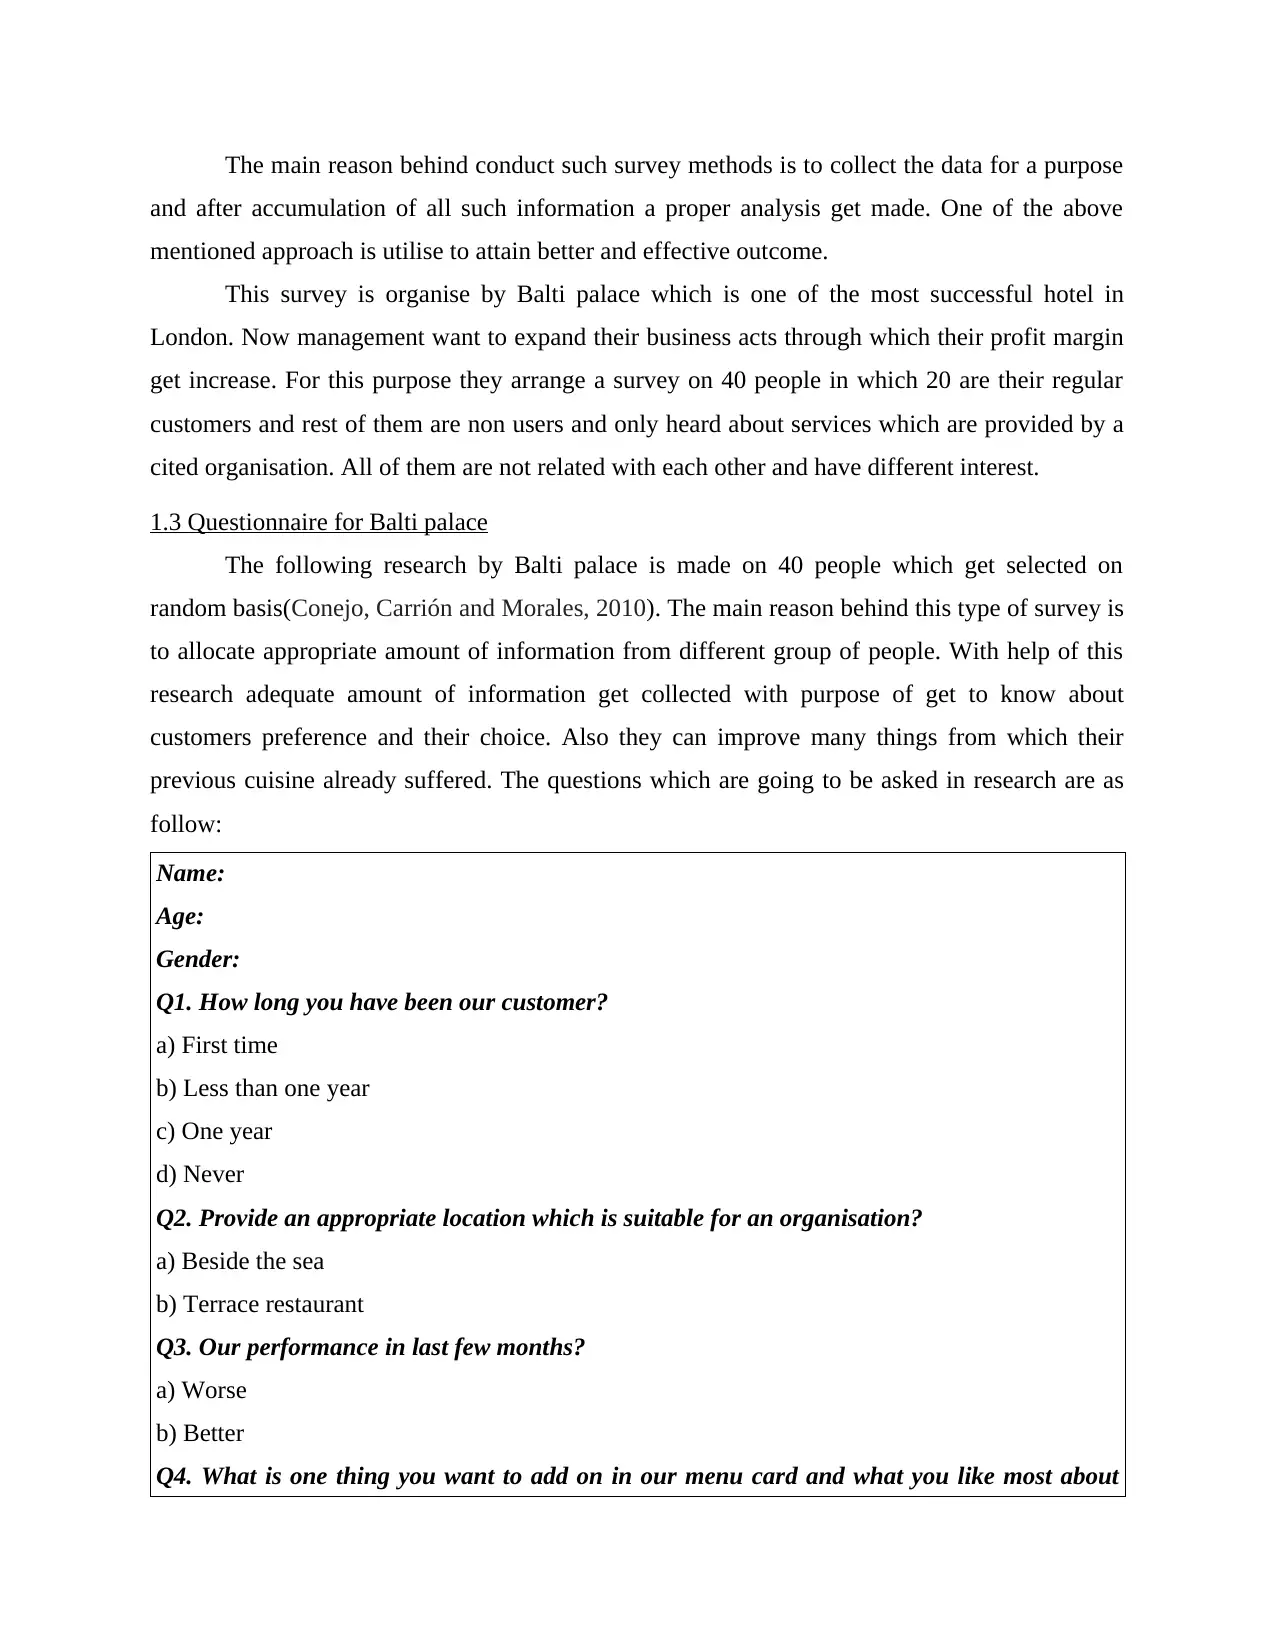
The main reason behind conduct such survey methods is to collect the data for a purpose
and after accumulation of all such information a proper analysis get made. One of the above
mentioned approach is utilise to attain better and effective outcome.
This survey is organise by Balti palace which is one of the most successful hotel in
London. Now management want to expand their business acts through which their profit margin
get increase. For this purpose they arrange a survey on 40 people in which 20 are their regular
customers and rest of them are non users and only heard about services which are provided by a
cited organisation. All of them are not related with each other and have different interest.
1.3 Questionnaire for Balti palace
The following research by Balti palace is made on 40 people which get selected on
random basis(Conejo, Carrión and Morales, 2010). The main reason behind this type of survey is
to allocate appropriate amount of information from different group of people. With help of this
research adequate amount of information get collected with purpose of get to know about
customers preference and their choice. Also they can improve many things from which their
previous cuisine already suffered. The questions which are going to be asked in research are as
follow:
Name:
Age:
Gender:
Q1. How long you have been our customer?
a) First time
b) Less than one year
c) One year
d) Never
Q2. Provide an appropriate location which is suitable for an organisation?
a) Beside the sea
b) Terrace restaurant
Q3. Our performance in last few months?
a) Worse
b) Better
Q4. What is one thing you want to add on in our menu card and what you like most about
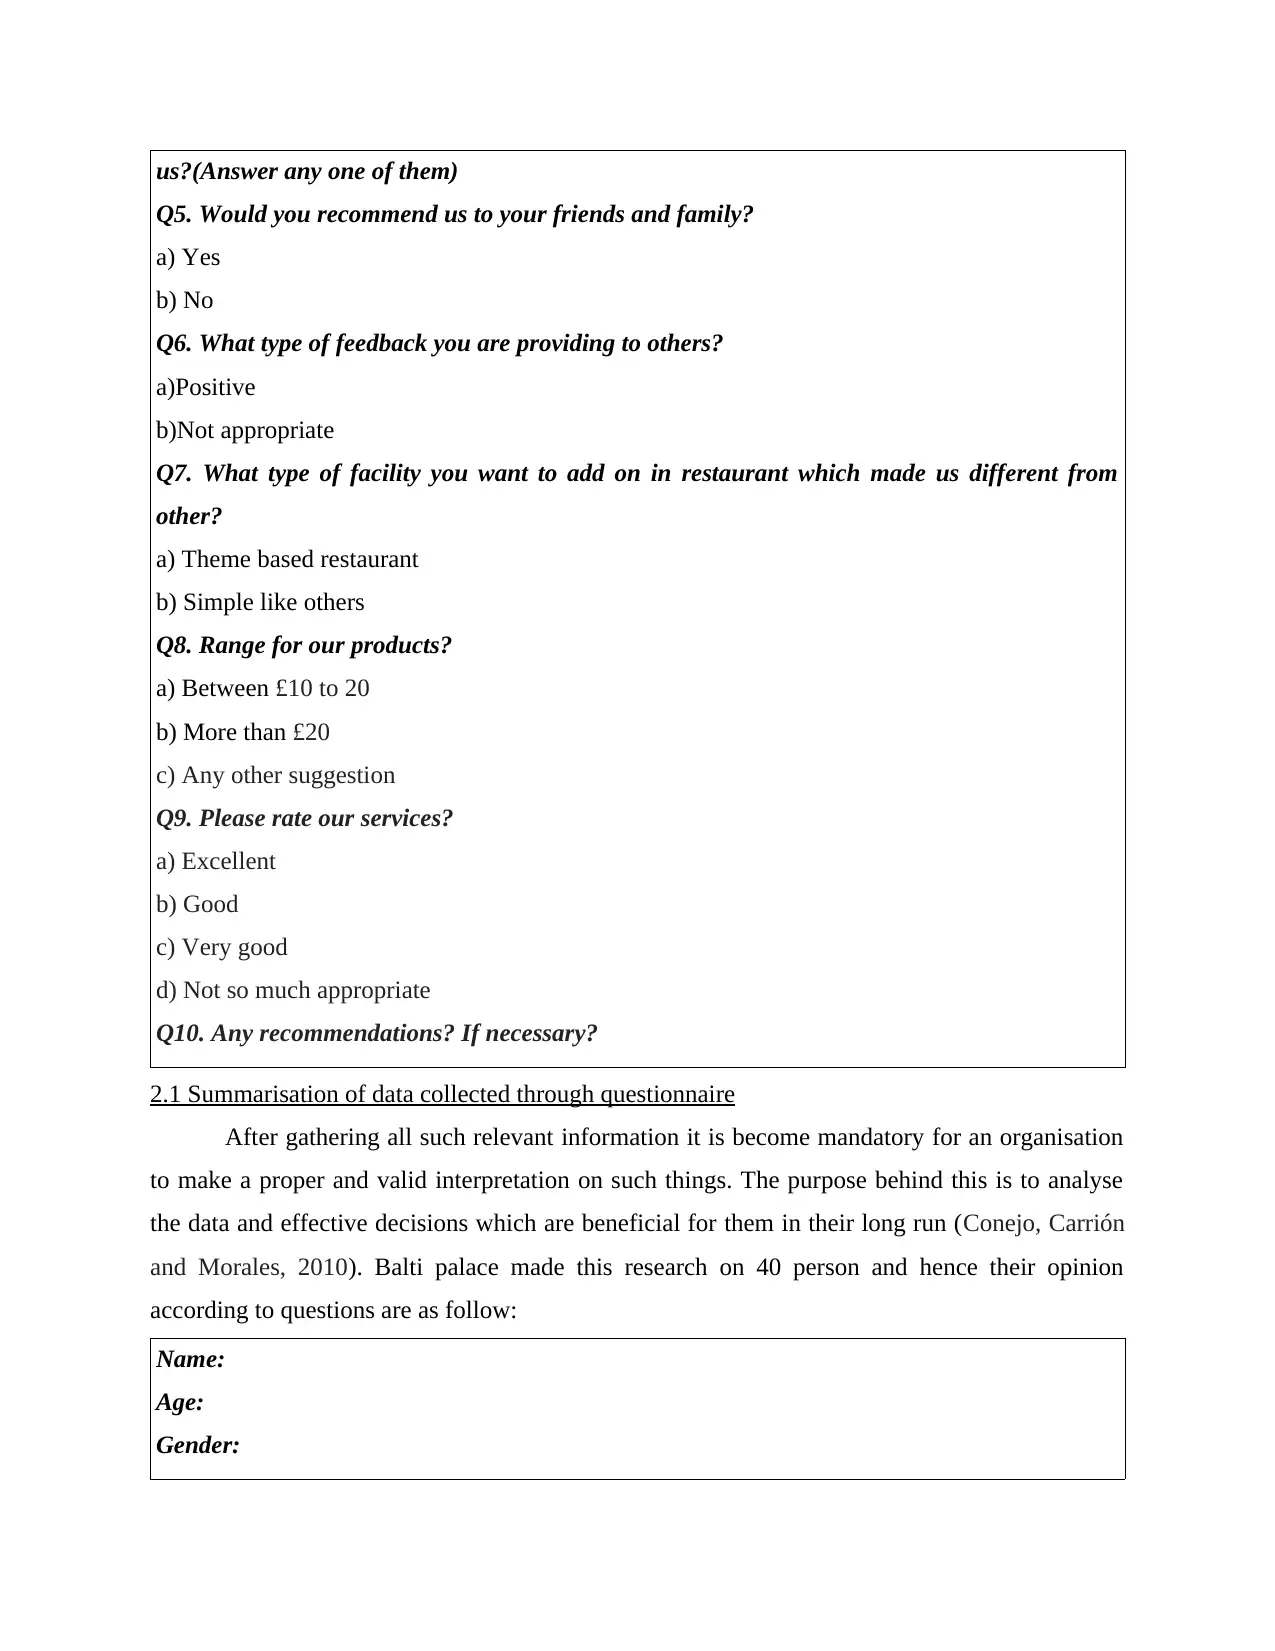
us?(Answer any one of them)
Q5. Would you recommend us to your friends and family?
a) Yes
b) No
Q6. What type of feedback you are providing to others?
a)Positive
b)Not appropriate
Q7. What type of facility you want to add on in restaurant which made us different from
other?
a) Theme based restaurant
b) Simple like others
Q8. Range for our products?
a) Between £10 to 20
b) More than £20
c) Any other suggestion
Q9. Please rate our services?
a) Excellent
b) Good
c) Very good
d) Not so much appropriate
Q10. Any recommendations? If necessary?
2.1 Summarisation of data collected through questionnaire
After gathering all such relevant information it is become mandatory for an organisation
to make a proper and valid interpretation on such things. The purpose behind this is to analyse
the data and effective decisions which are beneficial for them in their long run (Conejo, Carrión
and Morales, 2010). Balti palace made this research on 40 person and hence their opinion
according to questions are as follow:
Name:
Age:
Gender:
⊘ This is a preview!⊘
Do you want full access?
Subscribe today to unlock all pages.
Trusted by 1+ million students worldwide
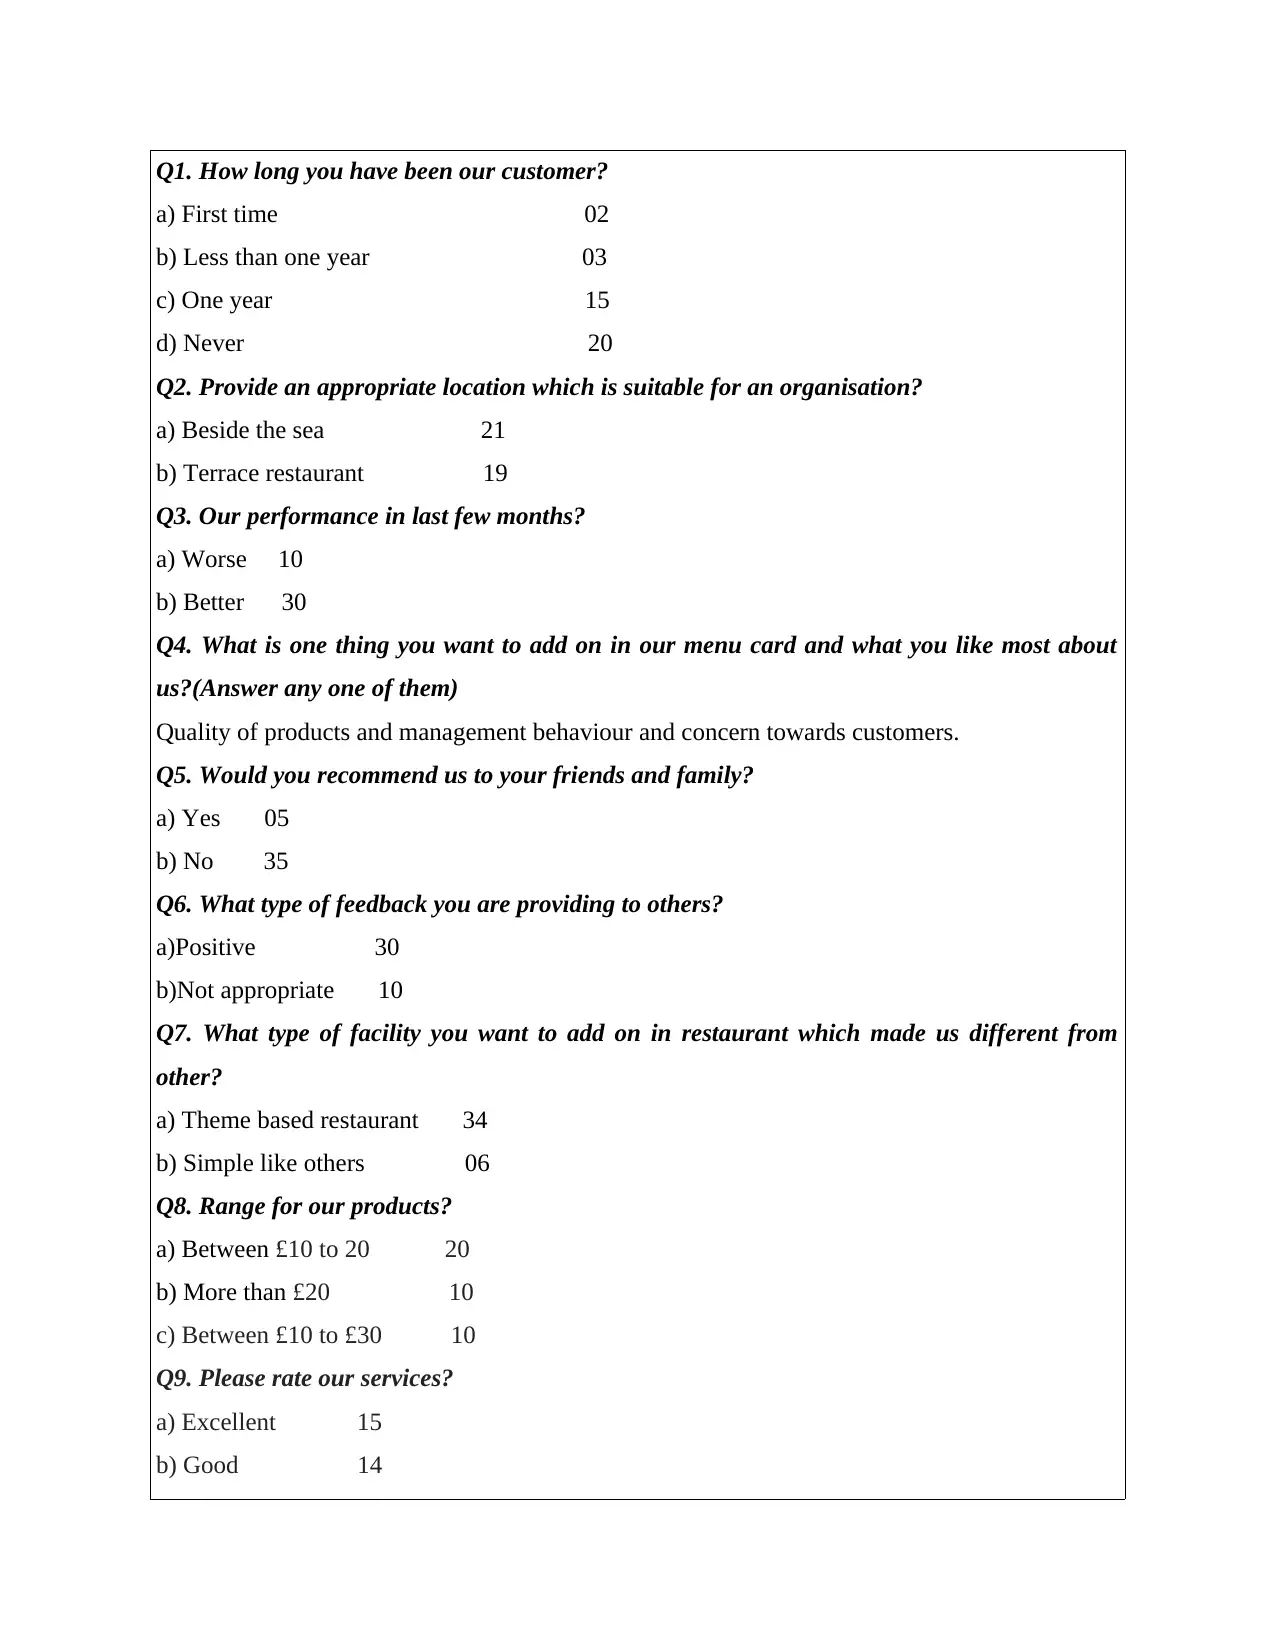
Q1. How long you have been our customer?
a) First time 02
b) Less than one year 03
c) One year 15
d) Never 20
Q2. Provide an appropriate location which is suitable for an organisation?
a) Beside the sea 21
b) Terrace restaurant 19
Q3. Our performance in last few months?
a) Worse 10
b) Better 30
Q4. What is one thing you want to add on in our menu card and what you like most about
us?(Answer any one of them)
Quality of products and management behaviour and concern towards customers.
Q5. Would you recommend us to your friends and family?
a) Yes 05
b) No 35
Q6. What type of feedback you are providing to others?
a)Positive 30
b)Not appropriate 10
Q7. What type of facility you want to add on in restaurant which made us different from
other?
a) Theme based restaurant 34
b) Simple like others 06
Q8. Range for our products?
a) Between £10 to 20 20
b) More than £20 10
c) Between £10 to £30 10
Q9. Please rate our services?
a) Excellent 15
b) Good 14
Paraphrase This Document
Need a fresh take? Get an instant paraphrase of this document with our AI Paraphraser
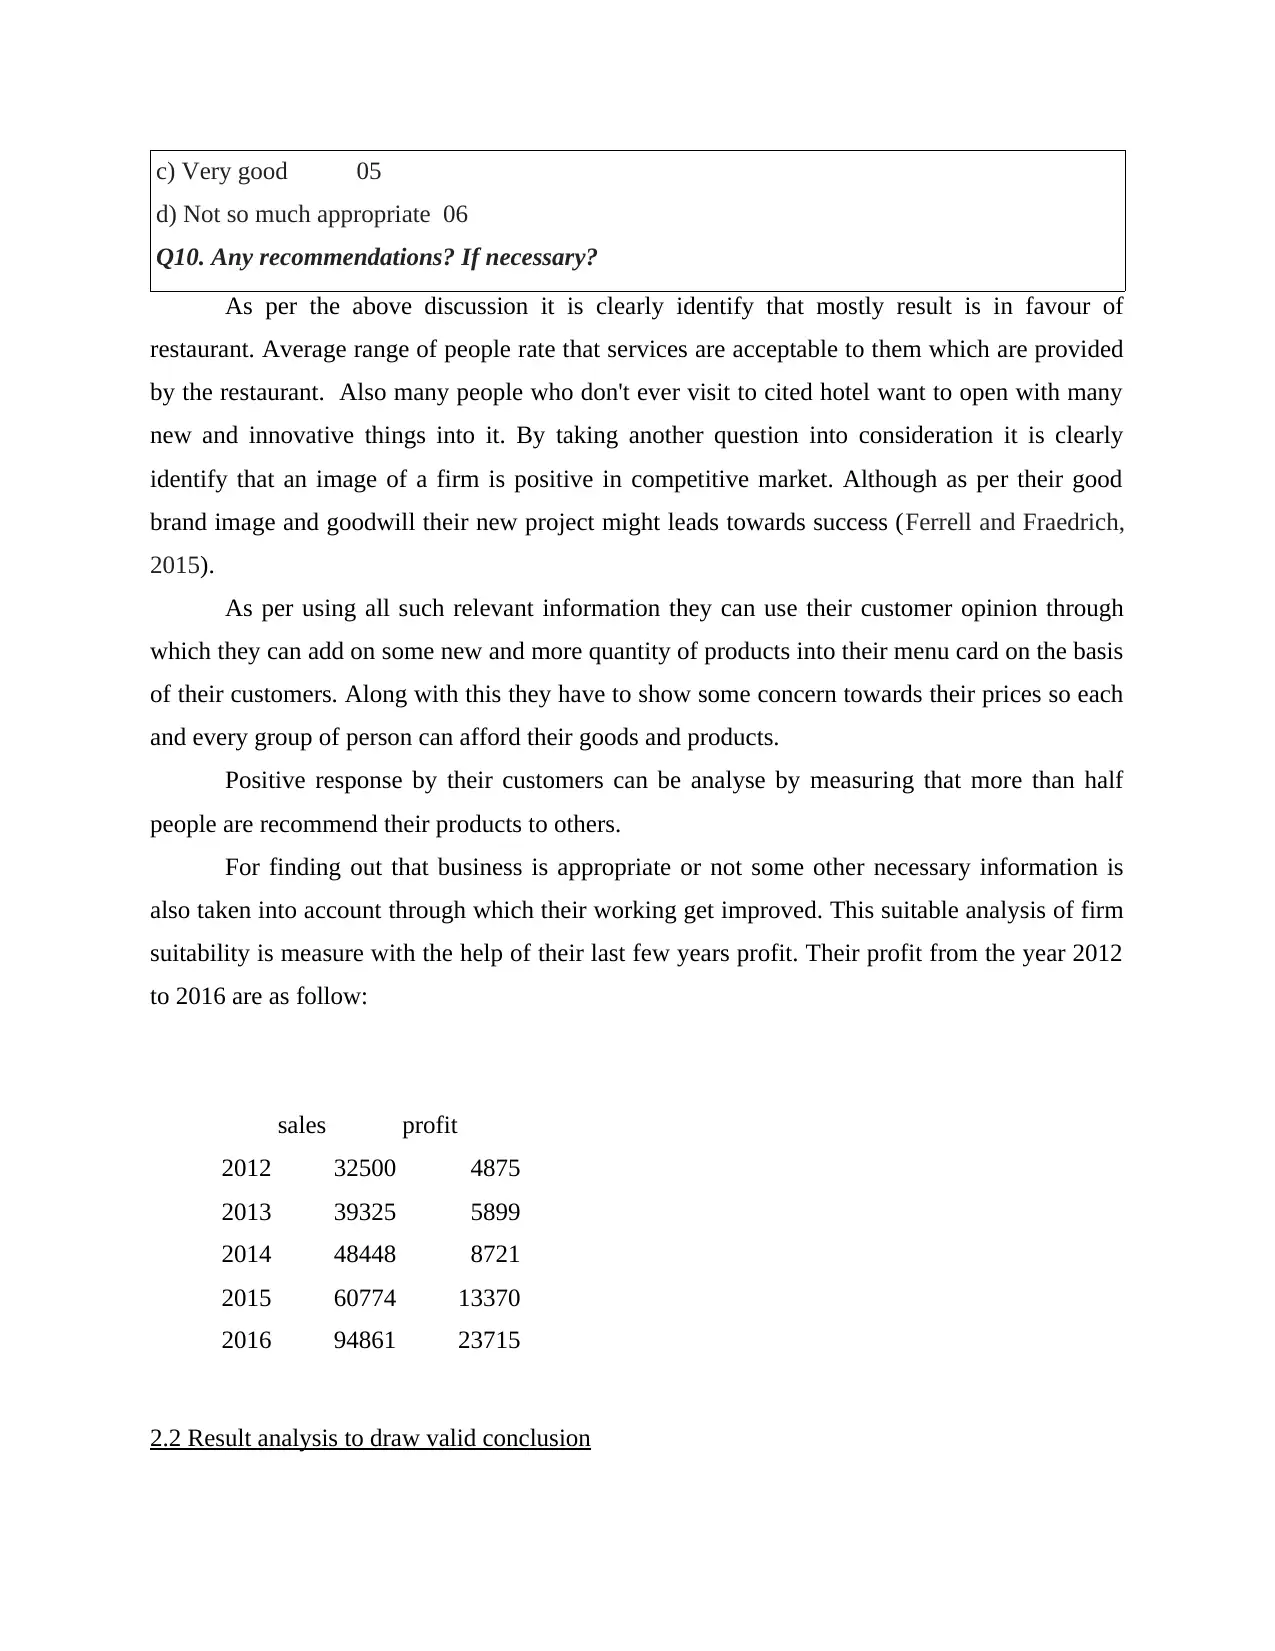
c) Very good 05
d) Not so much appropriate 06
Q10. Any recommendations? If necessary?
As per the above discussion it is clearly identify that mostly result is in favour of
restaurant. Average range of people rate that services are acceptable to them which are provided
by the restaurant. Also many people who don't ever visit to cited hotel want to open with many
new and innovative things into it. By taking another question into consideration it is clearly
identify that an image of a firm is positive in competitive market. Although as per their good
brand image and goodwill their new project might leads towards success (Ferrell and Fraedrich,
2015).
As per using all such relevant information they can use their customer opinion through
which they can add on some new and more quantity of products into their menu card on the basis
of their customers. Along with this they have to show some concern towards their prices so each
and every group of person can afford their goods and products.
Positive response by their customers can be analyse by measuring that more than half
people are recommend their products to others.
For finding out that business is appropriate or not some other necessary information is
also taken into account through which their working get improved. This suitable analysis of firm
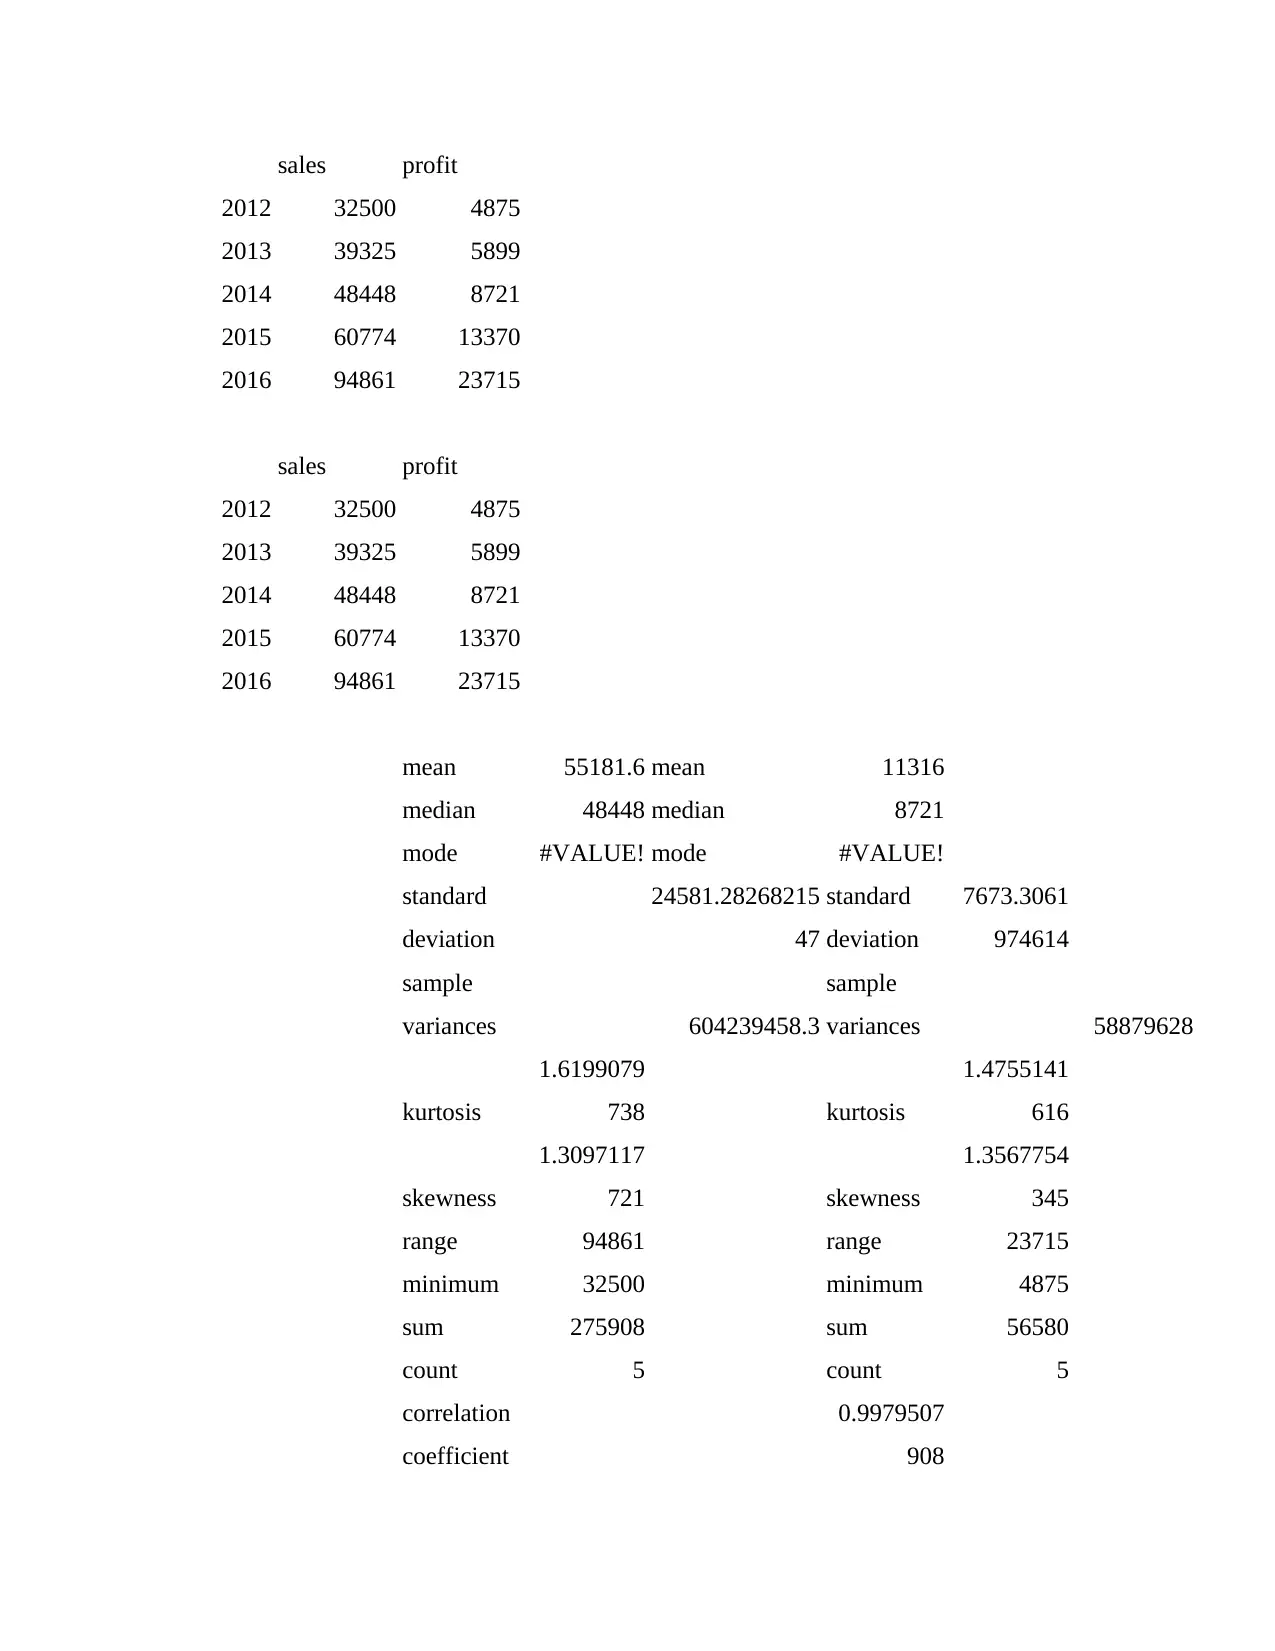
suitability is measure with the help of their last few years profit. Their profit from the year 2012
to 2016 are as follow:
sales profit
2012 32500 4875
2013 39325 5899
2014 48448 8721
2015 60774 13370
2016 94861 23715
2.2 Result analysis to draw valid conclusion
d) Not so much appropriate 06
Q10. Any recommendations? If necessary?
As per the above discussion it is clearly identify that mostly result is in favour of
restaurant. Average range of people rate that services are acceptable to them which are provided
by the restaurant. Also many people who don't ever visit to cited hotel want to open with many
new and innovative things into it. By taking another question into consideration it is clearly
identify that an image of a firm is positive in competitive market. Although as per their good
brand image and goodwill their new project might leads towards success (Ferrell and Fraedrich,
2015).
As per using all such relevant information they can use their customer opinion through
which they can add on some new and more quantity of products into their menu card on the basis
of their customers. Along with this they have to show some concern towards their prices so each
and every group of person can afford their goods and products.
Positive response by their customers can be analyse by measuring that more than half
people are recommend their products to others.
For finding out that business is appropriate or not some other necessary information is
also taken into account through which their working get improved. This suitable analysis of firm
suitability is measure with the help of their last few years profit. Their profit from the year 2012
to 2016 are as follow:
sales profit
2012 32500 4875
2013 39325 5899
2014 48448 8721
2015 60774 13370
2016 94861 23715
2.2 Result analysis to draw valid conclusion
sales profit
2012 32500 4875
2013 39325 5899
2014 48448 8721
2015 60774 13370
2016 94861 23715
sales profit
2012 32500 4875
2013 39325 5899
2014 48448 8721
2015 60774 13370
2016 94861 23715
mean 55181.6 mean 11316
median 48448 median 8721
mode #VALUE! mode #VALUE!
standard
deviation
24581.28268215
47
standard
deviation
7673.3061
974614
sample
variances 604239458.3
sample
variances 58879628
kurtosis
1.6199079
738 kurtosis
1.4755141
616
skewness
1.3097117
721 skewness
1.3567754
345
range 94861 range 23715
minimum 32500 minimum 4875
sum 275908 sum 56580
count 5 count 5
correlation
coefficient
0.9979507
908
2012 32500 4875
2013 39325 5899
2014 48448 8721
2015 60774 13370
2016 94861 23715
sales profit
2012 32500 4875
2013 39325 5899
2014 48448 8721
2015 60774 13370
2016 94861 23715
mean 55181.6 mean 11316
median 48448 median 8721
mode #VALUE! mode #VALUE!
standard
deviation
24581.28268215
47
standard
deviation
7673.3061
974614
sample
variances 604239458.3
sample
variances 58879628
kurtosis
1.6199079
738 kurtosis
1.4755141
616
skewness
1.3097117
721 skewness
1.3567754
345
range 94861 range 23715
minimum 32500 minimum 4875
sum 275908 sum 56580
count 5 count 5
correlation
coefficient
0.9979507
908
⊘ This is a preview!⊘
Do you want full access?
Subscribe today to unlock all pages.
Trusted by 1+ million students worldwide
As per the above results from last few years it get analyse that firm profit is increasing
day after day. This is a reflection of their sales which signifies that their customers and clients
are getting satisfy in an appropriate manner. In this concern average sales and profit get
calculated through which a proper analysis is get done with a positive significance over on an
organisation another franchise. A more elaboration which is important in this field is as follow:
Mean: It refer the average of such things which are getting calculated while taking some
measurable things into account. According to the Balti palace average sales and profit it denotes
that their profit is rising day after day just because of their sales. They are providing good quality
products and services to their customers (Ford and Richardson, 2011).
Median: Median is a mid value of a statistical data which shows that if it is odd in number then
median is a middle value of the series or if it is even in nature then it clarifies that it is a addition
of two central digits of table. As according to the data it is clearly identified that cited company
have good customer base as their products are getting liked by most of their guest. Also it
represents that if they are going to open new franchise then it leads in getting positive outcome.
According to the analysis of data an organisation found that their idea is good and
promote them in a positive manner. But the only thing which they have to recognise that all
arrangements should have to made according to their customer opinion (Ho, Xu and Dey, 2010).
Although it is a best method through which they can survive in market for long run.
2.3& 2.4 Analysis of data using measure of dispersion by drawing valid conclusion
Measure of dispersion is a technique through which all changes which are helpful for an
organisation get measure. It is helpful in identify that how spread out the data set is. Measure is a
process which help in calculating the analytical table. Tabulated data get converted into small
groups through which decision making process become easy and appropriate. Some common
measure of dispersion which aid Balti palace in taking effective decision are as follow:
1. Standard deviations: It shows that how much changes and variances are taking place
which is get exist from the mean. A low standard deviation shows that it is very close to
the mean value where as on the other hand high standard deviation represents more
scattering data (Hwang and Yoon, 2012).
2. Quartile:There are mainly four type of quartile which divided the whole frequency into
four parts. The first quartile is defined as the middle number between the smallest
number and median of the data. Second quartile represent is median of data. Third
Paraphrase This Document
Need a fresh take? Get an instant paraphrase of this document with our AI Paraphraser
quartile represents the middle value between the highest and median value set of
frequency.
3. Percentile: Each of the 100th equal group which is divided according to the distribution of
values of a particular variables.
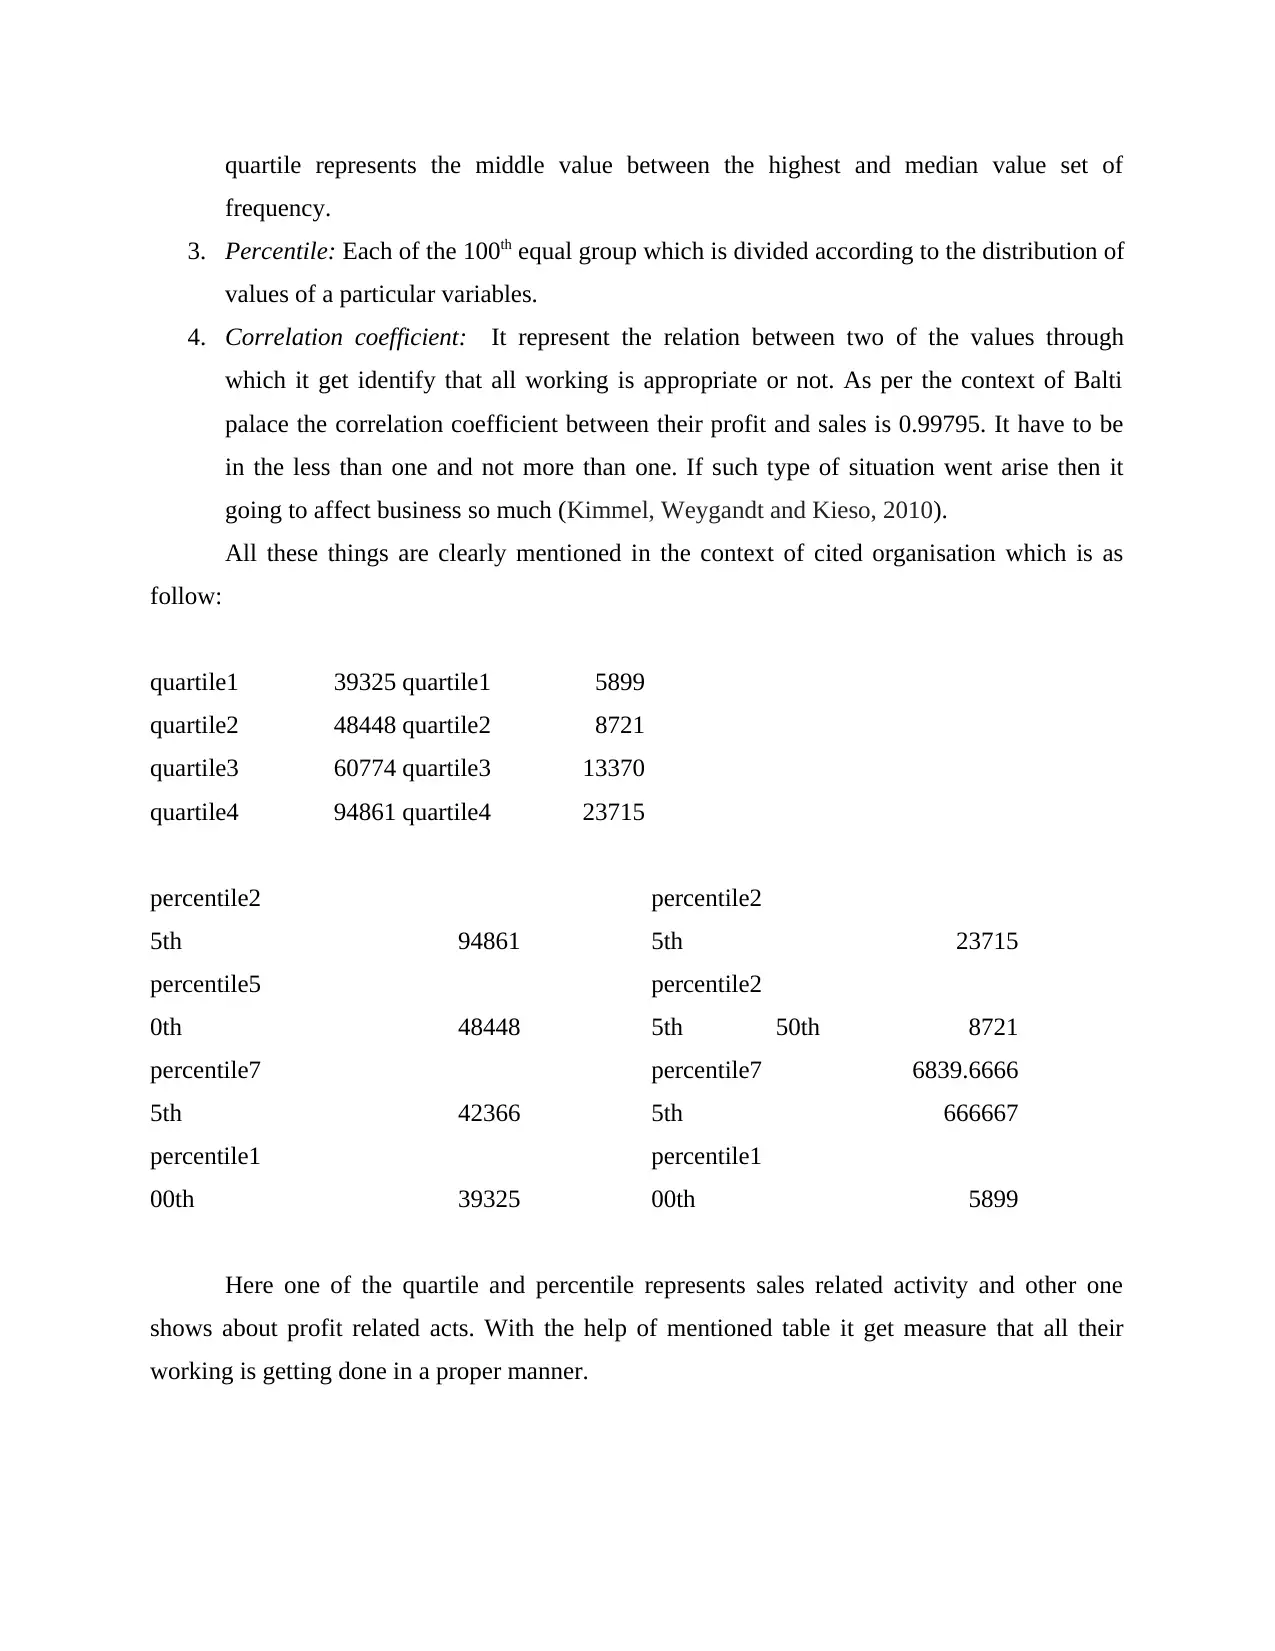
4. Correlation coefficient: It represent the relation between two of the values through
which it get identify that all working is appropriate or not. As per the context of Balti
palace the correlation coefficient between their profit and sales is 0.99795. It have to be
in the less than one and not more than one. If such type of situation went arise then it
going to affect business so much (Kimmel, Weygandt and Kieso, 2010).
All these things are clearly mentioned in the context of cited organisation which is as
follow:
quartile1 39325 quartile1 5899
quartile2 48448 quartile2 8721
quartile3 60774 quartile3 13370
quartile4 94861 quartile4 23715
percentile2
5th 94861
percentile2
5th 23715
percentile5
0th 48448
percentile2
5th 50th 8721
percentile7
5th 42366
percentile7
5th
6839.6666
666667
percentile1
00th 39325
percentile1
00th 5899
Here one of the quartile and percentile represents sales related activity and other one
shows about profit related acts. With the help of mentioned table it get measure that all their
working is getting done in a proper manner.
frequency.
3. Percentile: Each of the 100th equal group which is divided according to the distribution of
values of a particular variables.
4. Correlation coefficient: It represent the relation between two of the values through
which it get identify that all working is appropriate or not. As per the context of Balti
palace the correlation coefficient between their profit and sales is 0.99795. It have to be
in the less than one and not more than one. If such type of situation went arise then it
going to affect business so much (Kimmel, Weygandt and Kieso, 2010).
All these things are clearly mentioned in the context of cited organisation which is as
follow:
quartile1 39325 quartile1 5899
quartile2 48448 quartile2 8721
quartile3 60774 quartile3 13370
quartile4 94861 quartile4 23715
percentile2
5th 94861
percentile2
5th 23715
percentile5
0th 48448
percentile2
5th 50th 8721
percentile7
5th 42366
percentile7
5th
6839.6666
666667
percentile1
00th 39325
percentile1
00th 5899
Here one of the quartile and percentile represents sales related activity and other one
shows about profit related acts. With the help of mentioned table it get measure that all their
working is getting done in a proper manner.
TASK 2
3.1 Graphical presentation
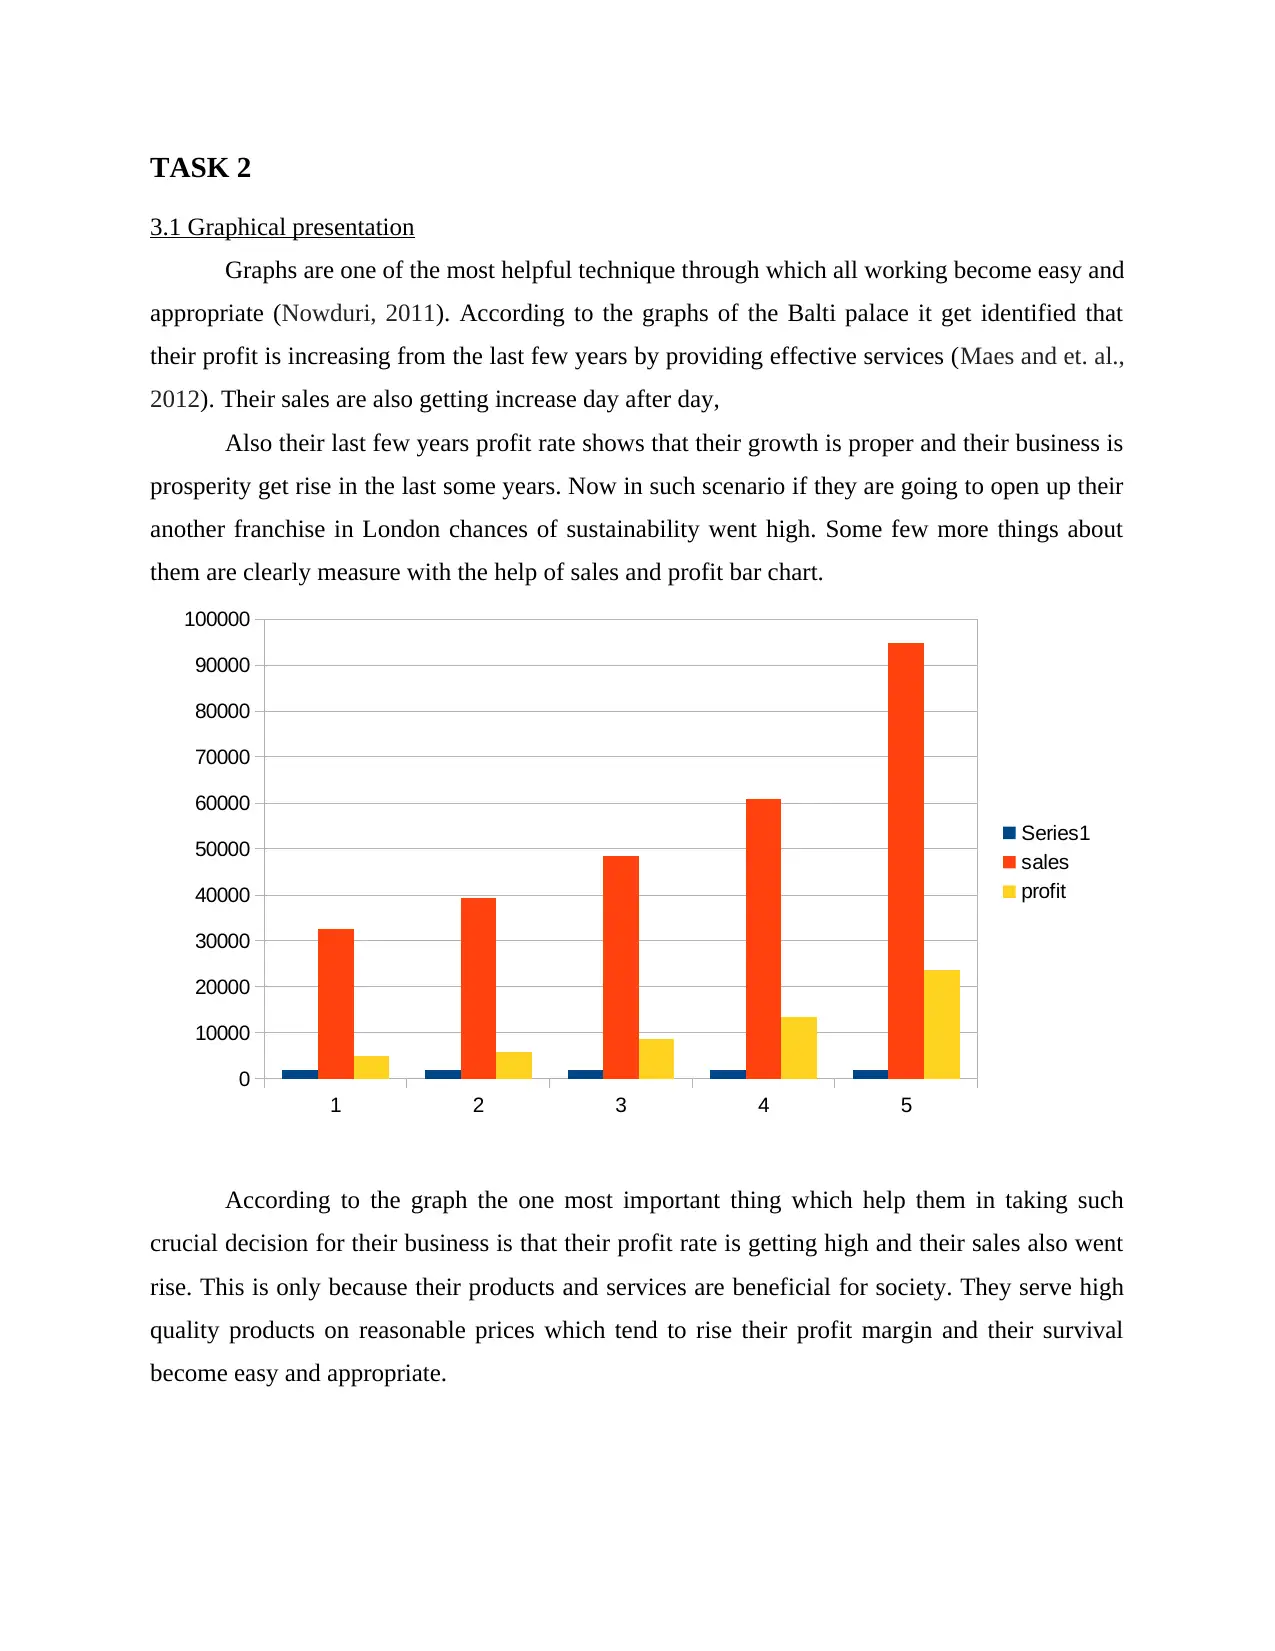
Graphs are one of the most helpful technique through which all working become easy and
appropriate (Nowduri, 2011). According to the graphs of the Balti palace it get identified that
their profit is increasing from the last few years by providing effective services (Maes and et. al.,
2012). Their sales are also getting increase day after day,
Also their last few years profit rate shows that their growth is proper and their business is
prosperity get rise in the last some years. Now in such scenario if they are going to open up their
another franchise in London chances of sustainability went high. Some few more things about
them are clearly measure with the help of sales and profit bar chart.
According to the graph the one most important thing which help them in taking such
crucial decision for their business is that their profit rate is getting high and their sales also went
rise. This is only because their products and services are beneficial for society. They serve high
quality products on reasonable prices which tend to rise their profit margin and their survival
become easy and appropriate.
1 2 3 4 5
0
10000
20000
30000
40000
50000
60000
70000
80000
90000
100000
Series1
sales
profit
3.1 Graphical presentation
Graphs are one of the most helpful technique through which all working become easy and
appropriate (Nowduri, 2011). According to the graphs of the Balti palace it get identified that
their profit is increasing from the last few years by providing effective services (Maes and et. al.,
2012). Their sales are also getting increase day after day,
Also their last few years profit rate shows that their growth is proper and their business is
prosperity get rise in the last some years. Now in such scenario if they are going to open up their
another franchise in London chances of sustainability went high. Some few more things about
them are clearly measure with the help of sales and profit bar chart.
According to the graph the one most important thing which help them in taking such
crucial decision for their business is that their profit rate is getting high and their sales also went
rise. This is only because their products and services are beneficial for society. They serve high
quality products on reasonable prices which tend to rise their profit margin and their survival
become easy and appropriate.
1 2 3 4 5
0
10000
20000
30000
40000
50000
60000
70000
80000
90000
100000
Series1
sales
profit
⊘ This is a preview!⊘
Do you want full access?
Subscribe today to unlock all pages.
Trusted by 1+ million students worldwide
1 out of 17
Related Documents


Your All-in-One AI-Powered Toolkit for Academic Success.
+13062052269
info@desklib.com
Available 24*7 on WhatsApp / Email
![[object Object]](/_next/static/media/star-bottom.7253800d.svg)
Unlock your academic potential
Copyright © 2020–2026 A2Z Services. All Rights Reserved. Developed and managed by ZUCOL.