Balti Palace: Data Analysis and Report for Business Decisions
VerifiedAdded on 2020/07/22
|22
|4530
|56
Report
AI Summary
This report analyzes the data collected for Balti Palace, a restaurant chain, to assess the viability of opening a new branch in London. The report begins with an introduction outlining the need for data-driven decision-making and the use of primary and secondary data collection methods. Task 1 focuses on primary and secondary data sources, survey methodologies, and questionnaire design. Task 2 covers the creation of information for decision-making using representative values, drawing conclusions from research, evaluating measures of dispersion, and the advantages of using quartiles, percentiles, and correlation coefficients. Task 3 involves the formulation of charts, graphs, and trend lines to interpret information and prepare a formal report. Task 4 addresses the application of information processing and financial tools for decision-making, including project planning and critical path determination. The report uses questionnaires to gather data on customer satisfaction, preferences, and opinions regarding the expansion plan. Statistical tools such as mean, median, and mode are used to analyze the collected data and draw conclusions. The report aims to provide insights and recommendations for Balti Palace's expansion strategy.

BDM
Paraphrase This Document
Need a fresh take? Get an instant paraphrase of this document with our AI Paraphraser
Table of Contents
INTRODUCTION...........................................................................................................................3
TASK 1............................................................................................................................................3
1.1: Primary and secondary sources of data collection..........................................................3
1.2: Survey methodologies and designing of sampling framework.......................................4
1.3: Designing of Questionnaire.............................................................................................5
TASK 2............................................................................................................................................7
2.1: Creation of information for decision making with the help of representative values.....7
2.2: Draw valid conclusions from the information collected from research........................11
2.3: Evaluating measure of dispersion..................................................................................12
2.4: Advantages of using quartile, percentile and coefficient correlation............................13
TASK 3..........................................................................................................................................13
3.1: Formulation of charts and graphs to interpret information...........................................13
3.2: Formulation of Trend line.............................................................................................19
3.3: Covered in PPT.............................................................................................................20
3.4: Preparation of Formal report.........................................................................................20
TASK 4..........................................................................................................................................21
4.1: Application of information processing tools for decision-making................................21
4.2: Preparation of project plan to determine Critical path..................................................22
4.3: Application of financial tools for improvement of decision making............................23
CONCLUSION..............................................................................................................................23
REFERENCES..............................................................................................................................25
INTRODUCTION
To improve decision making power manager of organisation is need to collect the
information from the market and respondents. It provides the opportunity to draw important
conclusions which contributes in attaining sustainability in their operations. There are many
statistical tools like mean, median and mode which helps to attain results in quantitative terms.
The best method which helps to collect true and reliable information is primary method. It
provides the opportunity to grab the real views of respondents. Balti palace is restaurant which
provides their services in UK (Cosgrove and Rijsberman, 2014).
In the present report explain about, use of primary and secondary sources to attain the
view of respondents, formulation of research framework, designing of questionnaire, draw
important conclusions with the help of statistical tools and measures of dispersion and
application of quartiles, percentiles and correlation coefficient to interpret information. Also,
formulation of graphs using spreadsheets, formulation of trend lines to forecast business
information and application of information processing and financial tools to improve decision-
making.
TASK 1
1.1: Primary and secondary sources of data collection
The main objective of Balti palace is attain sustainability in their business operations and
open new branch of their restaurant in London. Large number of cuisines are provided like
Italian, Thai etc. which helps in attraction of the large number of customers and improves their
sales and net profit. Research is the important technique which helps to check the viability of
their growth plan through ascertaining the views of respondents. This includes the application of
two methods like primary and secondary source of data collection.
Primary source
The information which is gathered with the use of this method is unbiased because it
directly received from respondents. So, there is less chance of manipulation. All the information
which is collected is related to research topic. It means reliable and accurate which is most
appropriate to draw important conclusions. The different aspects which are included in primary
sources are historical and legal documents, statistical data, speeches etc. The different methods
which are considered under this are Questionnaire, survey, online etc.
⊘ This is a preview!⊘
Do you want full access?
Subscribe today to unlock all pages.
Trusted by 1+ million students worldwide
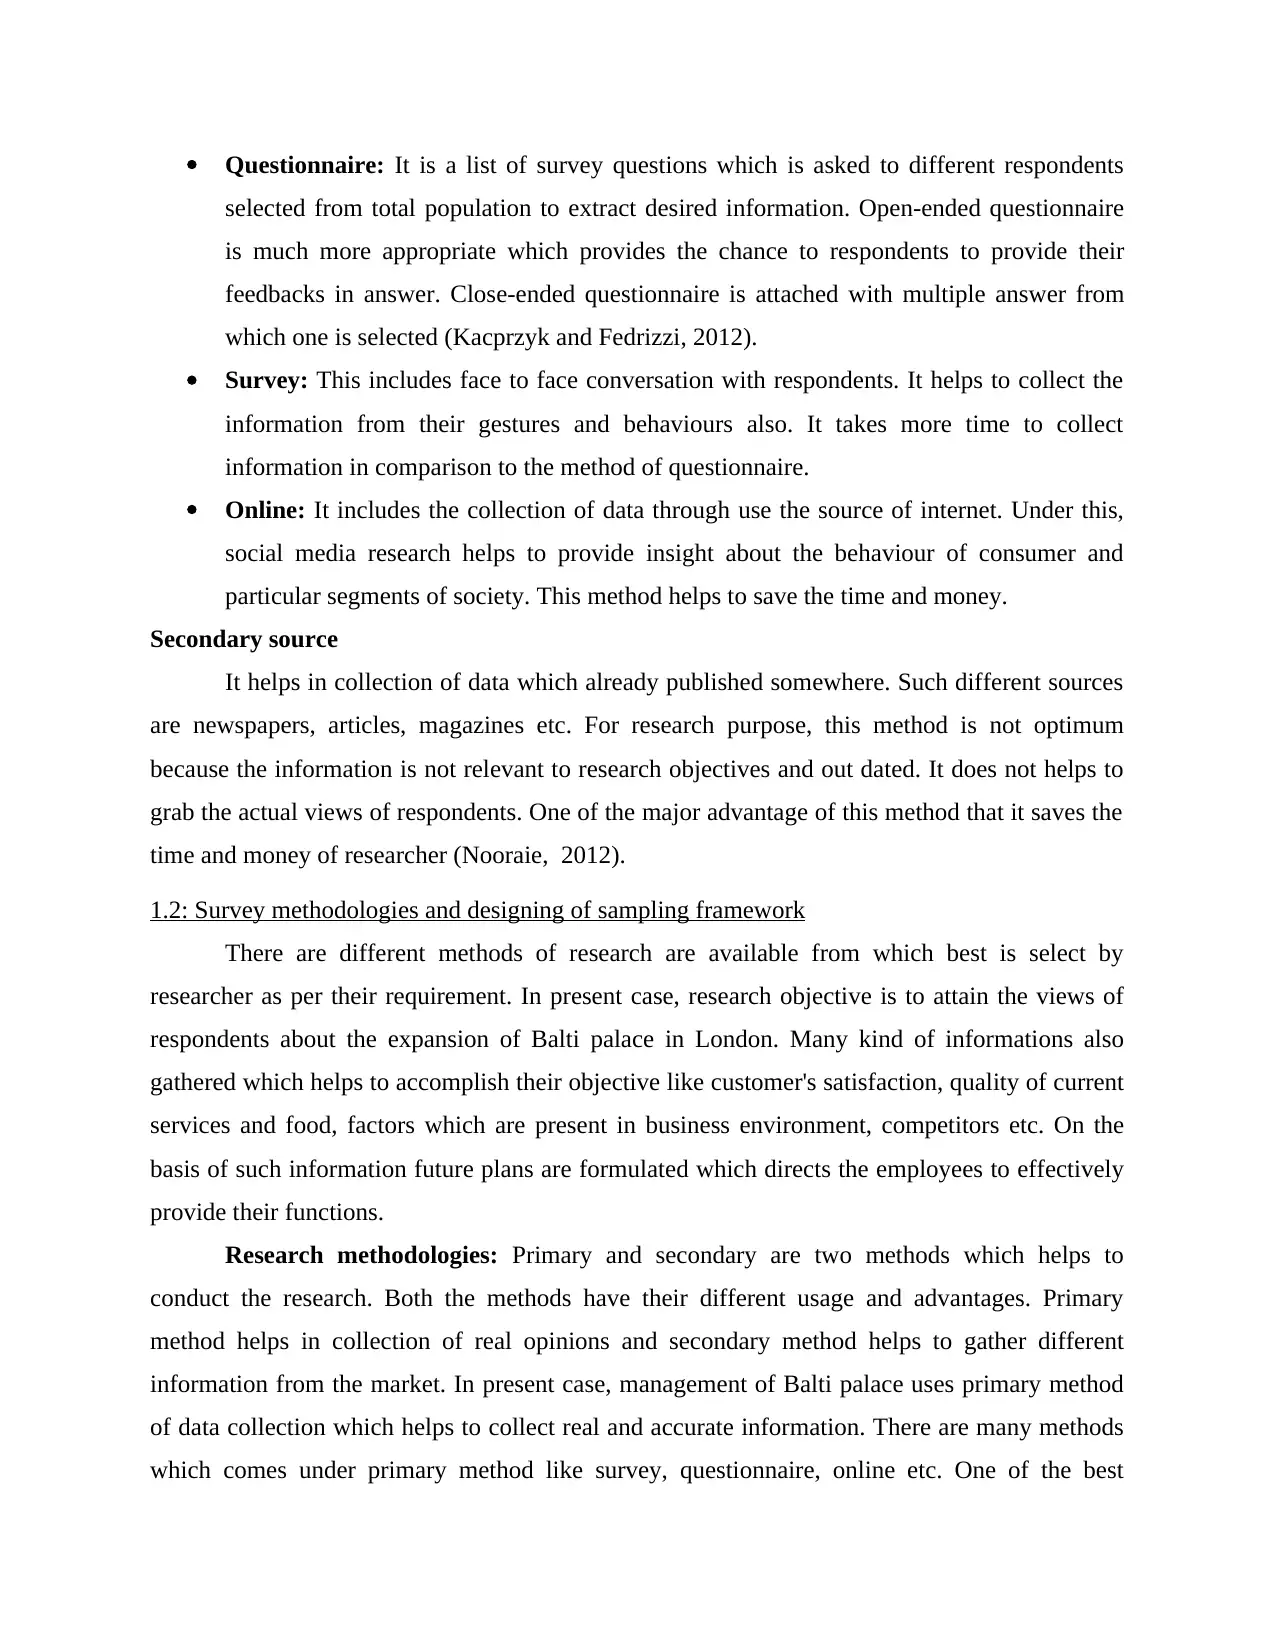
Questionnaire: It is a list of survey questions which is asked to different respondents
selected from total population to extract desired information. Open-ended questionnaire
is much more appropriate which provides the chance to respondents to provide their
feedbacks in answer. Close-ended questionnaire is attached with multiple answer from
which one is selected (Kacprzyk and Fedrizzi, 2012).
Survey: This includes face to face conversation with respondents. It helps to collect the
information from their gestures and behaviours also. It takes more time to collect
information in comparison to the method of questionnaire.
Online: It includes the collection of data through use the source of internet. Under this,
social media research helps to provide insight about the behaviour of consumer and
particular segments of society. This method helps to save the time and money.
Secondary source
It helps in collection of data which already published somewhere. Such different sources
are newspapers, articles, magazines etc. For research purpose, this method is not optimum
because the information is not relevant to research objectives and out dated. It does not helps to
grab the actual views of respondents. One of the major advantage of this method that it saves the
time and money of researcher (Nooraie, 2012).
1.2: Survey methodologies and designing of sampling framework
There are different methods of research are available from which best is select by
researcher as per their requirement. In present case, research objective is to attain the views of
respondents about the expansion of Balti palace in London. Many kind of informations also
gathered which helps to accomplish their objective like customer's satisfaction, quality of current
services and food, factors which are present in business environment, competitors etc. On the
basis of such information future plans are formulated which directs the employees to effectively
provide their functions.
Research methodologies: Primary and secondary are two methods which helps to
conduct the research. Both the methods have their different usage and advantages. Primary
method helps in collection of real opinions and secondary method helps to gather different
information from the market. In present case, management of Balti palace uses primary method
of data collection which helps to collect real and accurate information. There are many methods
which comes under primary method like survey, questionnaire, online etc. One of the best
Paraphrase This Document
Need a fresh take? Get an instant paraphrase of this document with our AI Paraphraser
method which is used is questionnaire. Close-ended questionnaire is formulate which contains 10
different questions asked from respondents.
Sample framework: It is the process outlining of research work which helps to carry their
activities in more appropriate manner. Under the process of designing framework need of
selection of respondents from total population is identifies to get the results in stipulated period
of time. The different methods which contributes in selection of respondents are cluster,
stratifies, random sampling etc. Researcher of Balti palace used random sampling method to
select 80 respondents (Pourshahid, Richards and Amyot, 2011).
The process of collection of information starts with the mailing of questionnaire to all 80
respondents which returned by them after selection of one option as answer. Such informations
are interpreted with the help of different statistical tools and method of measures of dispersion.
The questions covered such objectives:
Viability of move to open new branch in London
Quality of current services
Current position in market
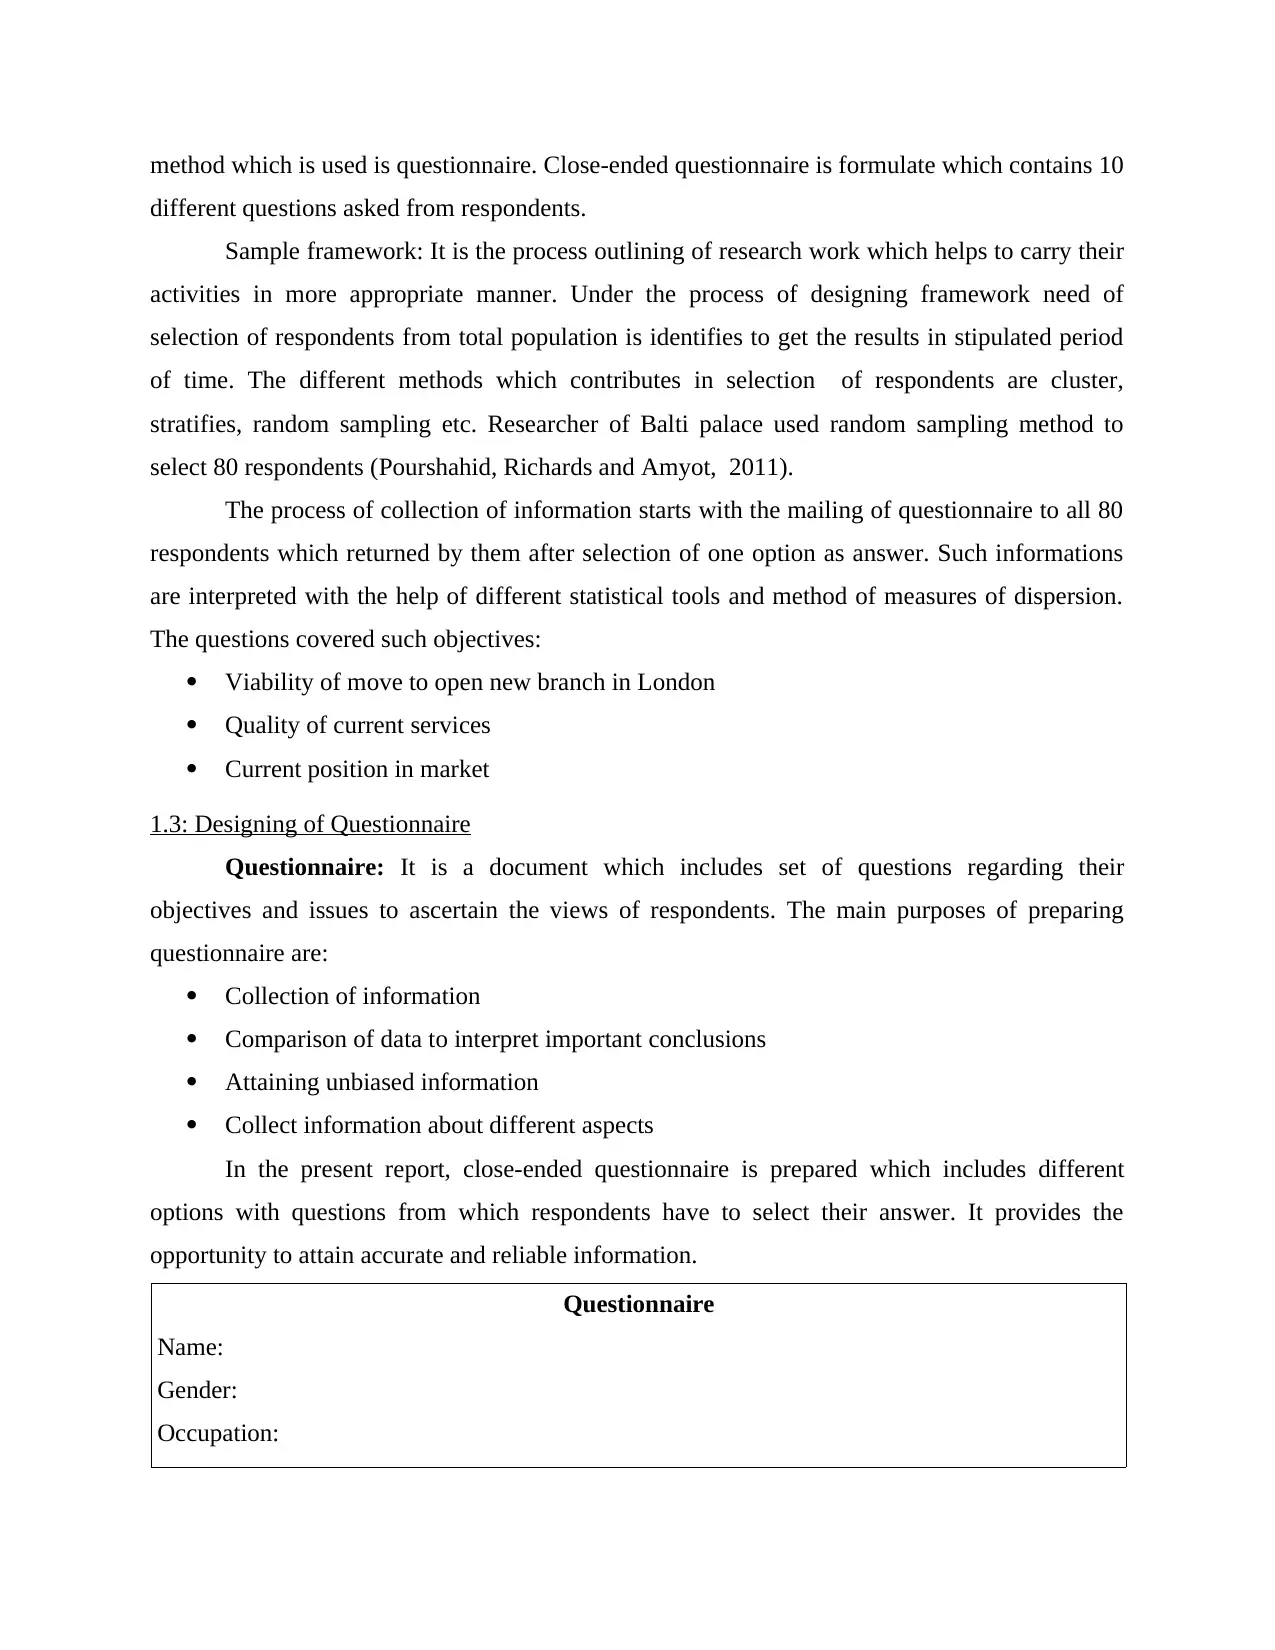
1.3: Designing of Questionnaire
Questionnaire: It is a document which includes set of questions regarding their
objectives and issues to ascertain the views of respondents. The main purposes of preparing
questionnaire are:
Collection of information
Comparison of data to interpret important conclusions
Attaining unbiased information
Collect information about different aspects
In the present report, close-ended questionnaire is prepared which includes different
options with questions from which respondents have to select their answer. It provides the
opportunity to attain accurate and reliable information.
Questionnaire
Name:
Gender:
Occupation:
different questions asked from respondents.
Sample framework: It is the process outlining of research work which helps to carry their
activities in more appropriate manner. Under the process of designing framework need of
selection of respondents from total population is identifies to get the results in stipulated period
of time. The different methods which contributes in selection of respondents are cluster,
stratifies, random sampling etc. Researcher of Balti palace used random sampling method to
select 80 respondents (Pourshahid, Richards and Amyot, 2011).
The process of collection of information starts with the mailing of questionnaire to all 80
respondents which returned by them after selection of one option as answer. Such informations
are interpreted with the help of different statistical tools and method of measures of dispersion.
The questions covered such objectives:
Viability of move to open new branch in London
Quality of current services
Current position in market
1.3: Designing of Questionnaire
Questionnaire: It is a document which includes set of questions regarding their
objectives and issues to ascertain the views of respondents. The main purposes of preparing
questionnaire are:
Collection of information
Comparison of data to interpret important conclusions
Attaining unbiased information
Collect information about different aspects
In the present report, close-ended questionnaire is prepared which includes different
options with questions from which respondents have to select their answer. It provides the
opportunity to attain accurate and reliable information.
Questionnaire
Name:
Gender:
Occupation:
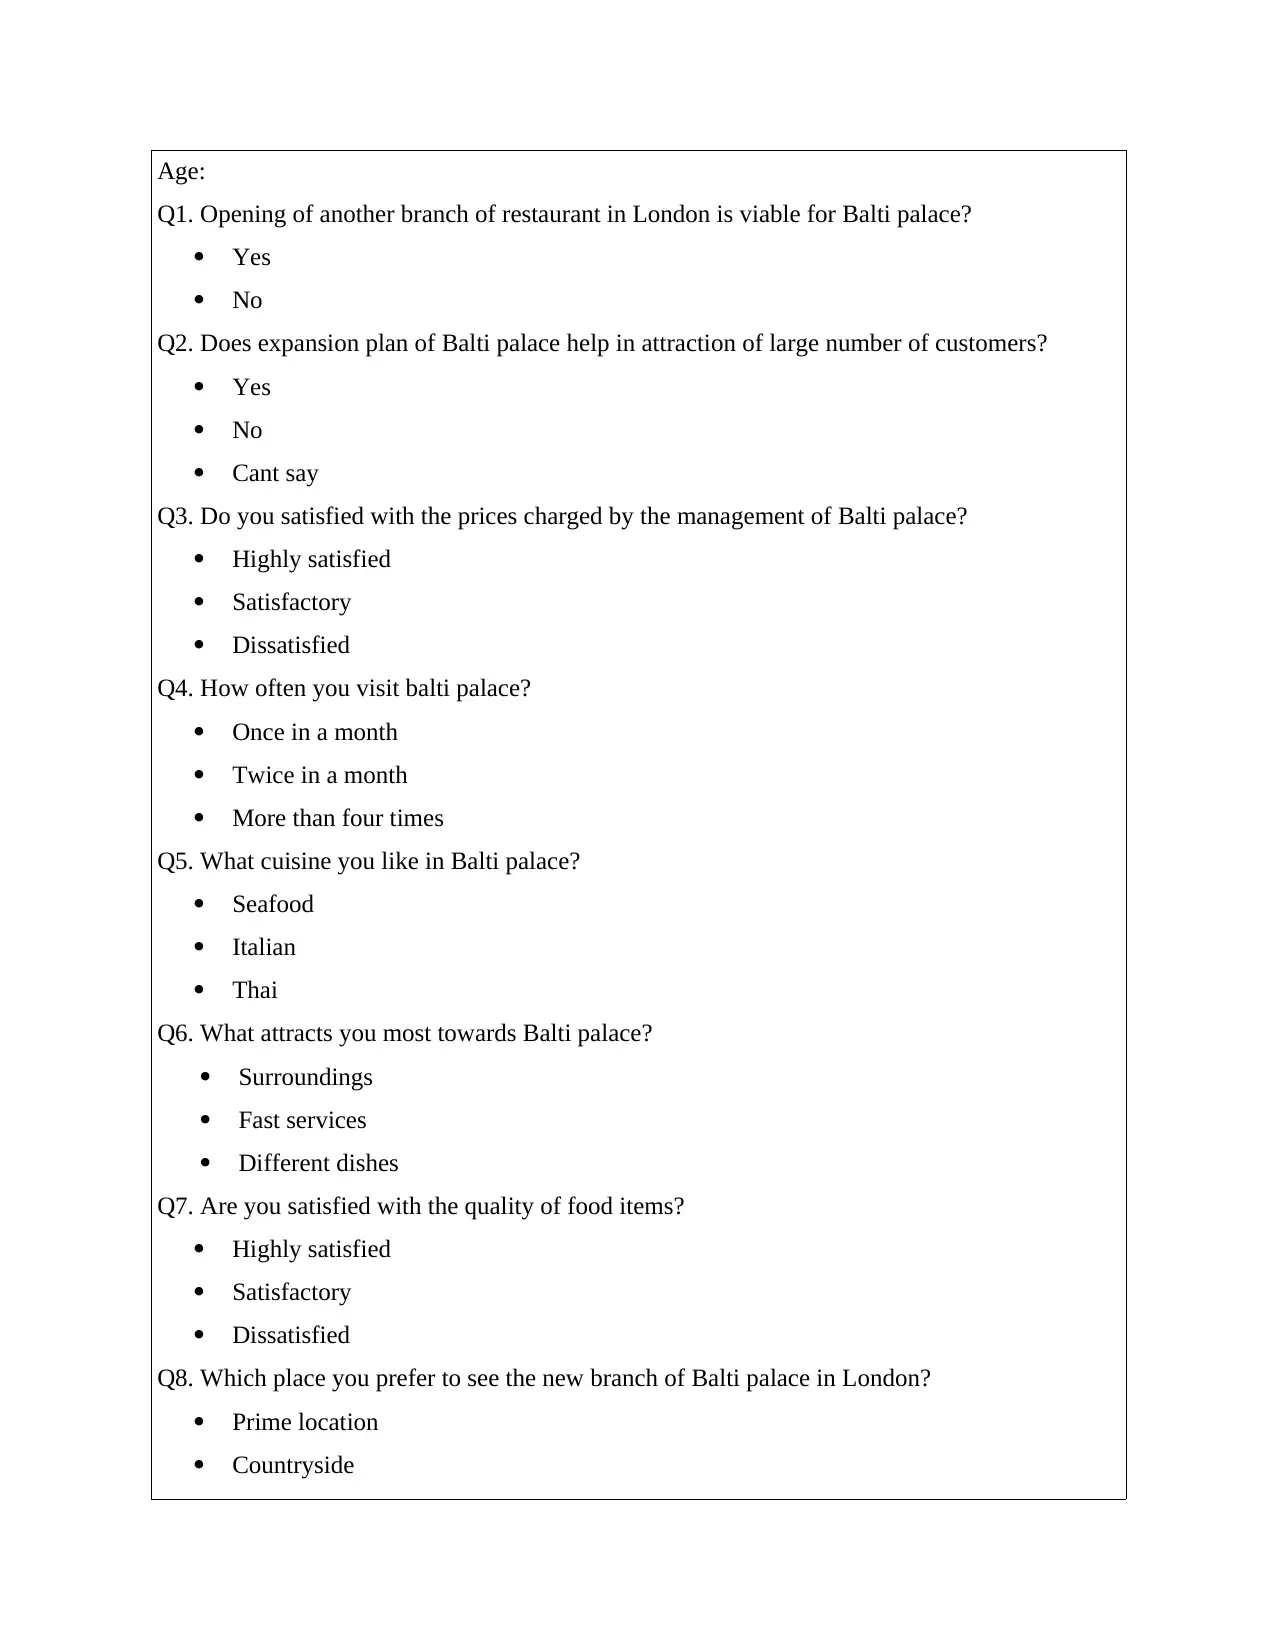
Age:
Q1. Opening of another branch of restaurant in London is viable for Balti palace?
Yes
No
Q2. Does expansion plan of Balti palace help in attraction of large number of customers?
Yes
No
Cant say
Q3. Do you satisfied with the prices charged by the management of Balti palace?
Highly satisfied
Satisfactory
Dissatisfied
Q4. How often you visit balti palace?
Once in a month
Twice in a month
More than four times
Q5. What cuisine you like in Balti palace?
Seafood
Italian
Thai
Q6. What attracts you most towards Balti palace?
Surroundings
Fast services
Different dishes
Q7. Are you satisfied with the quality of food items?
Highly satisfied
Satisfactory
Dissatisfied
Q8. Which place you prefer to see the new branch of Balti palace in London?
Prime location
Countryside
⊘ This is a preview!⊘
Do you want full access?
Subscribe today to unlock all pages.
Trusted by 1+ million students worldwide
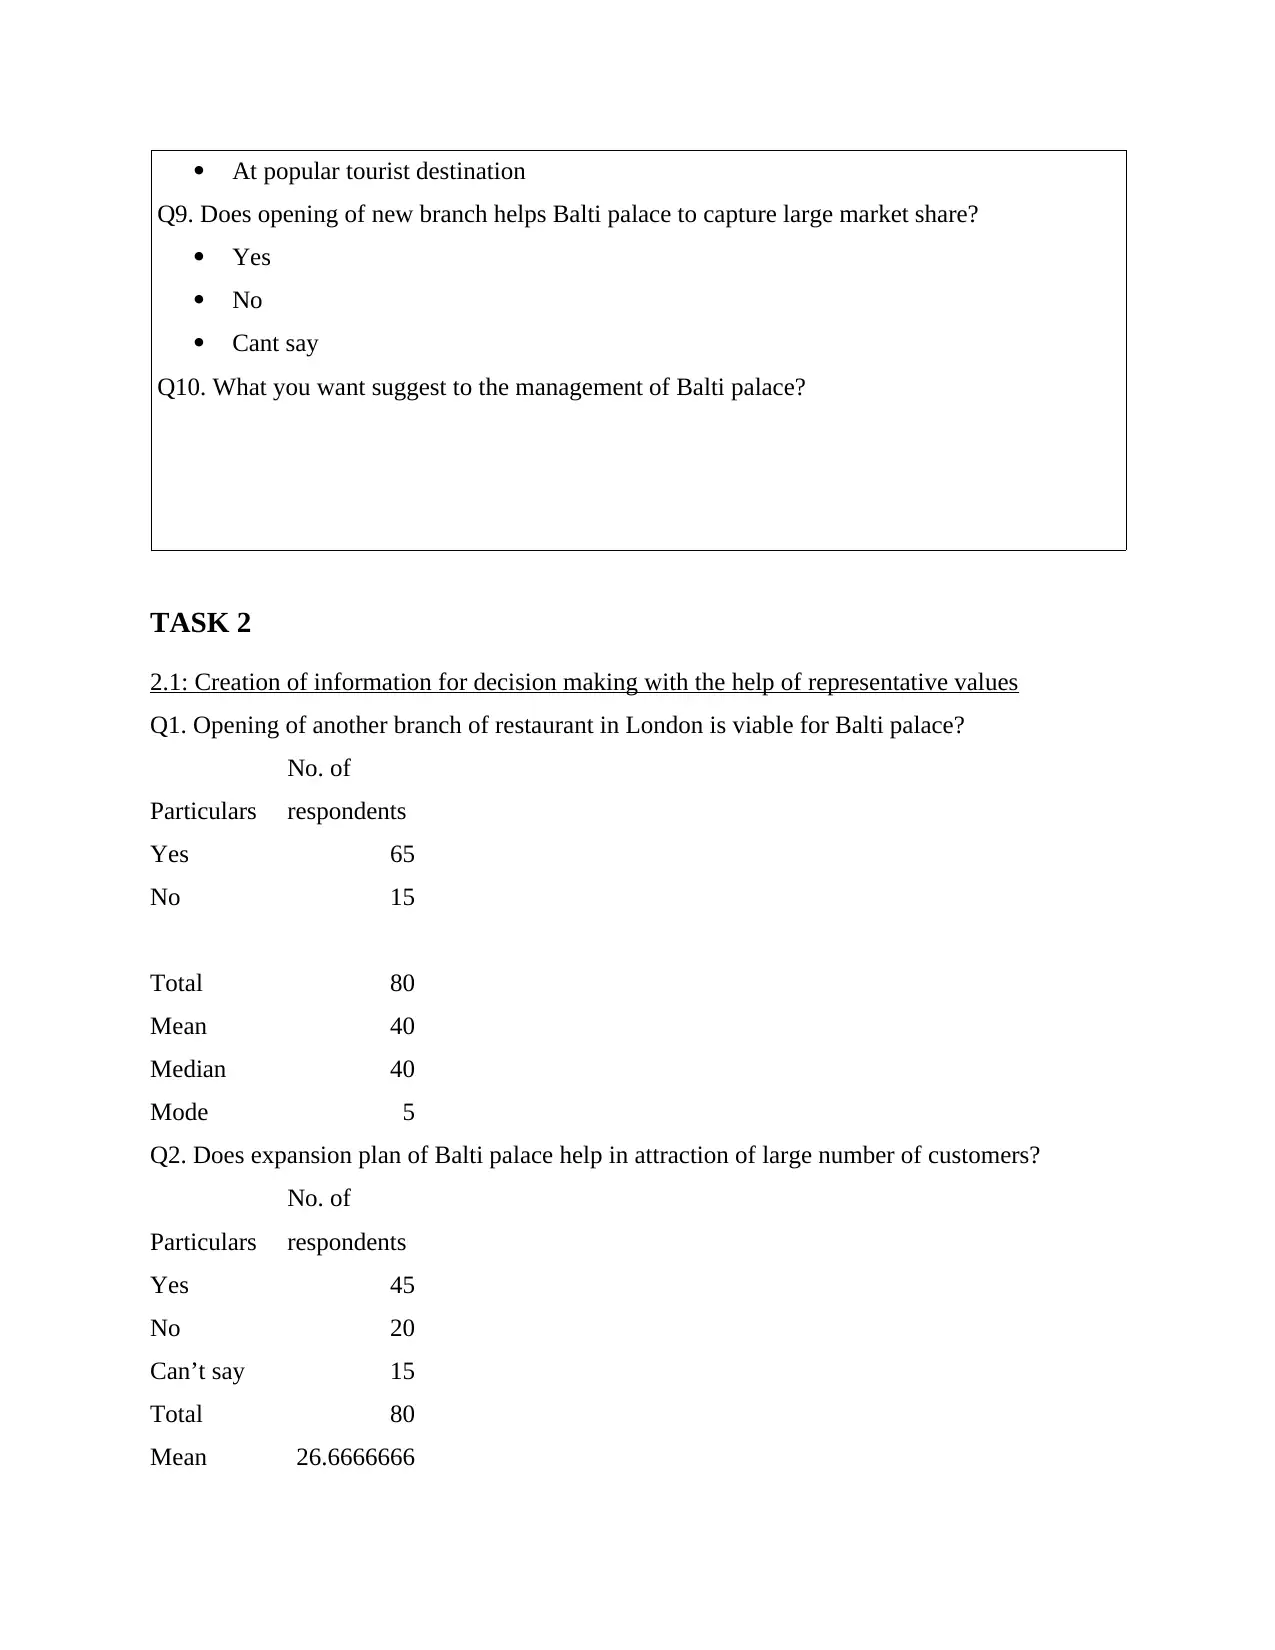
At popular tourist destination
Q9. Does opening of new branch helps Balti palace to capture large market share?
Yes
No
Cant say
Q10. What you want suggest to the management of Balti palace?
TASK 2
2.1: Creation of information for decision making with the help of representative values
Q1. Opening of another branch of restaurant in London is viable for Balti palace?
Particulars
No. of
respondents
Yes 65
No 15
Total 80
Mean 40
Median 40
Mode 5
Q2. Does expansion plan of Balti palace help in attraction of large number of customers?
Particulars
No. of
respondents
Yes 45
No 20
Can’t say 15
Total 80
Mean 26.6666666
Paraphrase This Document
Need a fresh take? Get an instant paraphrase of this document with our AI Paraphraser
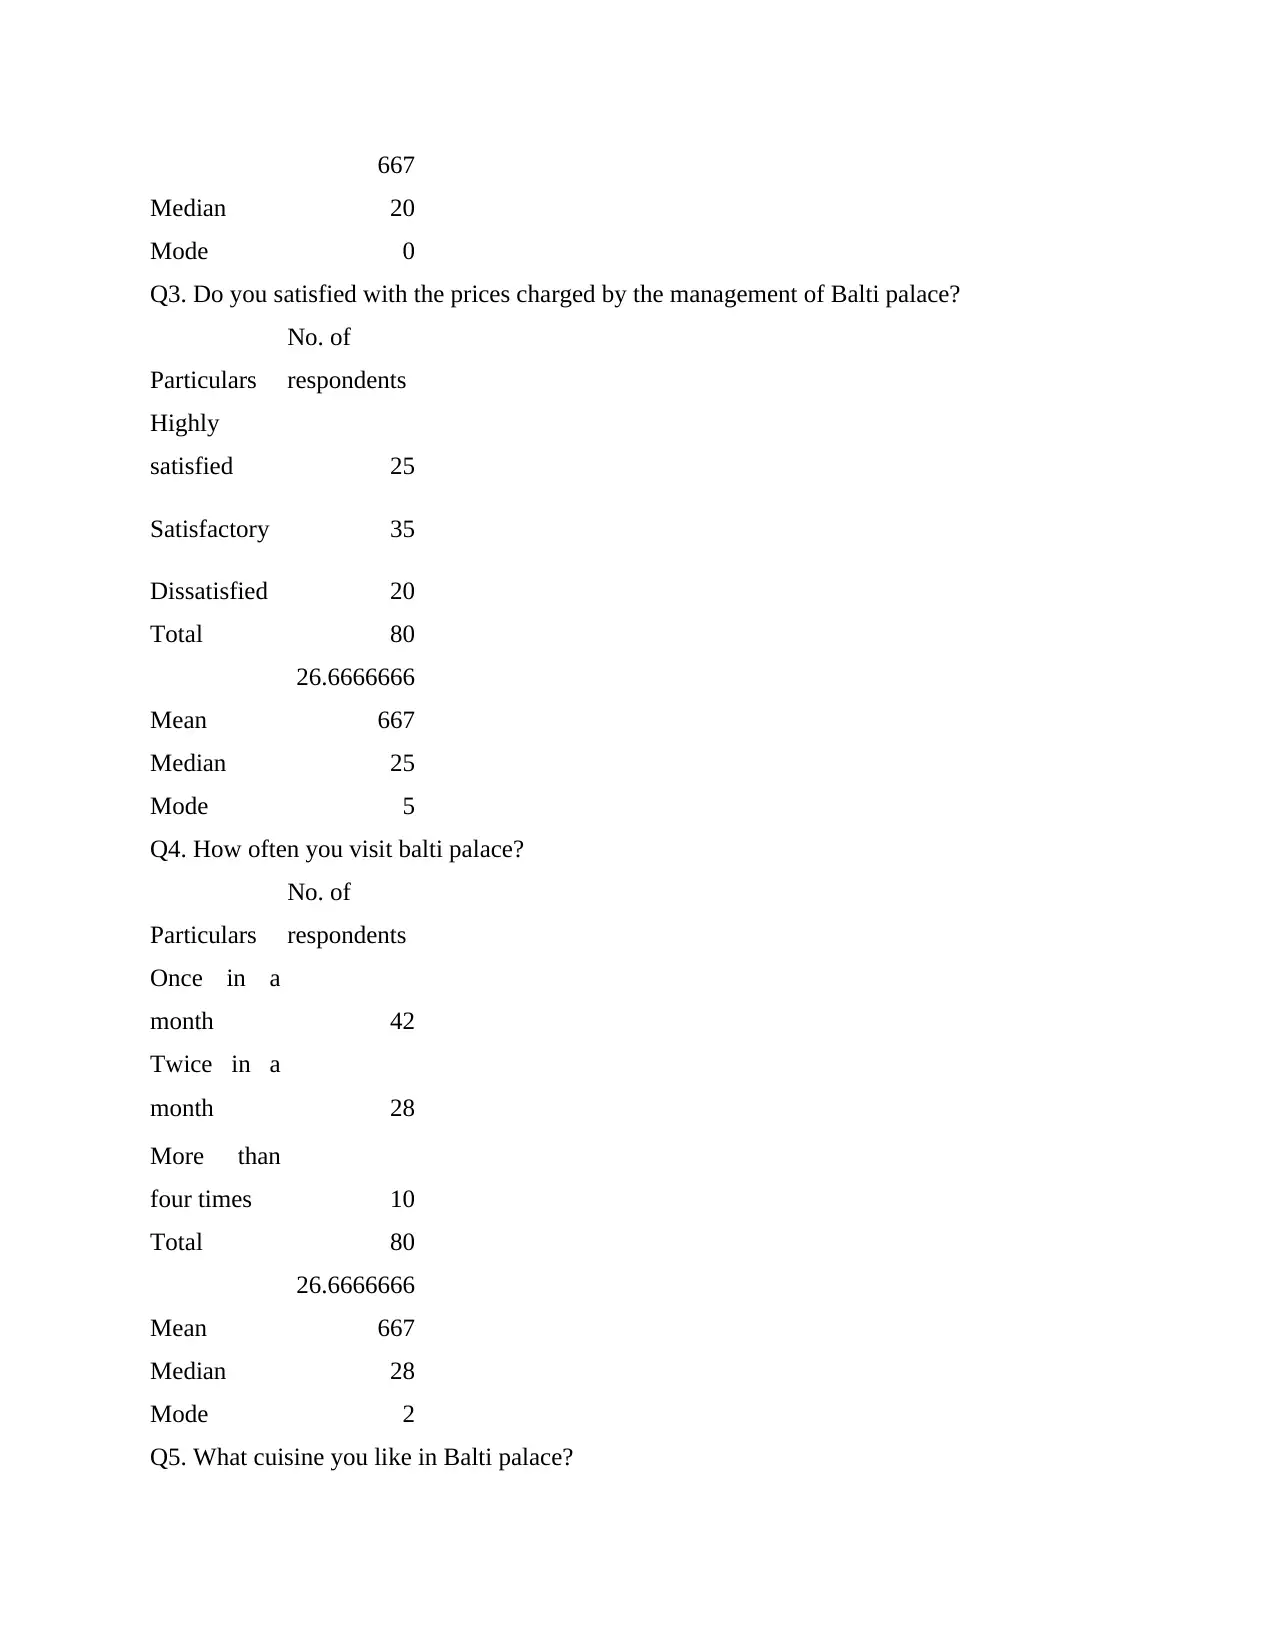
667
Median 20
Mode 0
Q3. Do you satisfied with the prices charged by the management of Balti palace?
Particulars
No. of
respondents
Highly
satisfied 25
Satisfactory 35
Dissatisfied 20
Total 80
Mean
26.6666666
667
Median 25
Mode 5
Q4. How often you visit balti palace?
Particulars
No. of
respondents
Once in a
month 42
Twice in a
month 28
More than
four times 10
Total 80
Mean
26.6666666
667
Median 28
Mode 2
Q5. What cuisine you like in Balti palace?
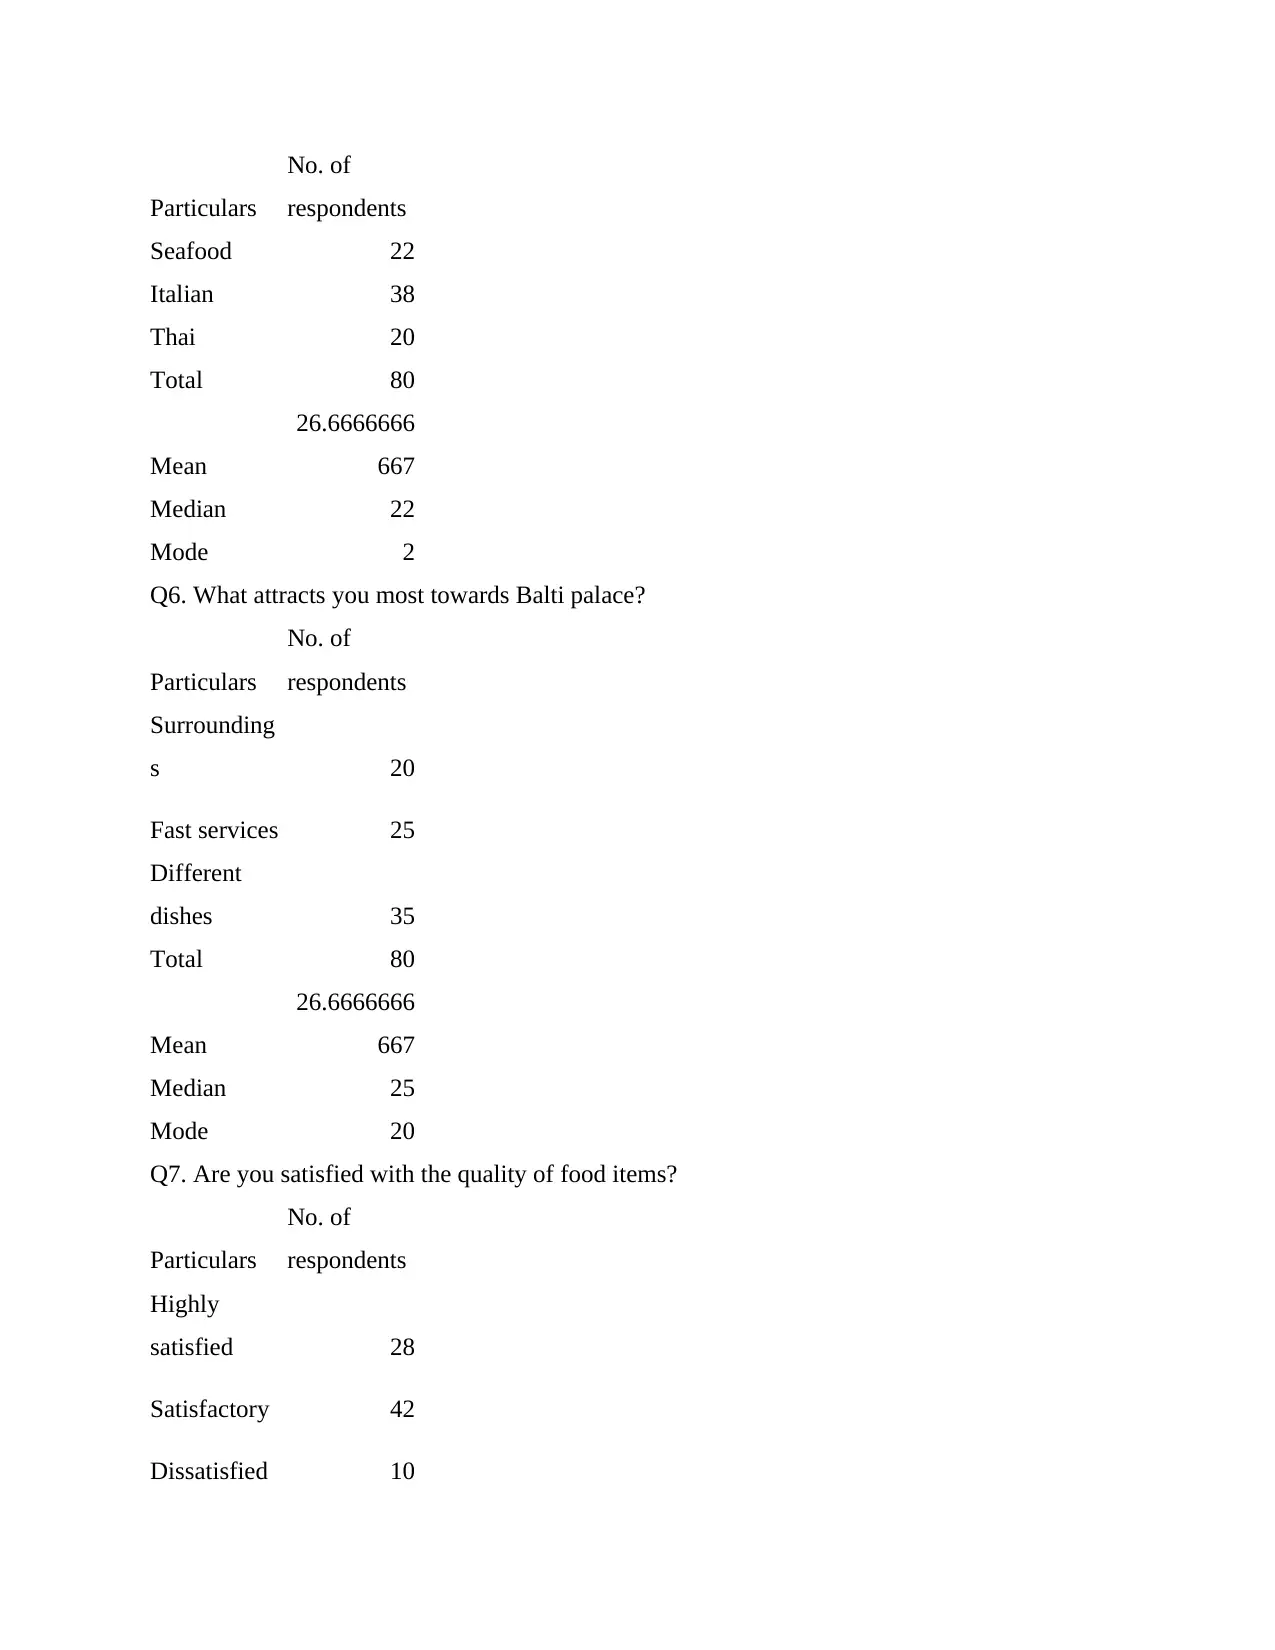
Particulars
No. of
respondents
Seafood 22
Italian 38
Thai 20
Total 80
Mean
26.6666666
667
Median 22
Mode 2
Q6. What attracts you most towards Balti palace?
Particulars
No. of
respondents
Surrounding
s 20
Fast services 25
Different
dishes 35
Total 80
Mean
26.6666666
667
Median 25
Mode 20
Q7. Are you satisfied with the quality of food items?
Particulars
No. of
respondents
Highly
satisfied 28
Satisfactory 42
Dissatisfied 10
No. of
respondents
Seafood 22
Italian 38
Thai 20
Total 80
Mean
26.6666666
667
Median 22
Mode 2
Q6. What attracts you most towards Balti palace?
Particulars
No. of
respondents
Surrounding
s 20
Fast services 25
Different
dishes 35
Total 80
Mean
26.6666666
667
Median 25
Mode 20
Q7. Are you satisfied with the quality of food items?
Particulars
No. of
respondents
Highly
satisfied 28
Satisfactory 42
Dissatisfied 10
⊘ This is a preview!⊘
Do you want full access?
Subscribe today to unlock all pages.
Trusted by 1+ million students worldwide
Total 80
Mean
26.6666666
667
Median 28
Mode 8
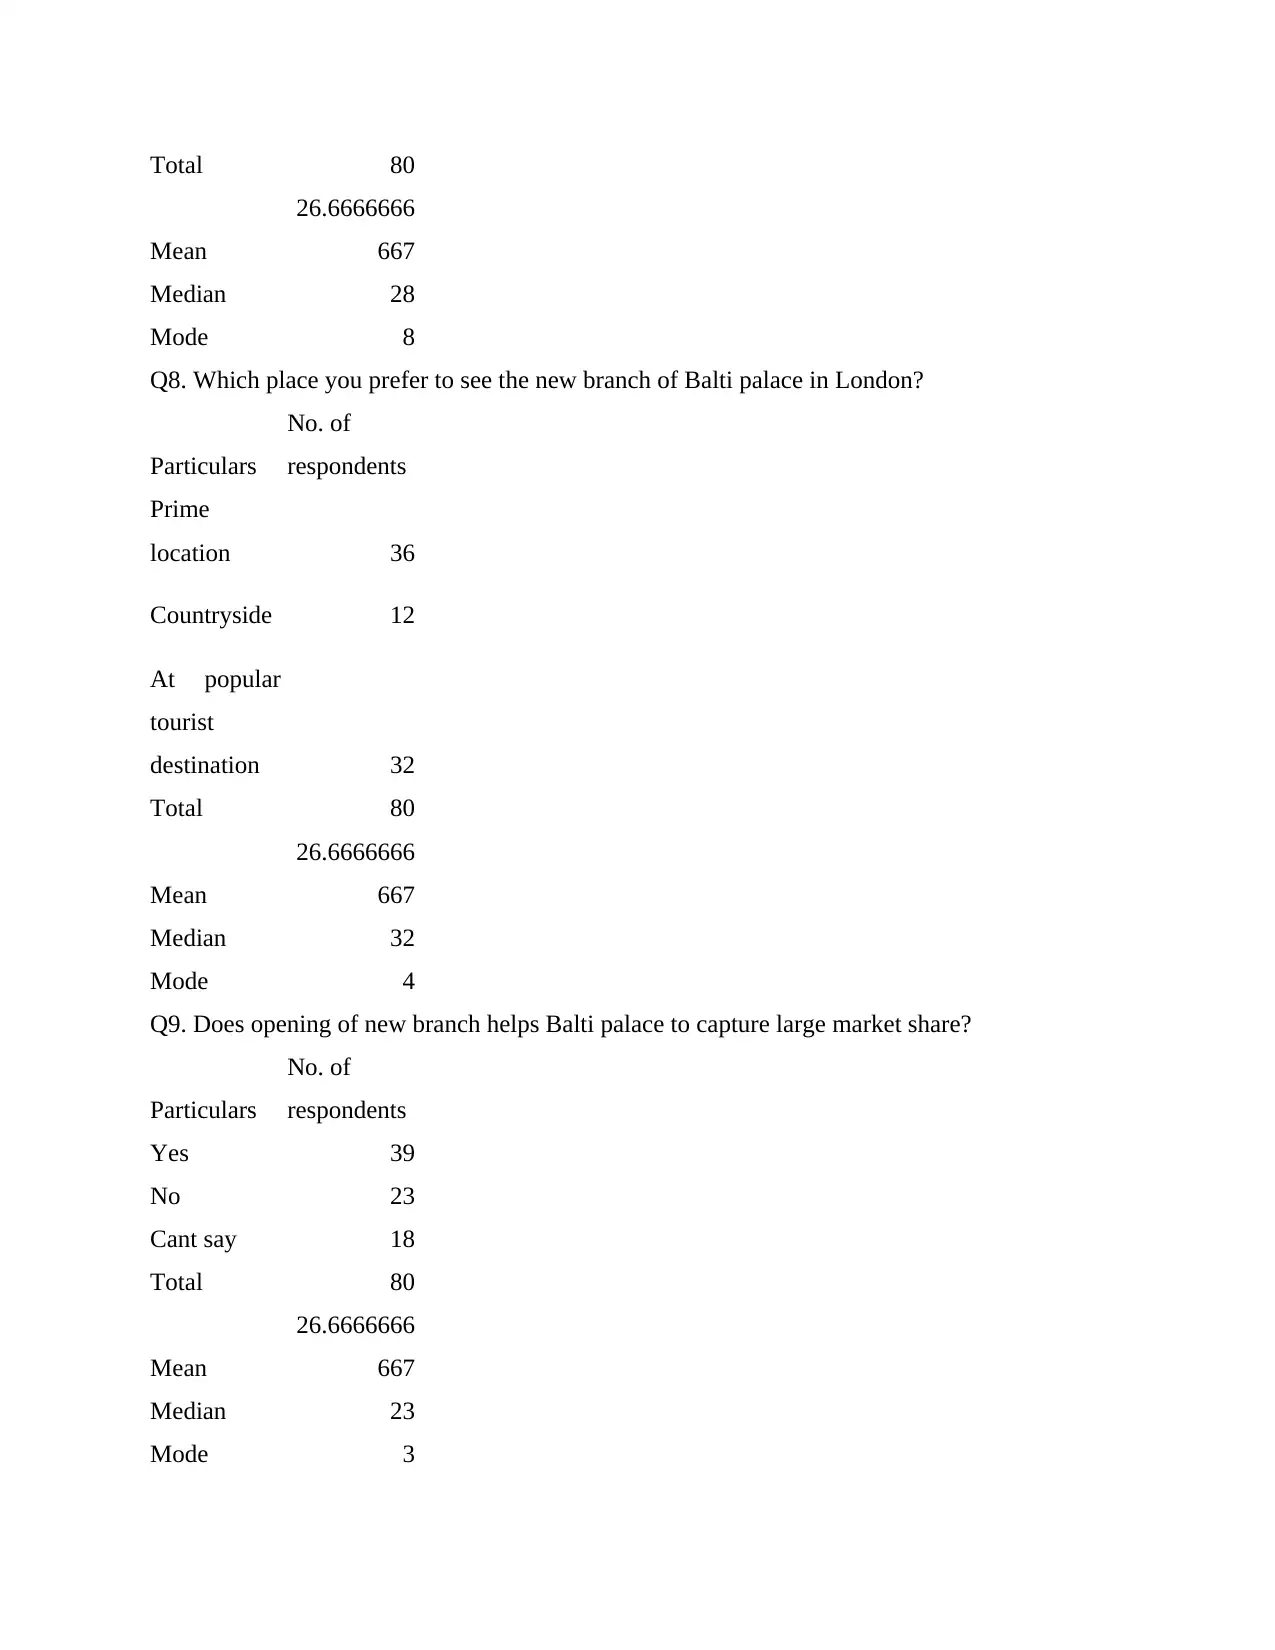
Q8. Which place you prefer to see the new branch of Balti palace in London?
Particulars
No. of
respondents
Prime
location 36
Countryside 12
At popular
tourist
destination 32
Total 80
Mean
26.6666666
667
Median 32
Mode 4
Q9. Does opening of new branch helps Balti palace to capture large market share?
Particulars
No. of
respondents
Yes 39
No 23
Cant say 18
Total 80
Mean
26.6666666
667
Median 23
Mode 3
Mean
26.6666666
667
Median 28
Mode 8
Q8. Which place you prefer to see the new branch of Balti palace in London?
Particulars
No. of
respondents
Prime
location 36
Countryside 12
At popular
tourist
destination 32
Total 80
Mean
26.6666666
667
Median 32
Mode 4
Q9. Does opening of new branch helps Balti palace to capture large market share?
Particulars
No. of
respondents
Yes 39
No 23
Cant say 18
Total 80
Mean
26.6666666
667
Median 23
Mode 3
Paraphrase This Document
Need a fresh take? Get an instant paraphrase of this document with our AI Paraphraser
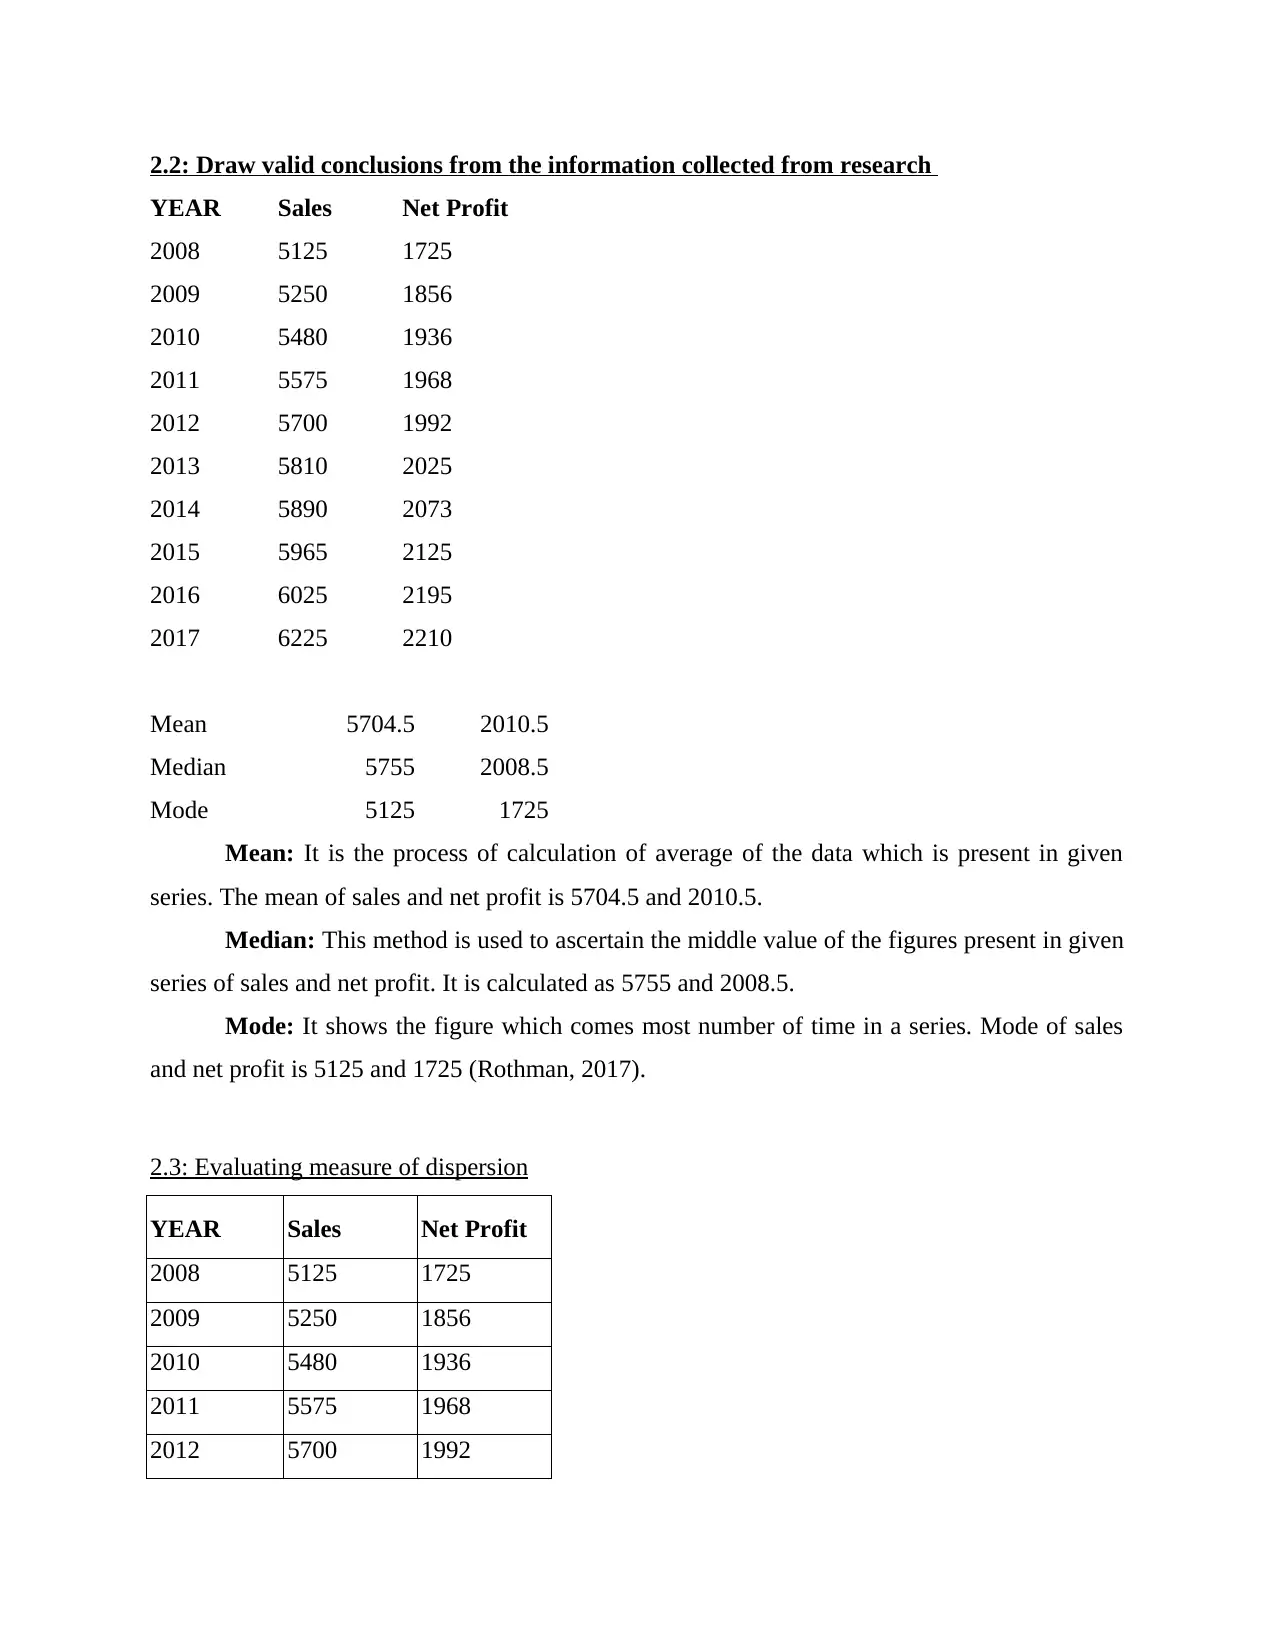
2.2: Draw valid conclusions from the information collected from research
YEAR Sales Net Profit
2008 5125 1725
2009 5250 1856
2010 5480 1936
2011 5575 1968
2012 5700 1992
2013 5810 2025
2014 5890 2073
2015 5965 2125
2016 6025 2195
2017 6225 2210
Mean 5704.5 2010.5
Median 5755 2008.5
Mode 5125 1725
Mean: It is the process of calculation of average of the data which is present in given
series. The mean of sales and net profit is 5704.5 and 2010.5.
Median: This method is used to ascertain the middle value of the figures present in given
series of sales and net profit. It is calculated as 5755 and 2008.5.
Mode: It shows the figure which comes most number of time in a series. Mode of sales
and net profit is 5125 and 1725 (Rothman, 2017).
2.3: Evaluating measure of dispersion
YEAR Sales Net Profit
2008 5125 1725
2009 5250 1856
2010 5480 1936
2011 5575 1968
2012 5700 1992
YEAR Sales Net Profit
2008 5125 1725
2009 5250 1856
2010 5480 1936
2011 5575 1968
2012 5700 1992
2013 5810 2025
2014 5890 2073
2015 5965 2125
2016 6025 2195
2017 6225 2210
Mean 5704.5 2010.5
Median 5755 2008.5
Mode 5125 1725
Mean: It is the process of calculation of average of the data which is present in given
series. The mean of sales and net profit is 5704.5 and 2010.5.
Median: This method is used to ascertain the middle value of the figures present in given
series of sales and net profit. It is calculated as 5755 and 2008.5.
Mode: It shows the figure which comes most number of time in a series. Mode of sales
and net profit is 5125 and 1725 (Rothman, 2017).
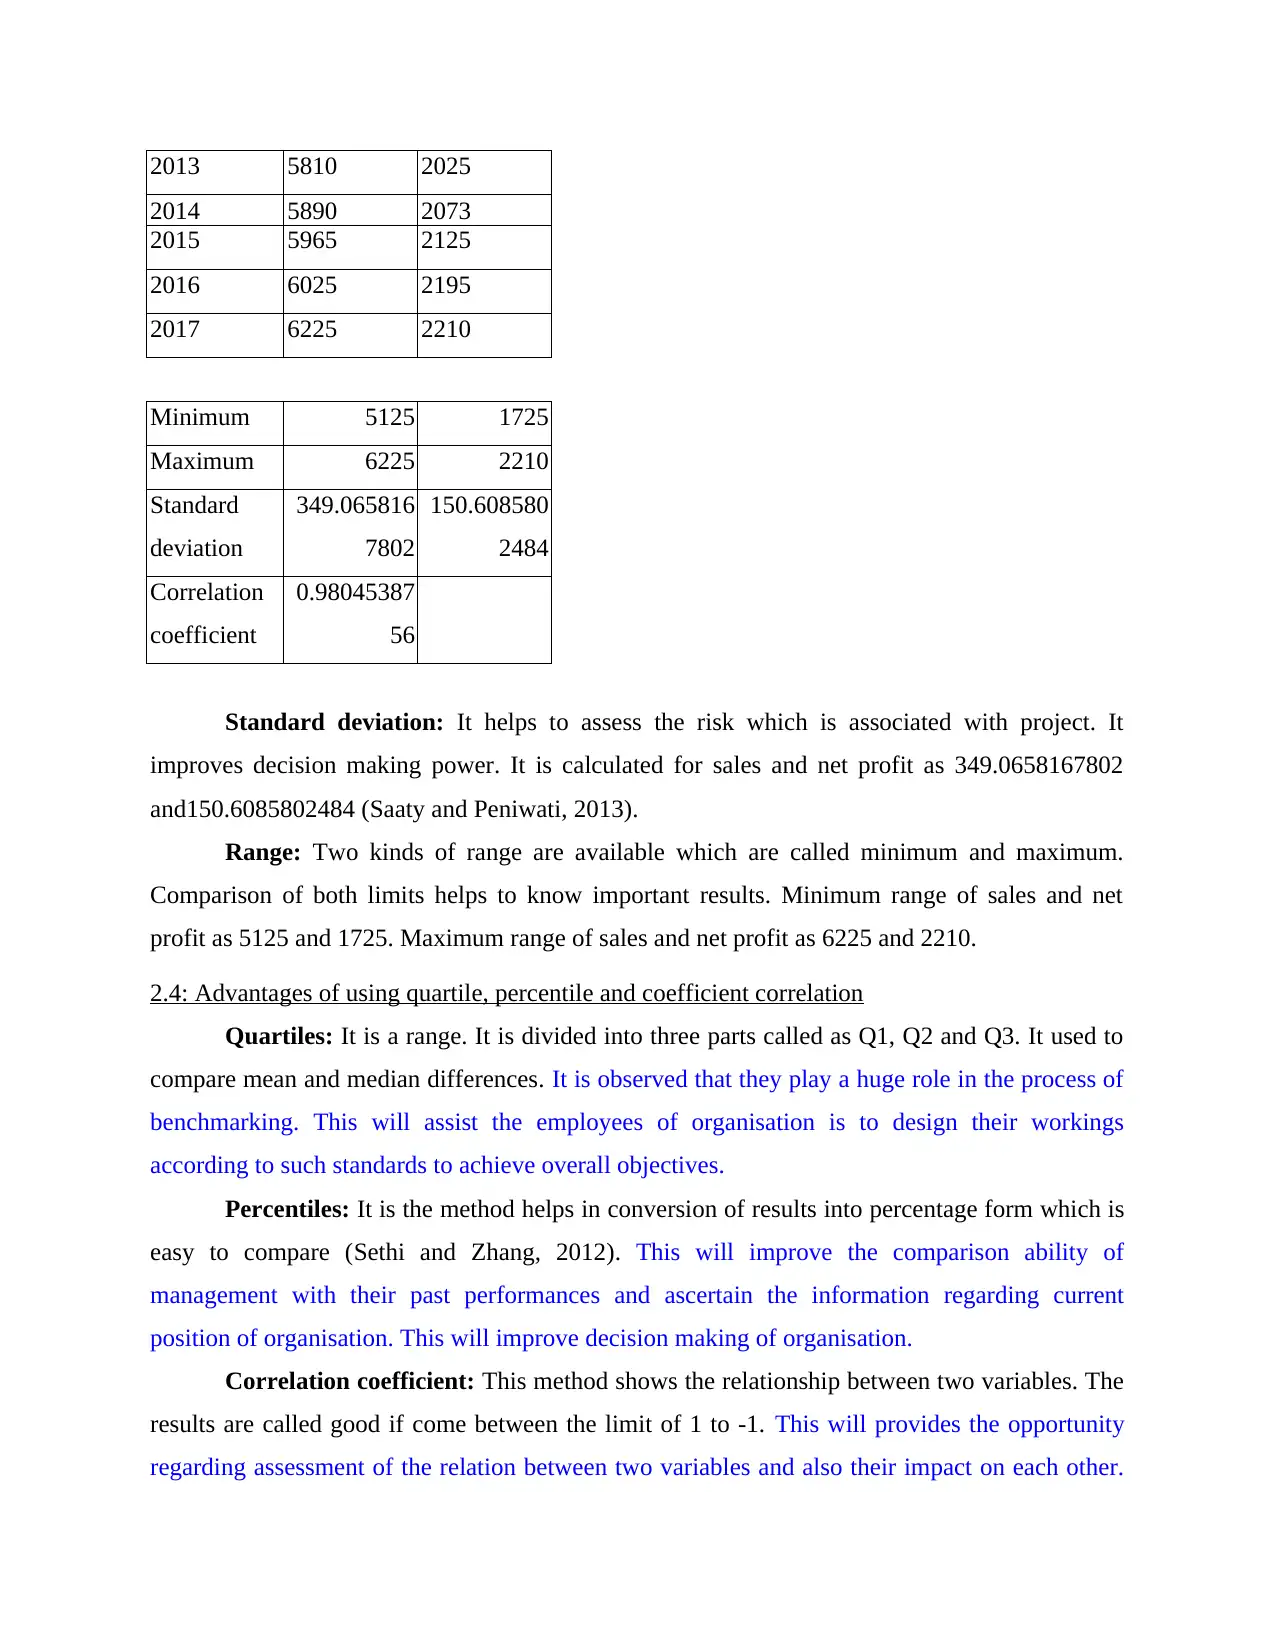
2.3: Evaluating measure of dispersion
YEAR Sales Net Profit
2008 5125 1725
2009 5250 1856
2010 5480 1936
2011 5575 1968
2012 5700 1992
2013 5810 2025
2014 5890 2073
2015 5965 2125
2016 6025 2195
2017 6225 2210
Minimum 5125 1725
Maximum 6225 2210
Standard
deviation
349.065816
7802
150.608580
2484
Correlation
coefficient
0.98045387
56
Standard deviation: It helps to assess the risk which is associated with project. It
improves decision making power. It is calculated for sales and net profit as 349.0658167802
and150.6085802484 (Saaty and Peniwati, 2013).
Range: Two kinds of range are available which are called minimum and maximum.
Comparison of both limits helps to know important results. Minimum range of sales and net
profit as 5125 and 1725. Maximum range of sales and net profit as 6225 and 2210.
2.4: Advantages of using quartile, percentile and coefficient correlation
Quartiles: It is a range. It is divided into three parts called as Q1, Q2 and Q3. It used to
compare mean and median differences. It is observed that they play a huge role in the process of
benchmarking. This will assist the employees of organisation is to design their workings
according to such standards to achieve overall objectives.
Percentiles: It is the method helps in conversion of results into percentage form which is
easy to compare (Sethi and Zhang, 2012). This will improve the comparison ability of
management with their past performances and ascertain the information regarding current
position of organisation. This will improve decision making of organisation.
Correlation coefficient: This method shows the relationship between two variables. The
results are called good if come between the limit of 1 to -1. This will provides the opportunity
regarding assessment of the relation between two variables and also their impact on each other.
⊘ This is a preview!⊘
Do you want full access?
Subscribe today to unlock all pages.
Trusted by 1+ million students worldwide
1 out of 22
Related Documents


Your All-in-One AI-Powered Toolkit for Academic Success.
+13062052269
info@desklib.com
Available 24*7 on WhatsApp / Email
![[object Object]](/_next/static/media/star-bottom.7253800d.svg)
Unlock your academic potential
Copyright © 2020–2026 A2Z Services. All Rights Reserved. Developed and managed by ZUCOL.