Business Decision Making: Balti Palace Restaurant Customer Analysis

Verified

Added on  2023/03/29

|13
|408
|66
Report
AI Summary
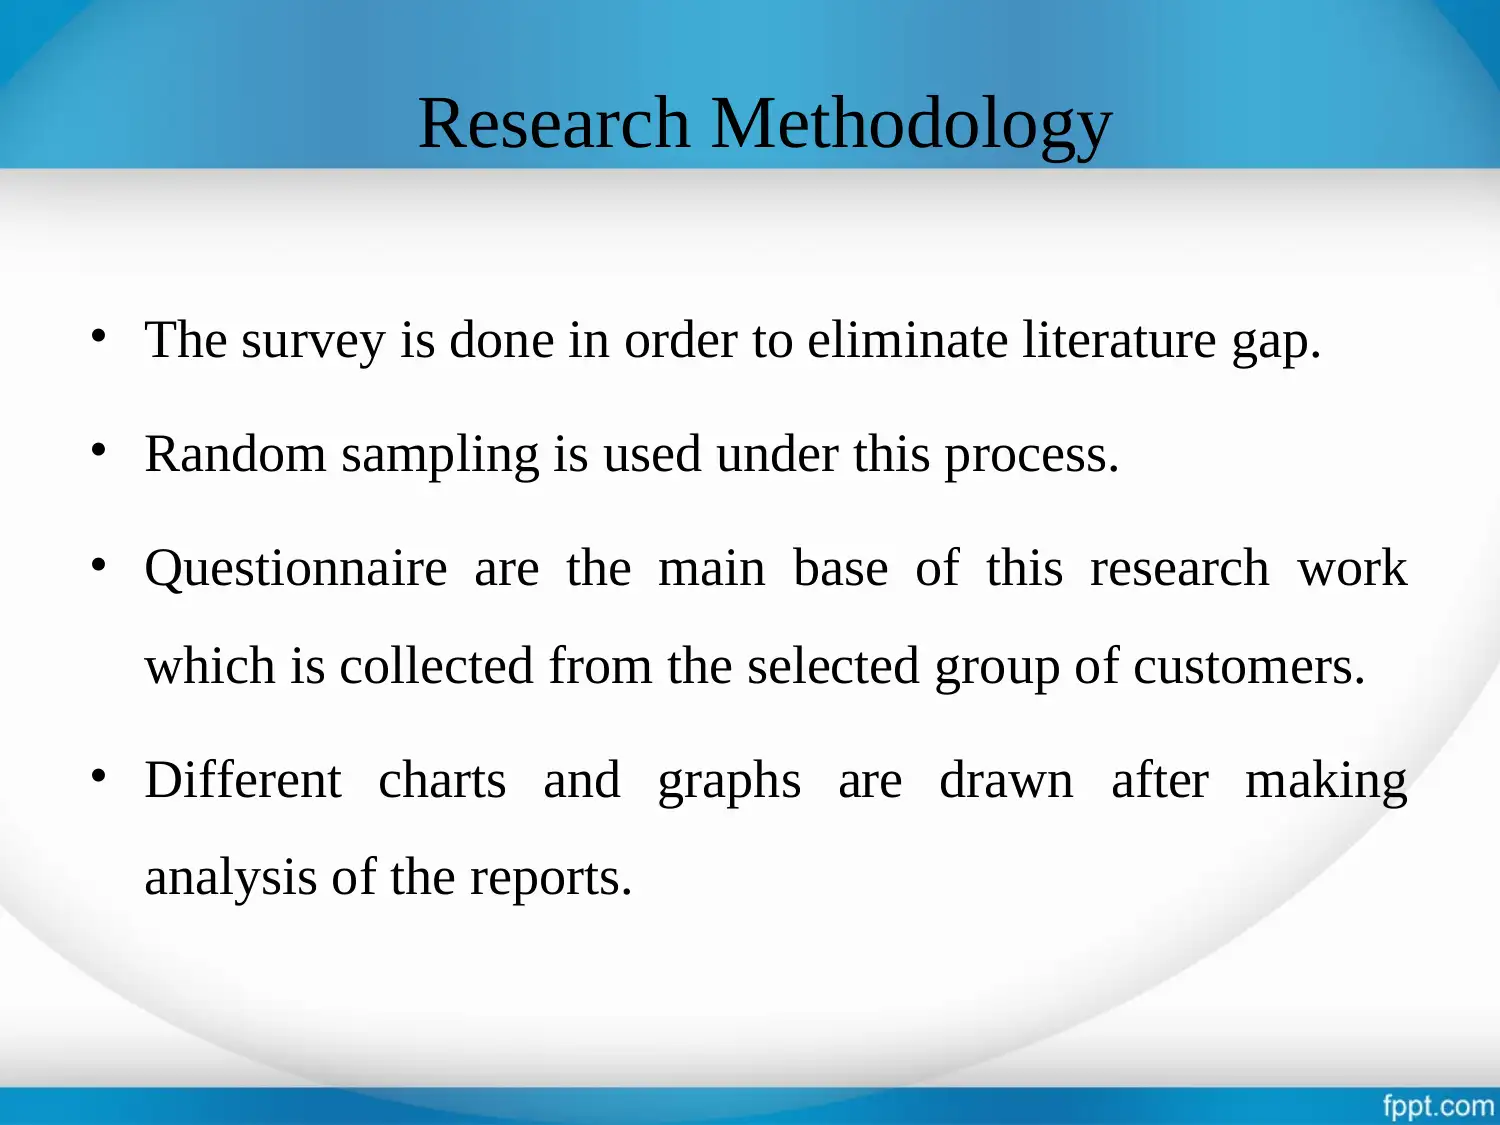
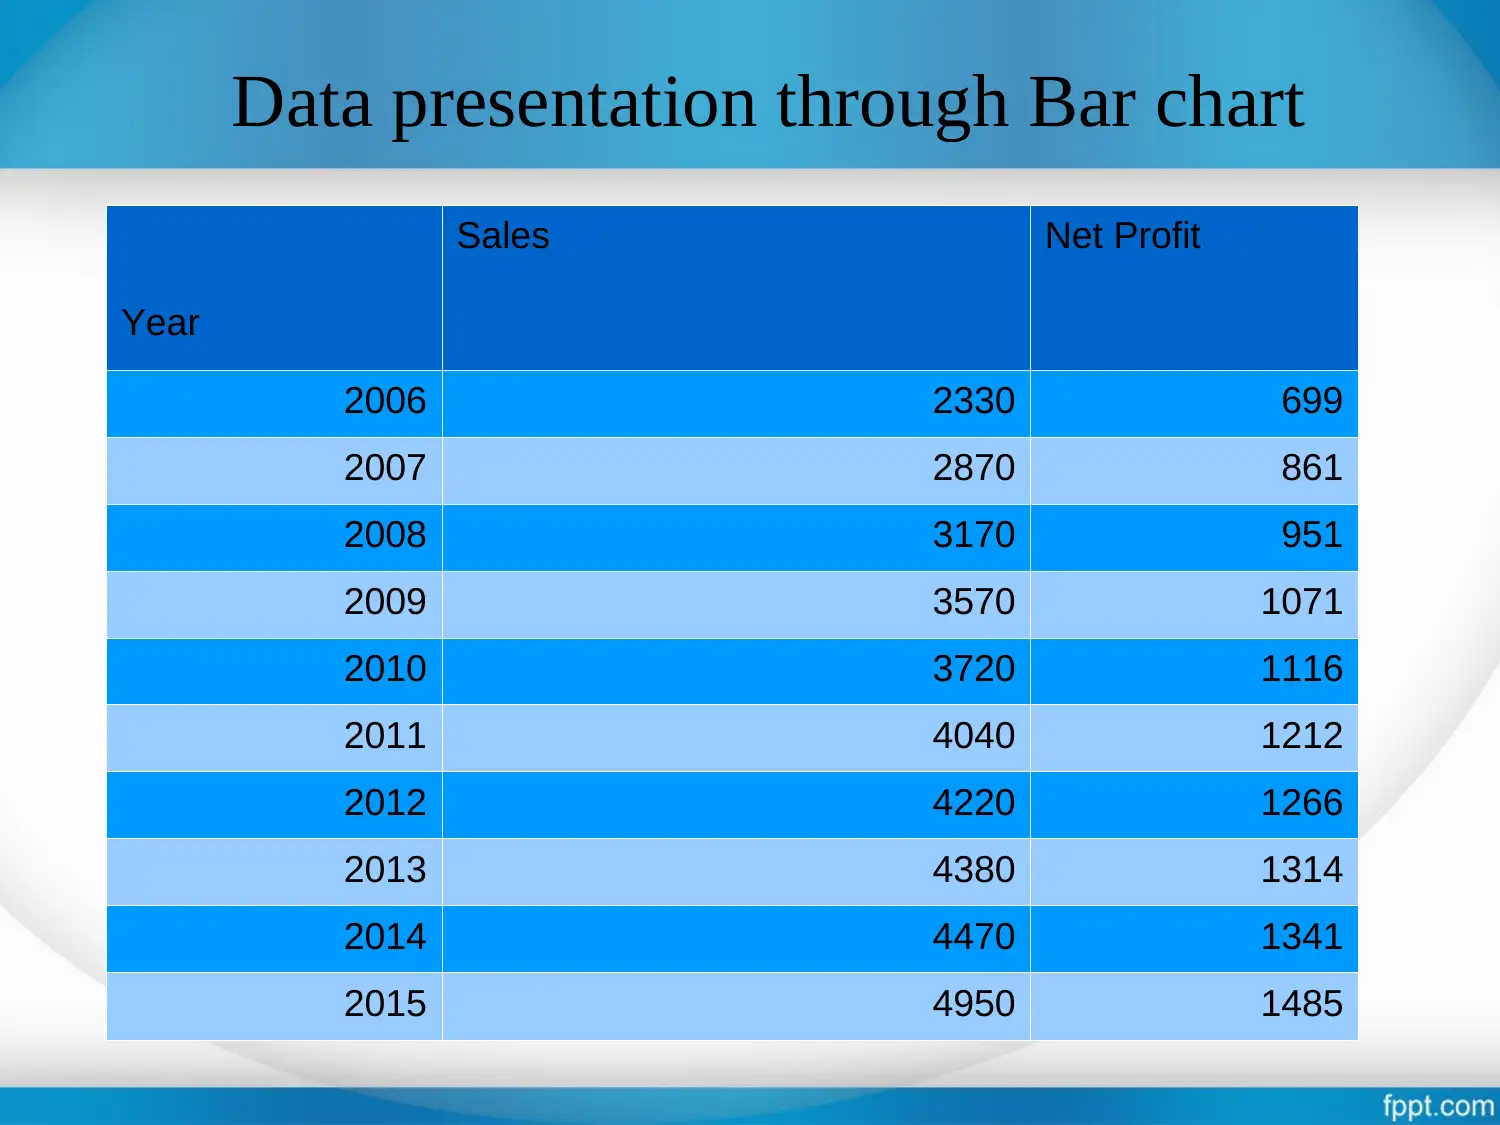
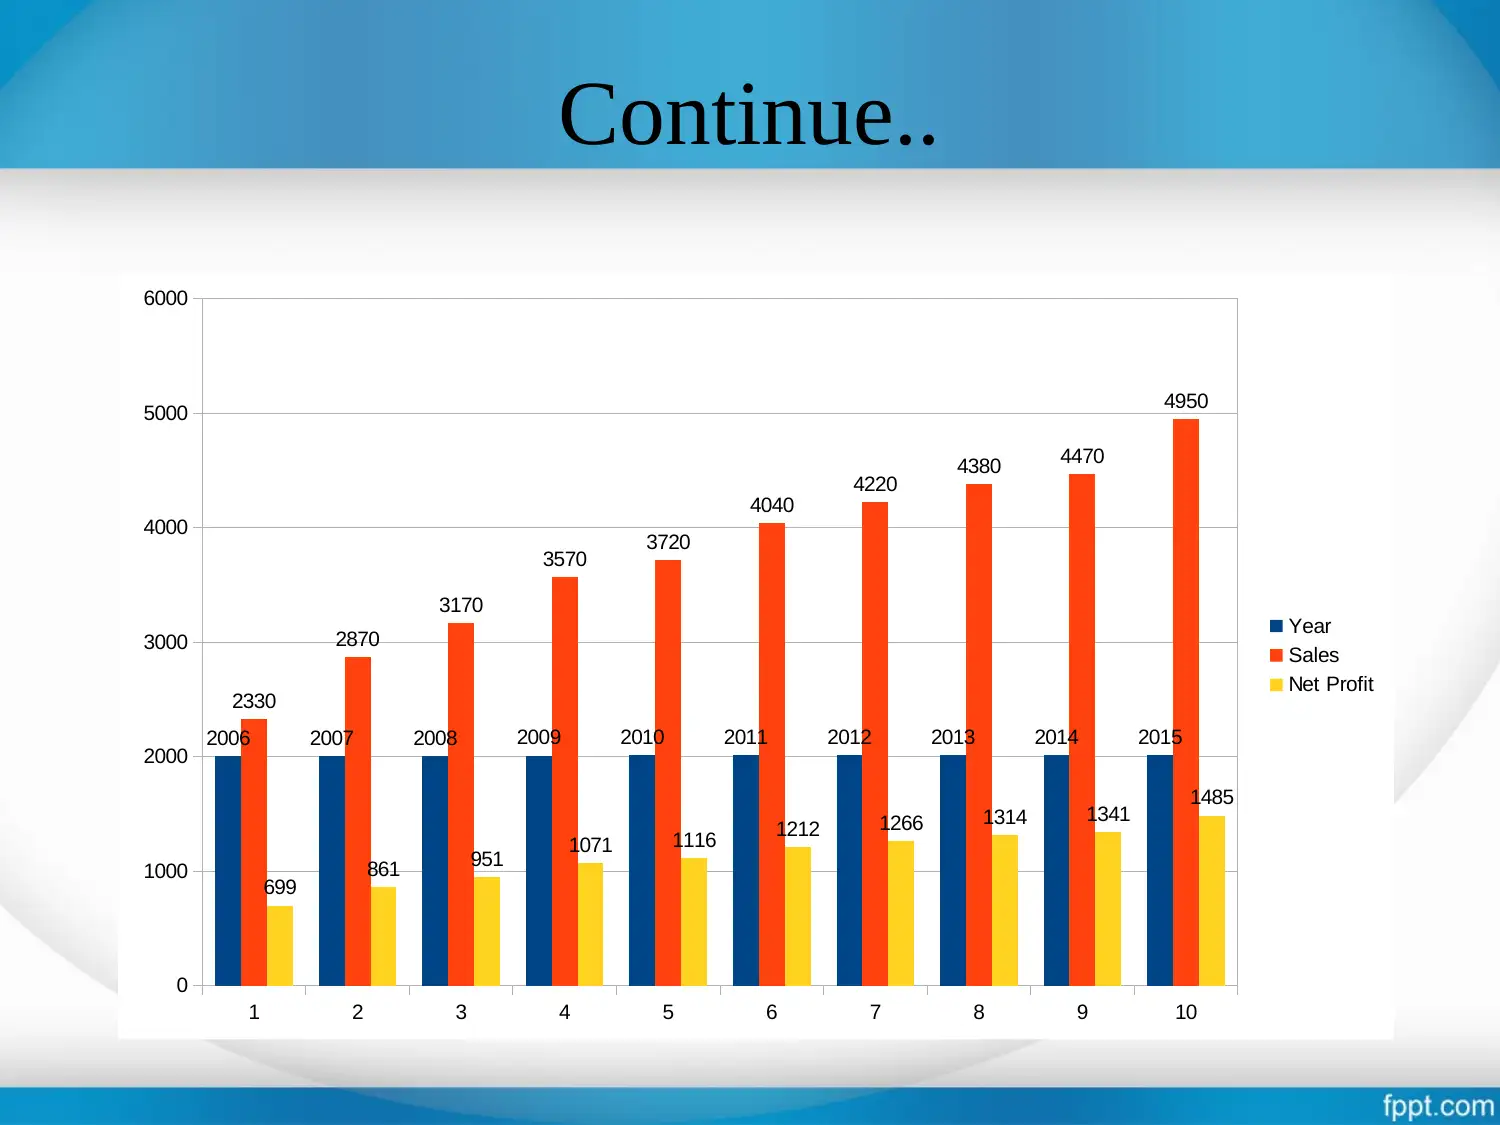
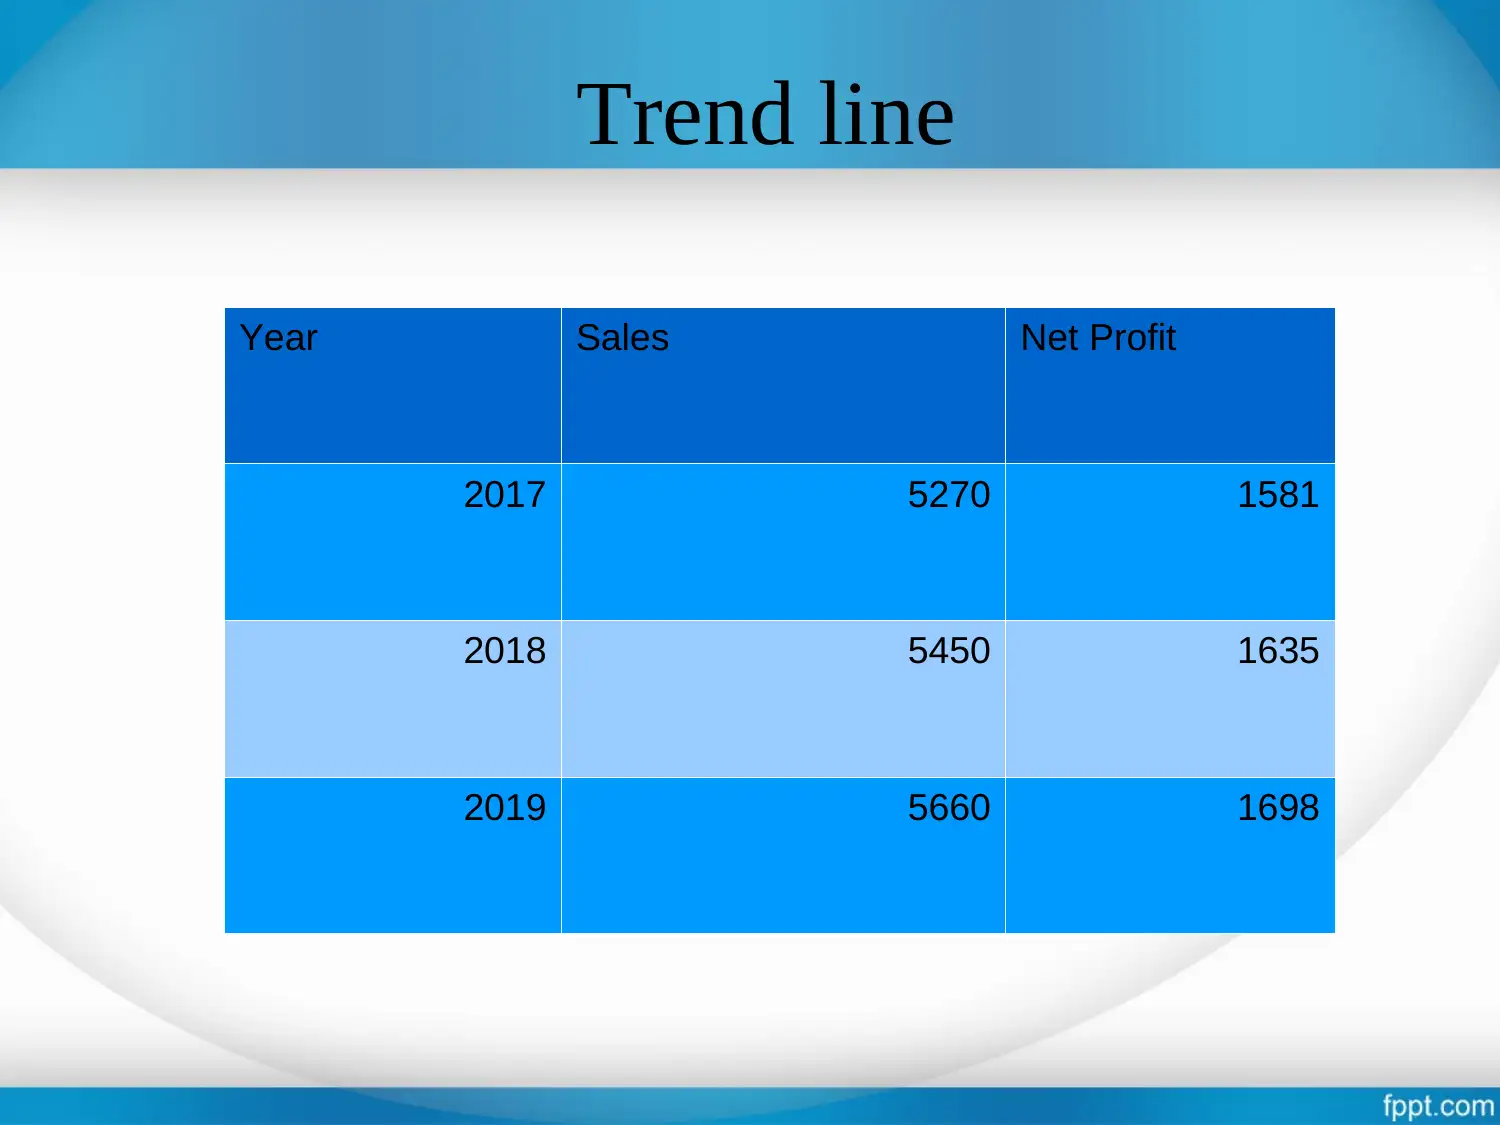
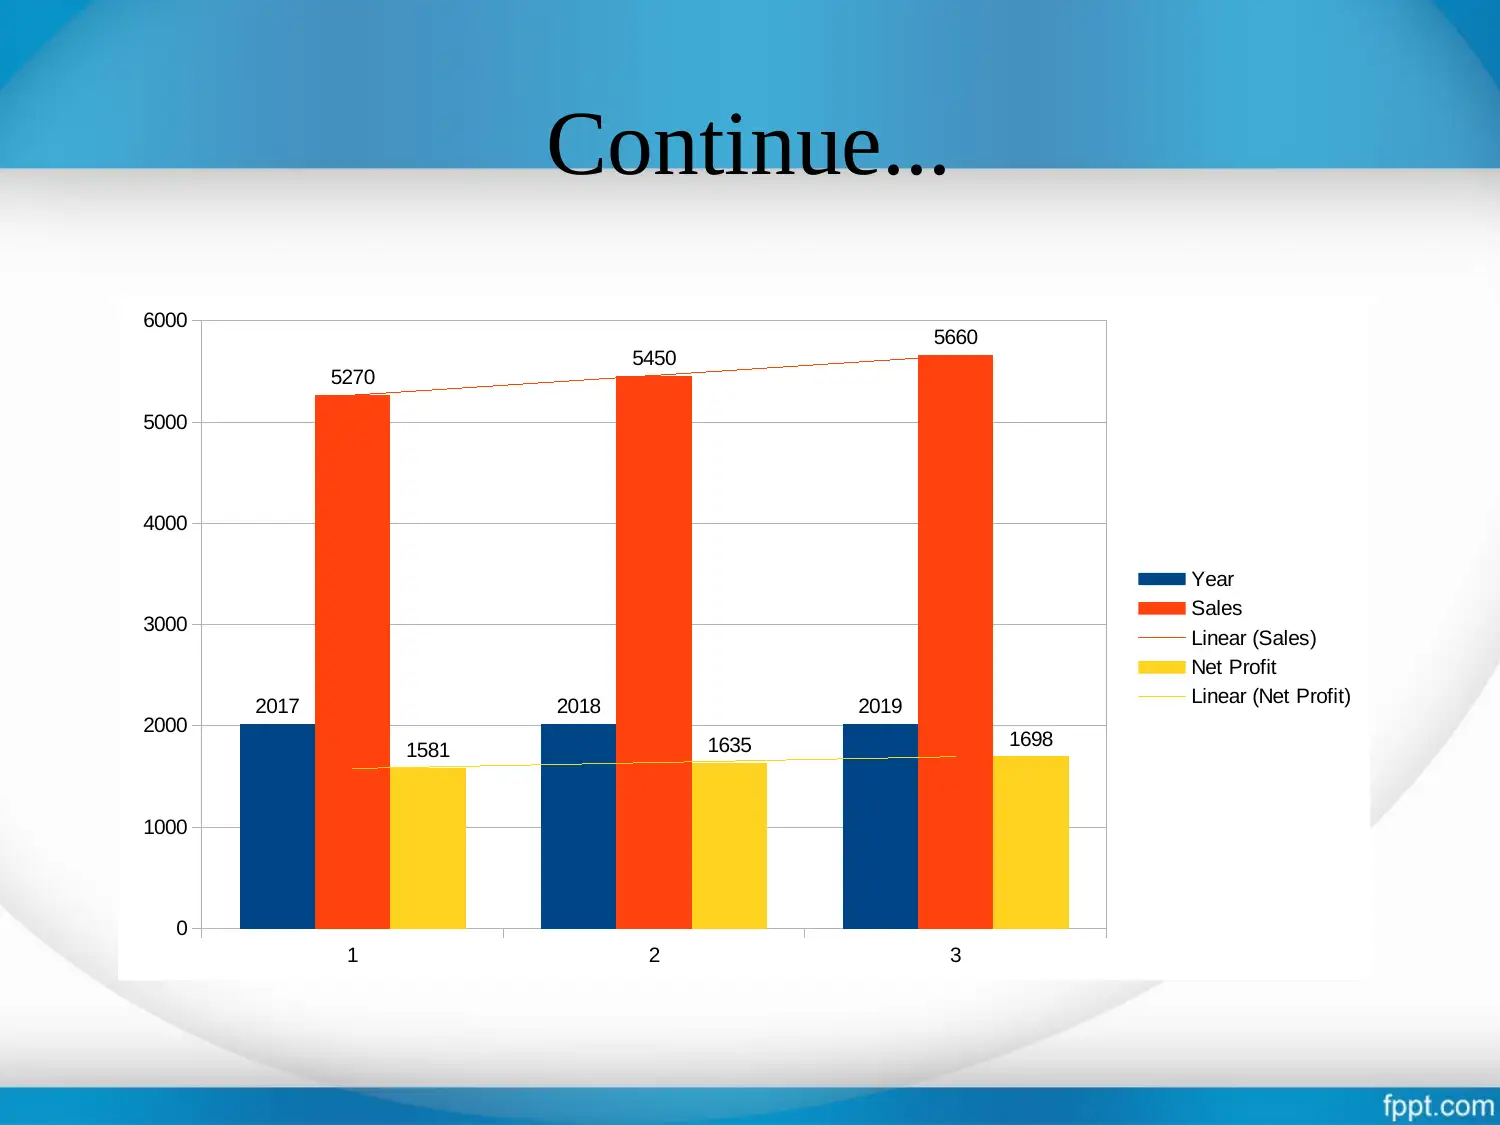
This report presents an analysis of customer attitudes and experiences at Balti Palace restaurant, aiming to inform business decision-making. The research methodology involves a survey with random sampling and questionnaires collected from customers. Data is presented through bar charts and trend lines to illustrate sales and net profit over several years. Key findings indicate customer interest in regular visits and satisfaction with the restaurant's atmosphere. Suggestions include enhancing facilities, improving hospitality quality, and increasing the effectiveness of online booking. The report references business model innovation and multiple attribute decision-making, providing a comprehensive overview of the customer experience and recommendations for improvement. Desklib offers a variety of similar solved assignments and past papers.
Document Page
Business Decision
Making
Task 3.3
tabler-icon-diamond-filled.svg

Paraphrase This Document

Need a fresh take? Get an instant paraphrase of this document with our AI Paraphraser
Document Page
Covered content
Introduction
Objective
Research Methodology
Data Presentation through Bar chart
Trend line
Findings
Suggestions
References
Document Page
Business decision making is the crucial aspects for
business concern by which they can manage and control
their daily operations.
INTRODUCTION
Document Page
OBJECTIVES
The main purpose of conducting this research is to analyse
the attitude and experiences of the customers that they gain
after visiting to Balti palace restaurant .
tabler-icon-diamond-filled.svg

Paraphrase This Document

Need a fresh take? Get an instant paraphrase of this document with our AI Paraphraser
Document Page
Research Methodology
The survey is done in order to eliminate literature gap.
Random sampling is used under this process.
Questionnaire are the main base of this research work
which is collected from the selected group of customers.
Different charts and graphs are drawn after making
analysis of the reports.
Document Page
Data presentation through Bar chart
Year
Sales Net Profit
2006 2330 699
2007 2870 861
2008 3170 951
2009 3570 1071
2010 3720 1116
2011 4040 1212
2012 4220 1266
2013 4380 1314
2014 4470 1341
2015 4950 1485
Document Page
Continue..
1 2 3 4 5 6 7 8 9 10
0
1000
2000
3000
4000
5000
6000
2006 2007 2008 2009 2010 2011 2012 2013 2014 2015
2330
2870
3170
3570 3720
4040 4220 4380 4470
4950
699 861 951 1071 1116 1212 1266 1314 1341 1485
Year
Sales
Net Profit
tabler-icon-diamond-filled.svg

Paraphrase This Document

Need a fresh take? Get an instant paraphrase of this document with our AI Paraphraser
Document Page
Trend line
Year Sales Net Profit
2017 5270 1581
2018 5450 1635
2019 5660 1698
Document Page
Continue...
1 2 3
0
1000
2000
3000
4000
5000
6000
2017 2018 2019
5270 5450
5660
1581 1635 1698
Year
Sales
Linear (Sales)
Net Profit
Linear (Net Profit)
Document Page
FINDINGS
The customers are more interesting to visit regularly at
Balti palace.
The restaurants are providing sufficient atmosphere to the
customers.
Effective results are generated from this particular
projects.
tabler-icon-diamond-filled.svg

Paraphrase This Document

Need a fresh take? Get an instant paraphrase of this document with our AI Paraphraser
Document Page
SUGGESTION
More facilities are demanded by the customer in food or
security.
The quality of the hospitality need to be more specific.
The online booking need to be increase and more
effective.
Document Page
REFERENCES
Sosna, M., Trevinyo-Rodríguez, R. N and Velamuri, S.R.,
2010. Business model innovation through trial-and-
error learning: The Naturhouse case. Long range
planning.43(2). pp.383-407.
Tzeng, G. H and Huang, J. J., 2011. Multiple attribute
decision making. Methods and applications.
chevron_up_icon
1 out of 13
circle_padding
hide_on_mobile
zoom_out_icon