Analyzing Customer Satisfaction at Balti Palace for Business Decisions

Verified

Added on  2023/03/30

|13
|296
|435
Report
AI Summary
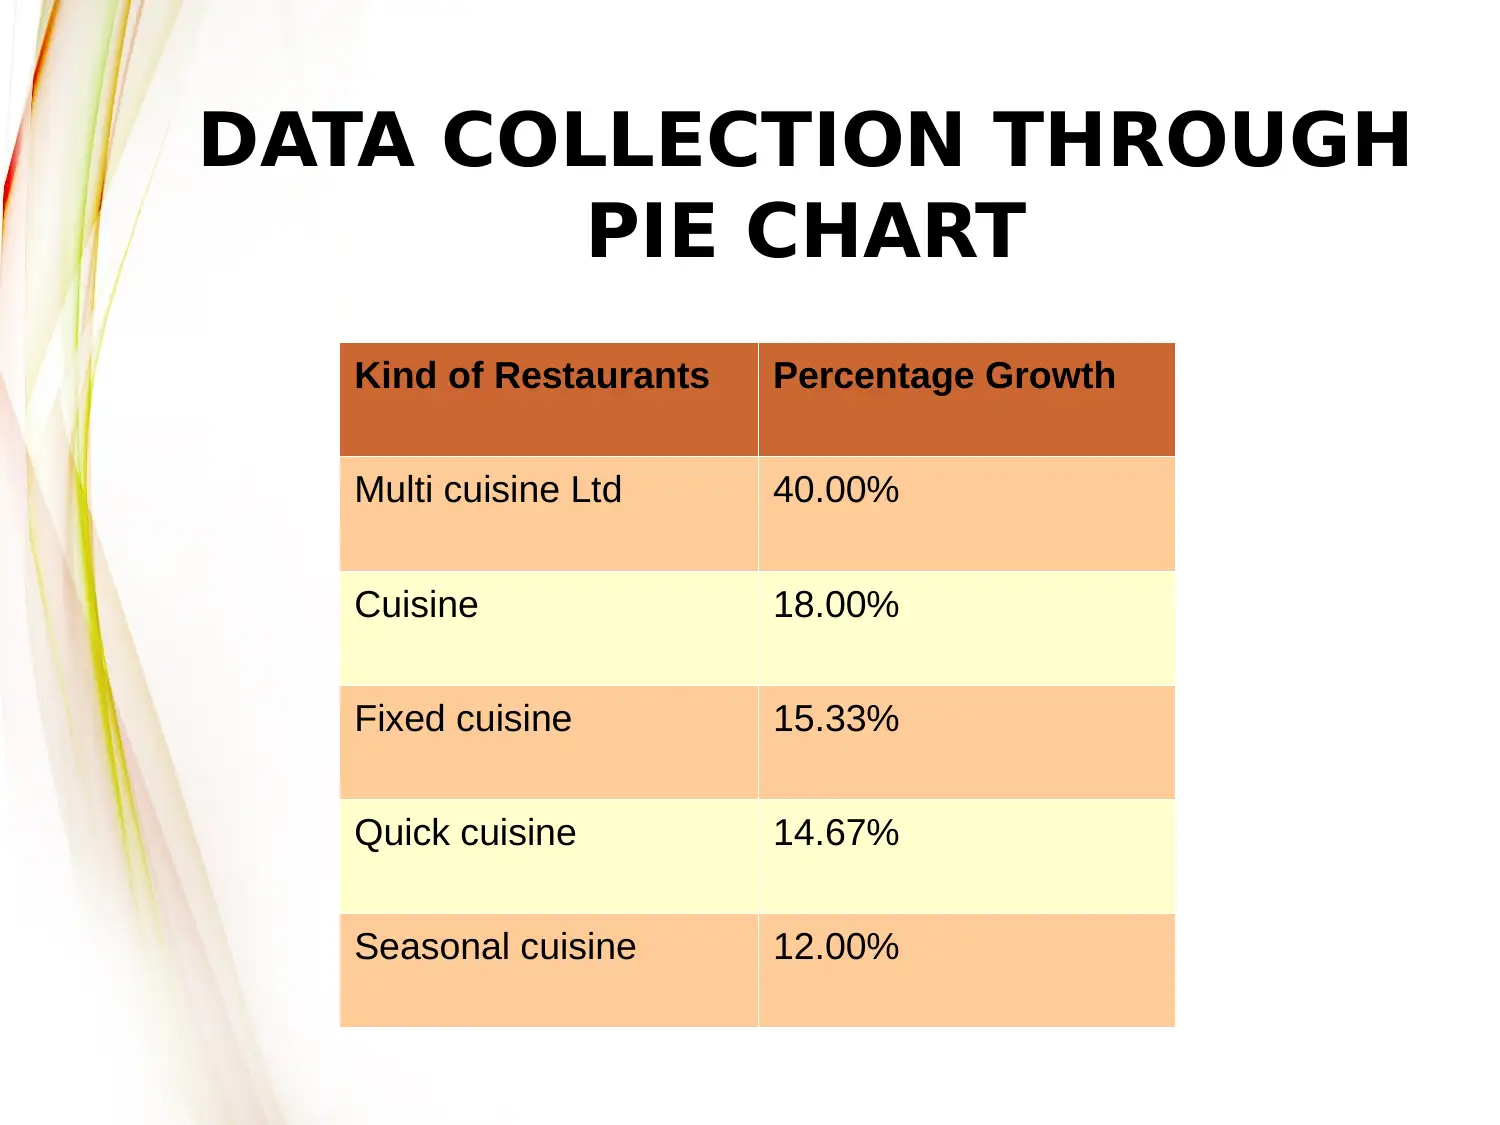
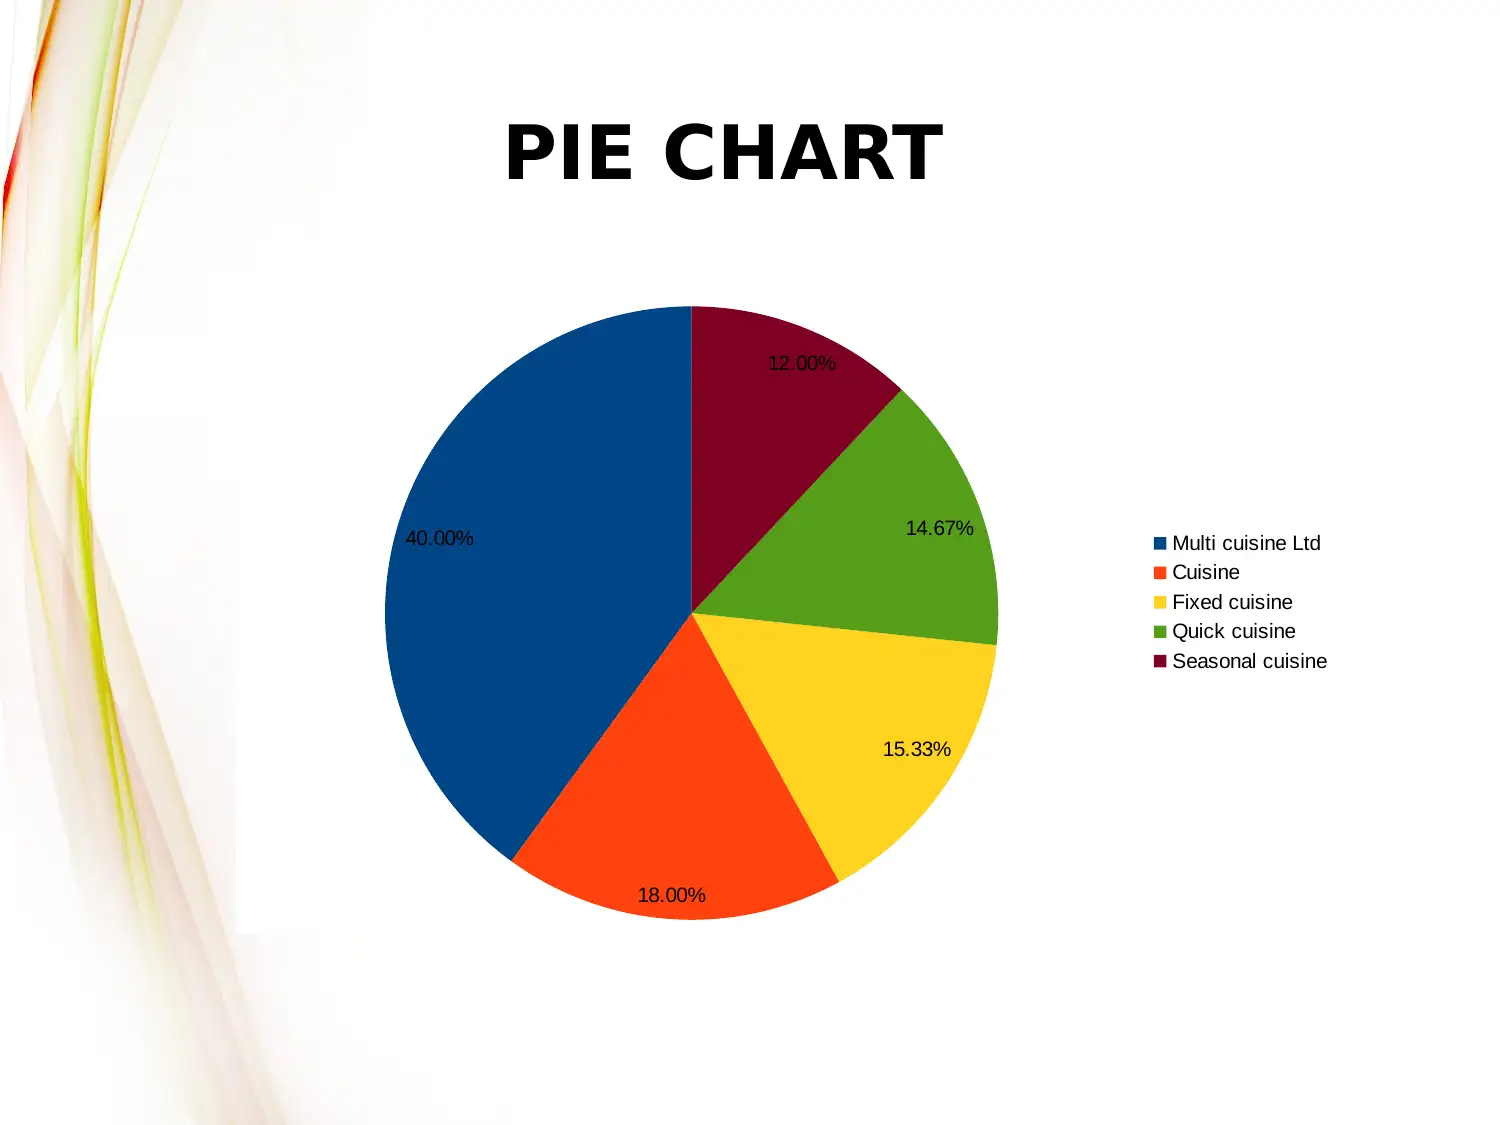
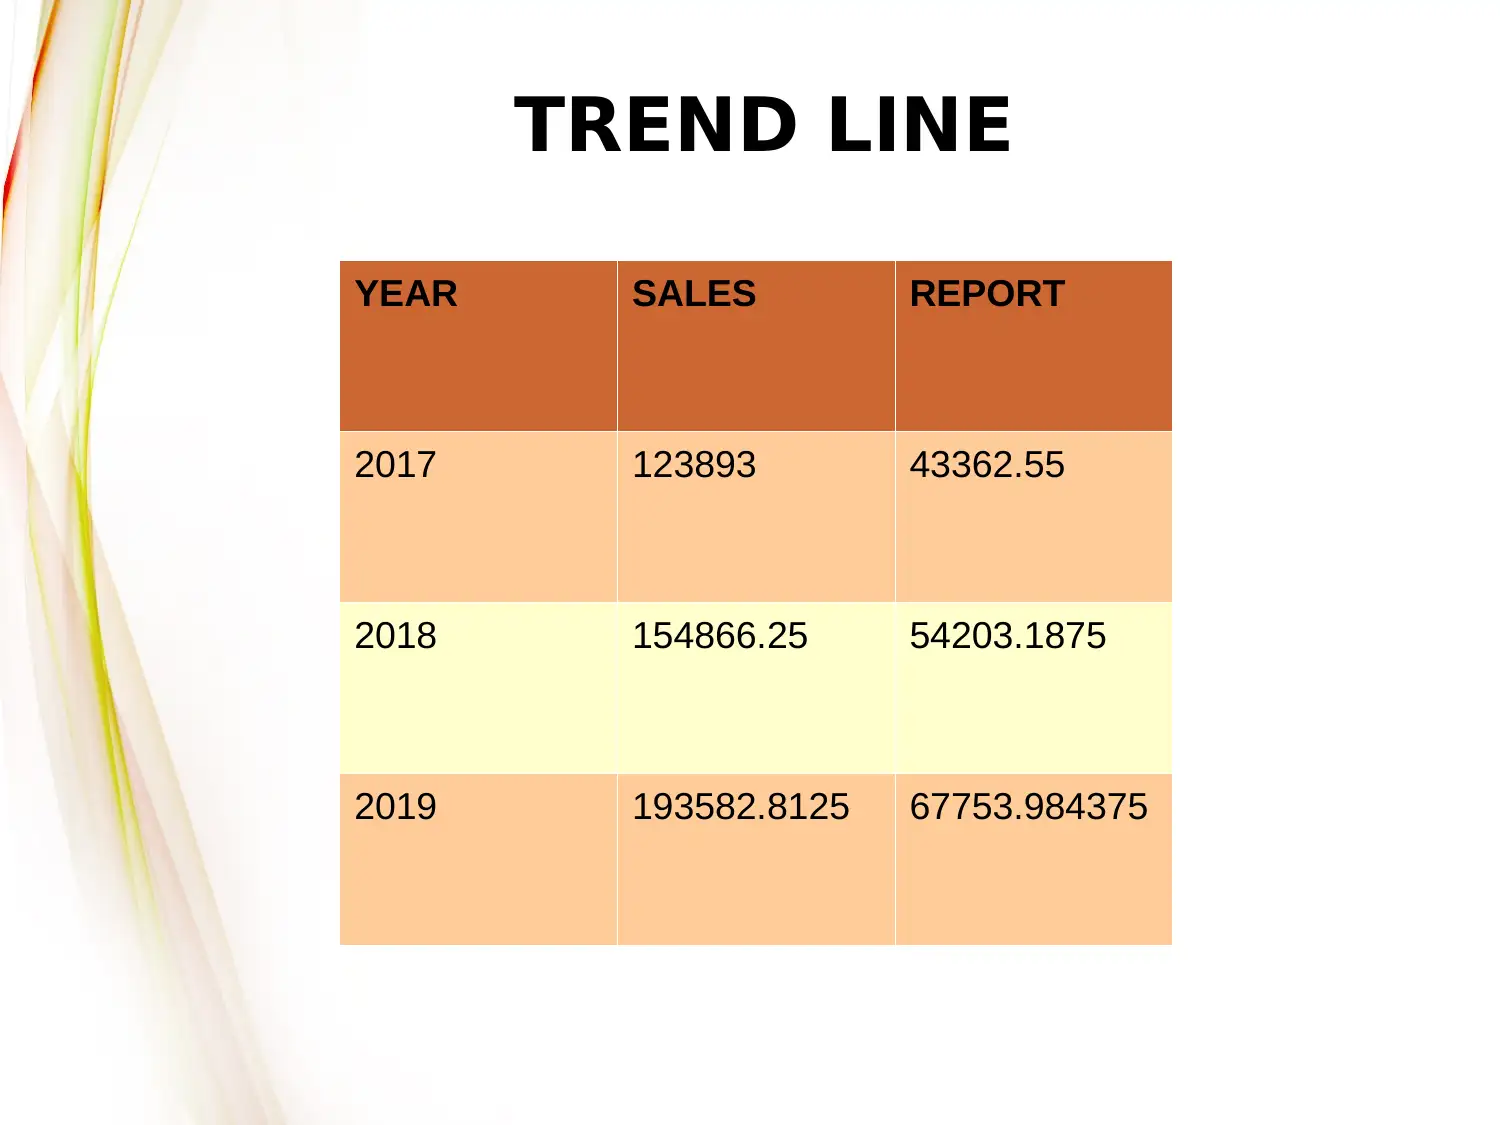
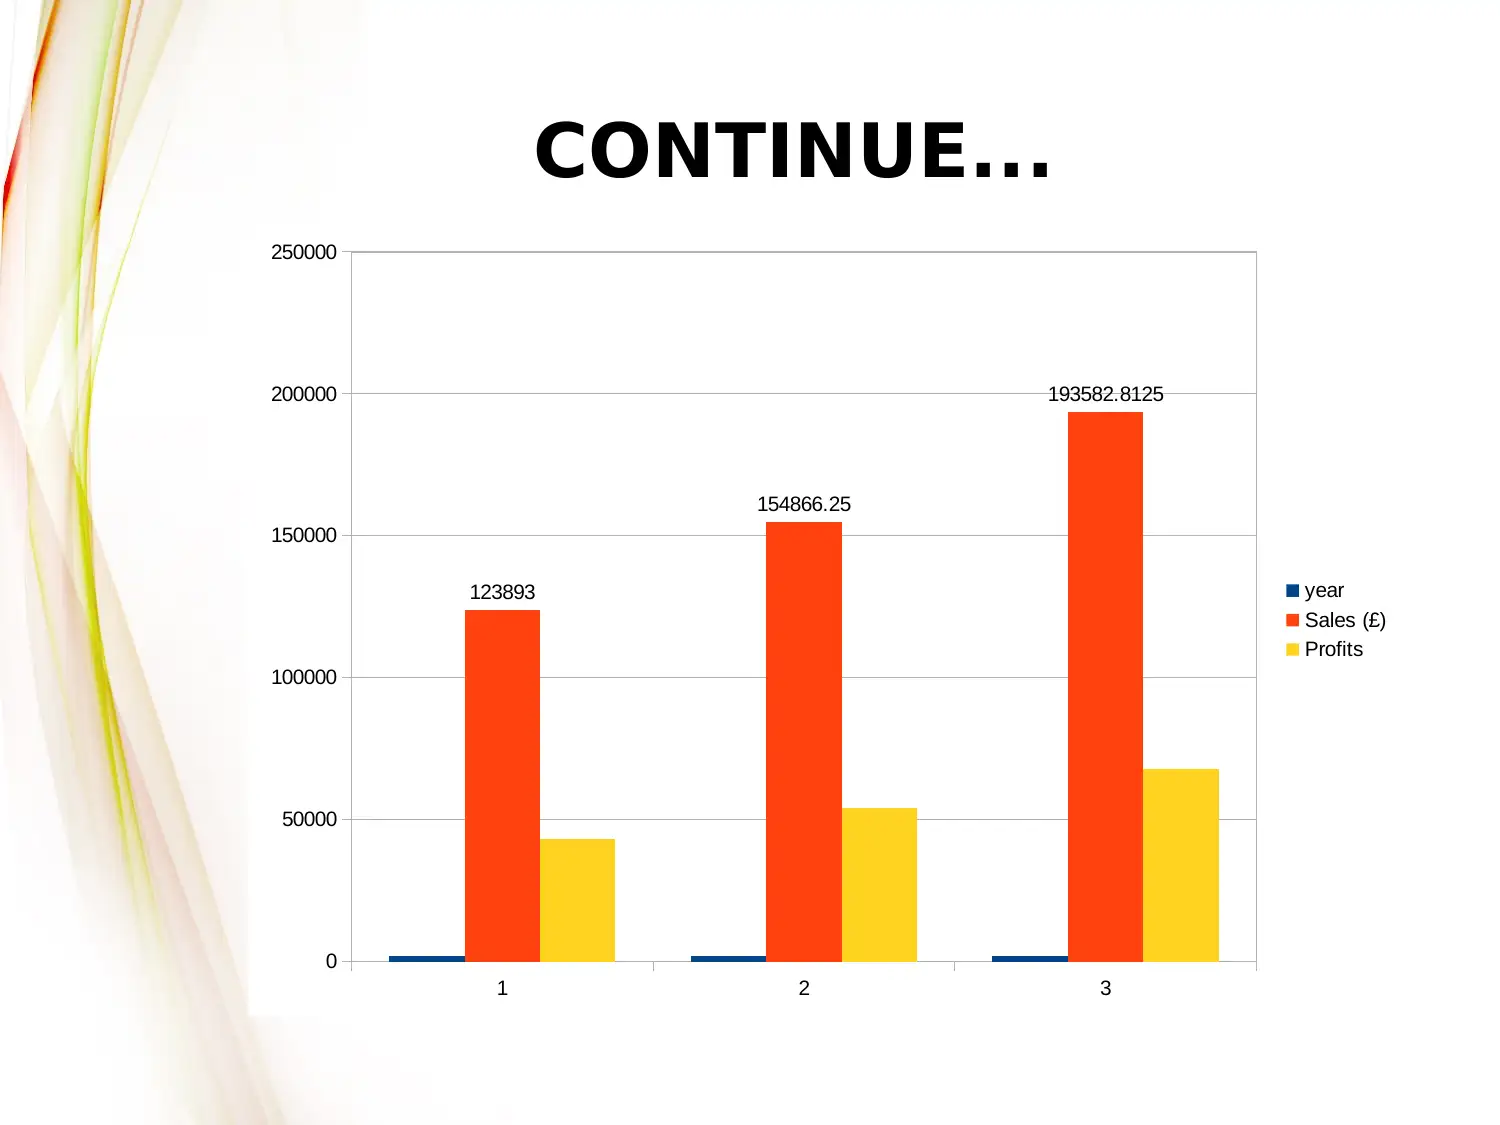
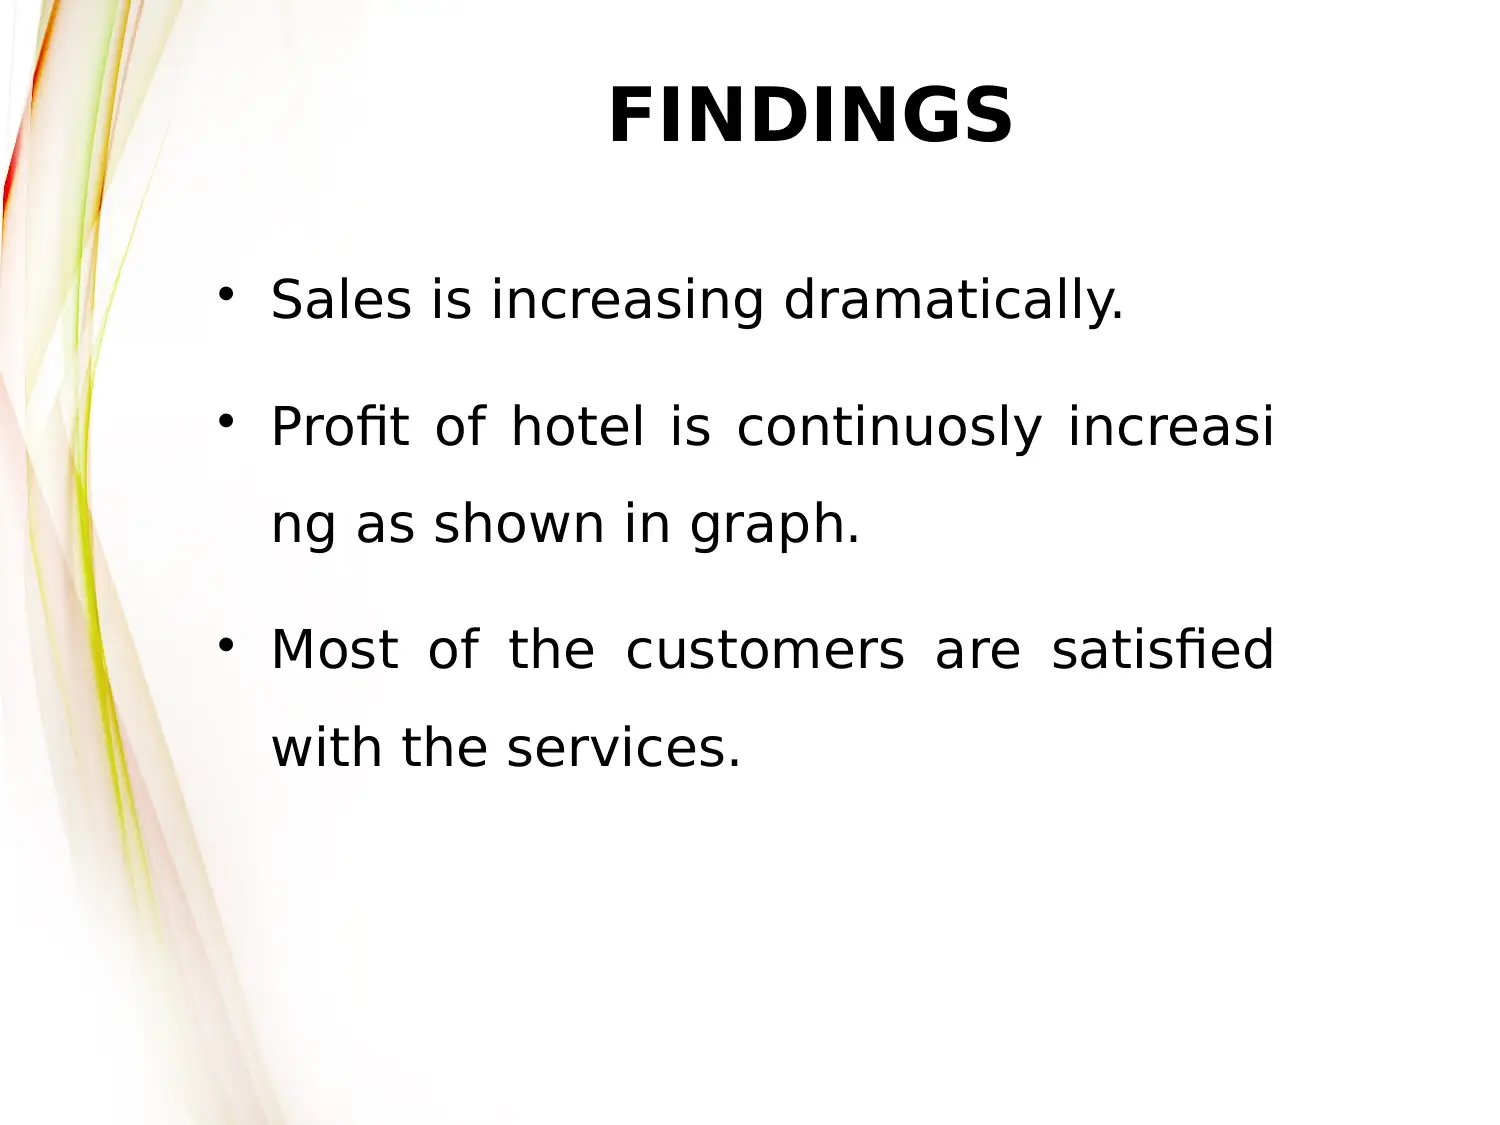
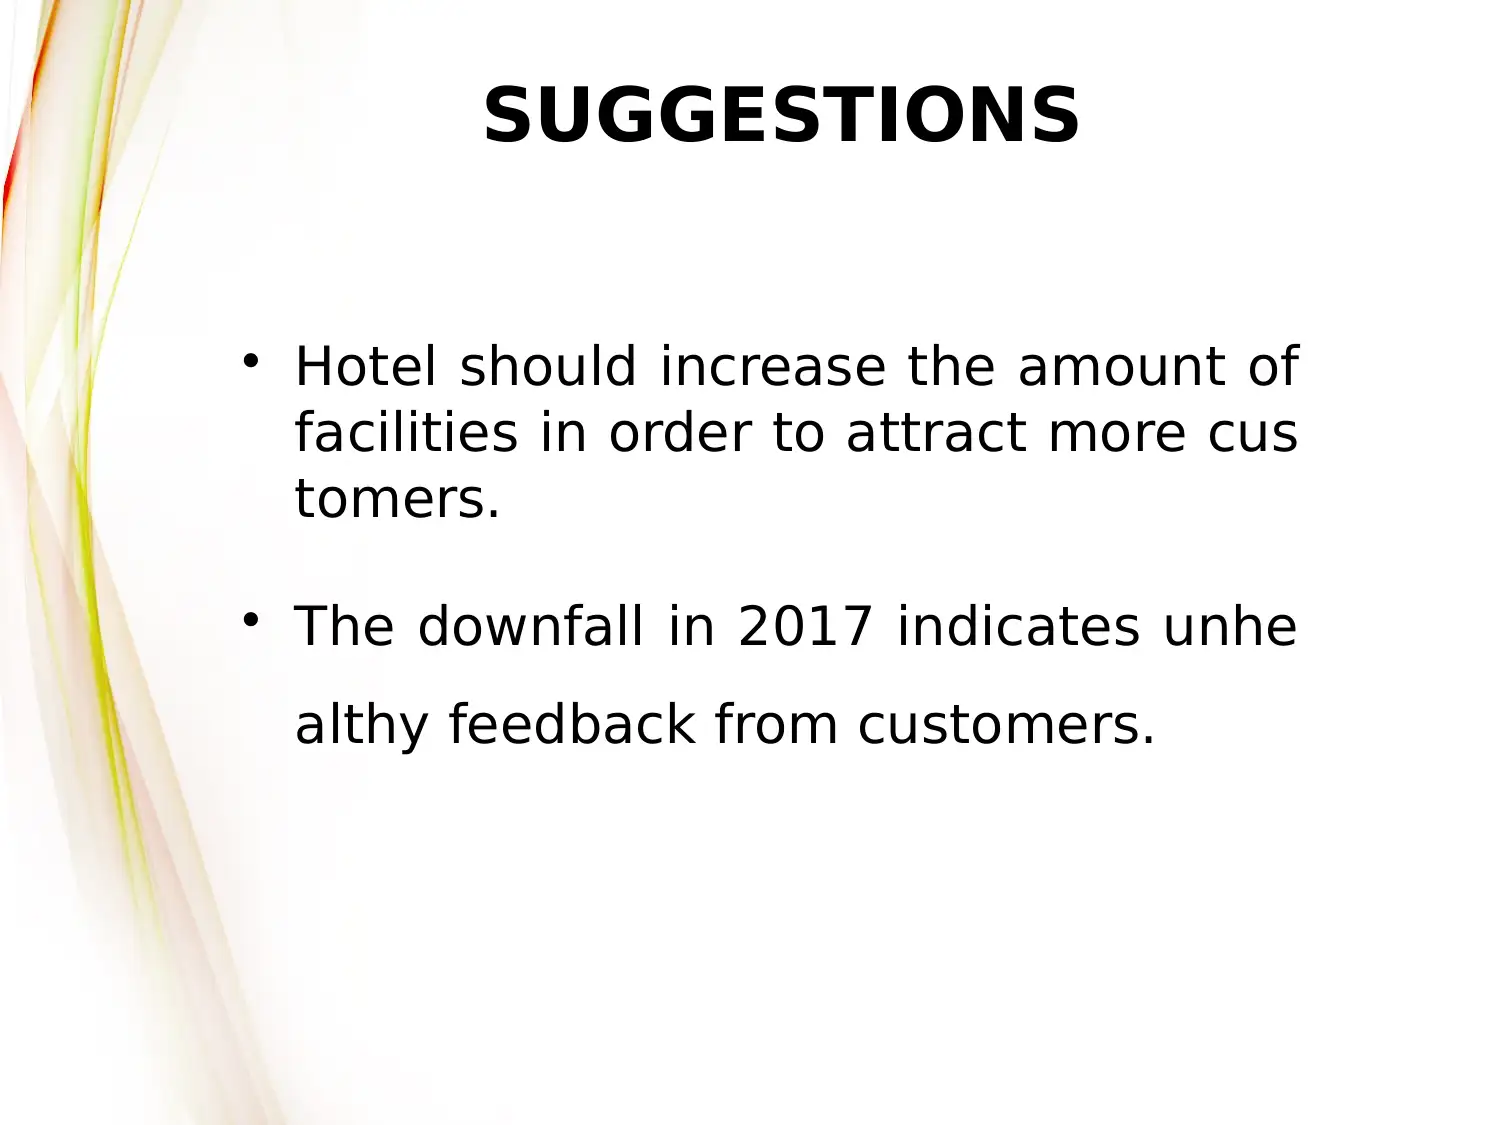
This report provides an analysis of Balti Palace's performance through the lens of customer satisfaction and its implications for business decision-making. The report outlines the objectives of understanding customer responses, the research methodology involving survey analysis and random sampling, and data collection methods. A pie chart illustrates the distribution of restaurant types preferred by customers, while a trend line showcases the sales and profit growth over the years. Key findings indicate a dramatic increase in sales and continuous profit growth, alongside high customer satisfaction levels. Suggestions include enhancing facilities to attract more customers and addressing the downturn in 2017 based on customer feedback. The report concludes with a list of references. Desklib provides access to this and other solved assignments to support students in their studies.
Document Page
(TASK 3.3)
BUSINESS
DECISION
MAKING
tabler-icon-diamond-filled.svg

Paraphrase This Document

Need a fresh take? Get an instant paraphrase of this document with our AI Paraphraser
Document Page
COVER CONTENT
Introduction
Objectives
Research Methodology
Data Collection
Trend Line
Findings
Suggestions
References
Document Page
INTRODUCTION
Buisness decision making is defined as the i
mportant technique which is used to ananalys
e several possibilities. This project is based on
the performance of Balti Palace and is present
ed by students with the help of their satisfacti
on and experience.
Document Page
OBJECTIVES
The major objective of a survey is to know
about customer's responses regarding t
heir experience in Balti Palace.
tabler-icon-diamond-filled.svg

Paraphrase This Document

Need a fresh take? Get an instant paraphrase of this document with our AI Paraphraser
Document Page
RESEARCH METHODOLOGY
Rationale of study is determined with
the help of survey analysis.
Use of random sampling is done for
data analysis.
Collection of primary data is done by
various respondents.
Graphs are being prepared by using
secondary data.
Document Page
DATA COLLECTION THROUGH
PIE CHART
Kind of Restaurants Percentage Growth
Multi cuisine Ltd 40.00%
Cuisine 18.00%
Fixed cuisine 15.33%
Quick cuisine 14.67%
Seasonal cuisine 12.00%
Document Page
PIE CHART
40.00%
18.00%
15.33%
14.67%
12.00%
Multi cuisine Ltd
Cuisine
Fixed cuisine
Quick cuisine
Seasonal cuisine
tabler-icon-diamond-filled.svg

Paraphrase This Document

Need a fresh take? Get an instant paraphrase of this document with our AI Paraphraser
Document Page
TREND LINE
YEAR SALES REPORT
2017 123893 43362.55
2018 154866.25 54203.1875
2019 193582.8125 67753.984375
Document Page
CONTINUE...
1 2 3
0
50000
100000
150000
200000
250000
123893
154866.25
193582.8125
year
Sales (£)
Profits
Document Page
FINDINGS
Sales is increasing dramatically.
Profit of hotel is continuosly increasi
ng as shown in graph.
Most of the customers are satisfied
with the services.
tabler-icon-diamond-filled.svg

Paraphrase This Document

Need a fresh take? Get an instant paraphrase of this document with our AI Paraphraser
Document Page
SUGGESTIONS
Hotel should increase the amount of
facilities in order to attract more cus
tomers.
The downfall in 2017 indicates unhe
althy feedback from customers.
Document Page
REFERENCES
Li, C., 2010. Groundswell. Winning in a
world transformed by social
technologies. Strategic Direction. 26(8).
Vercellis, C., 2011. Business intelligence:
data mining and optimization for
decision making. John Wiley & Sons.
chevron_up_icon
1 out of 13
circle_padding
hide_on_mobile
zoom_out_icon
[object Object]