Balti Palace Restaurant: Business Decision Making & Expansion Plan

Verified

Added on  2023/03/24

|10
|329
|53
Presentation
AI Summary
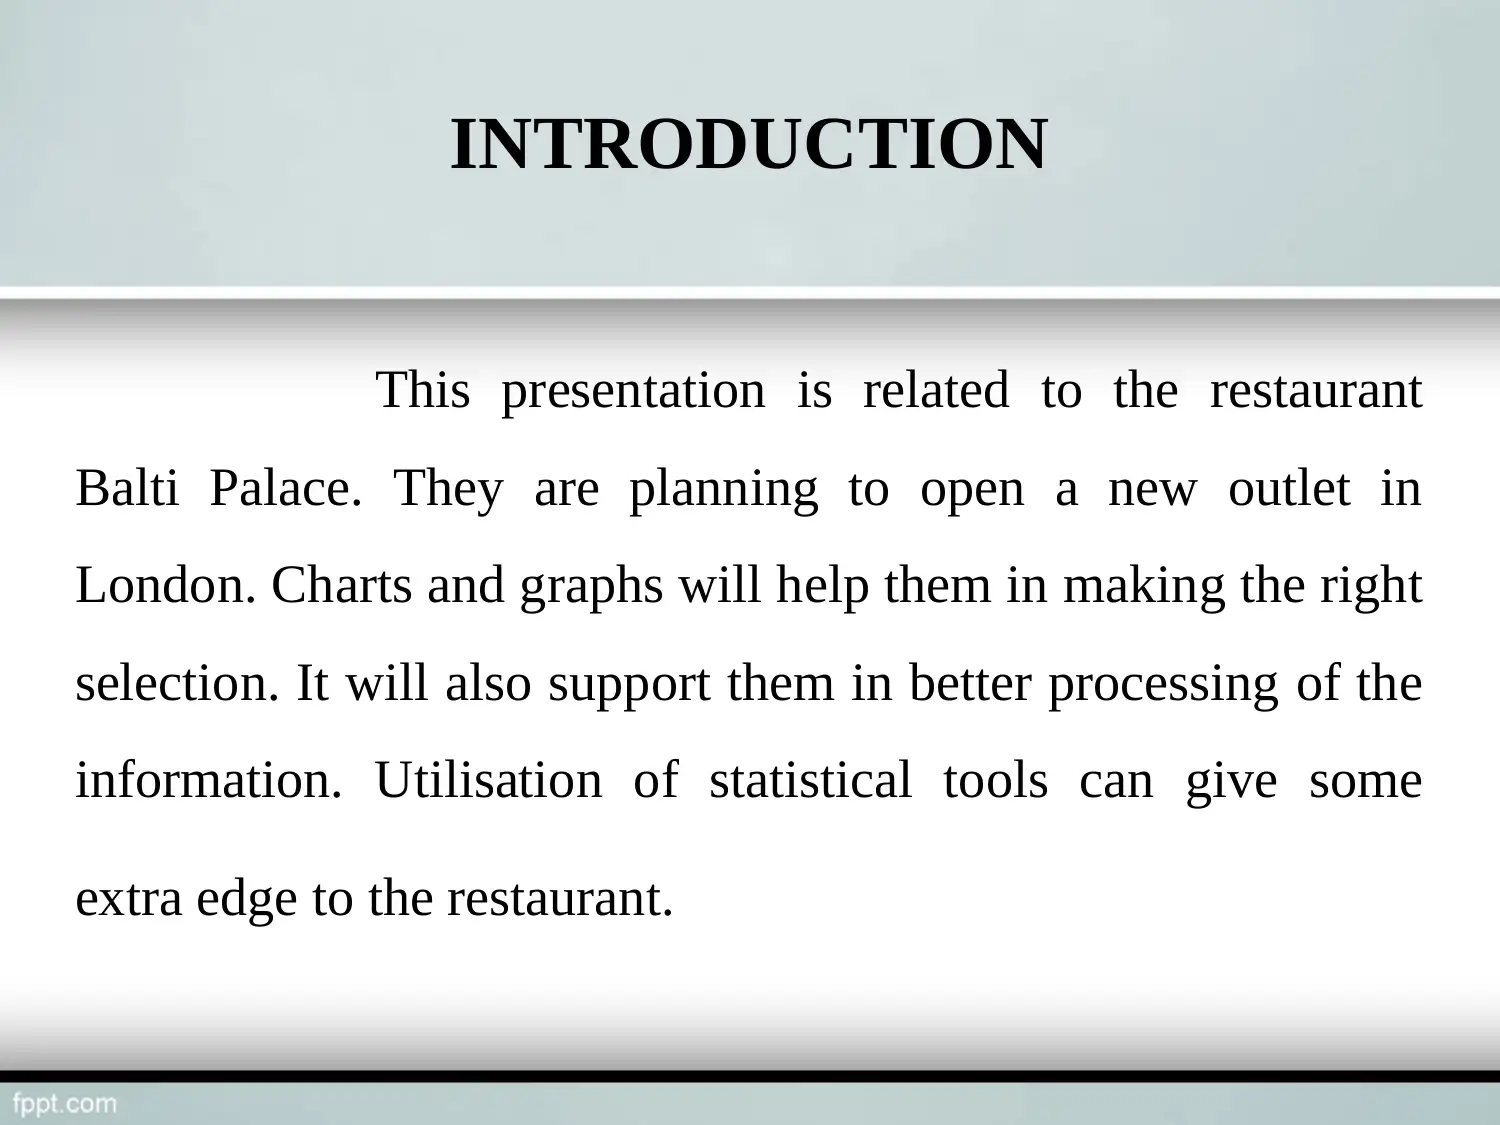
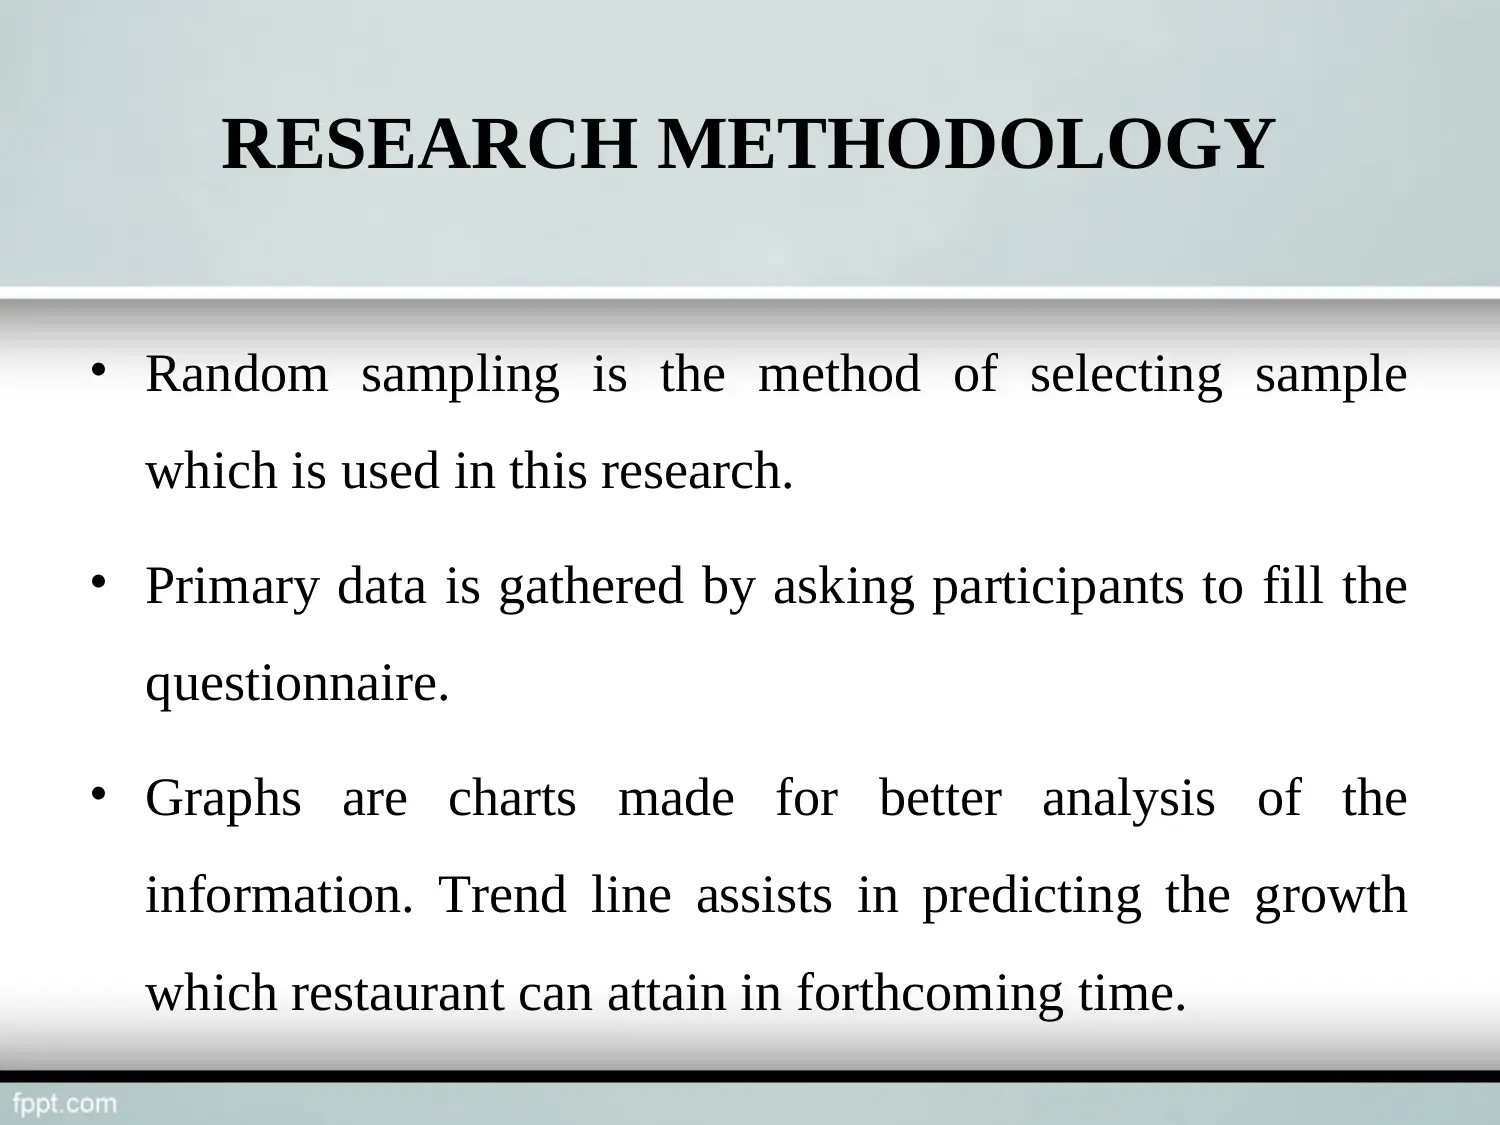
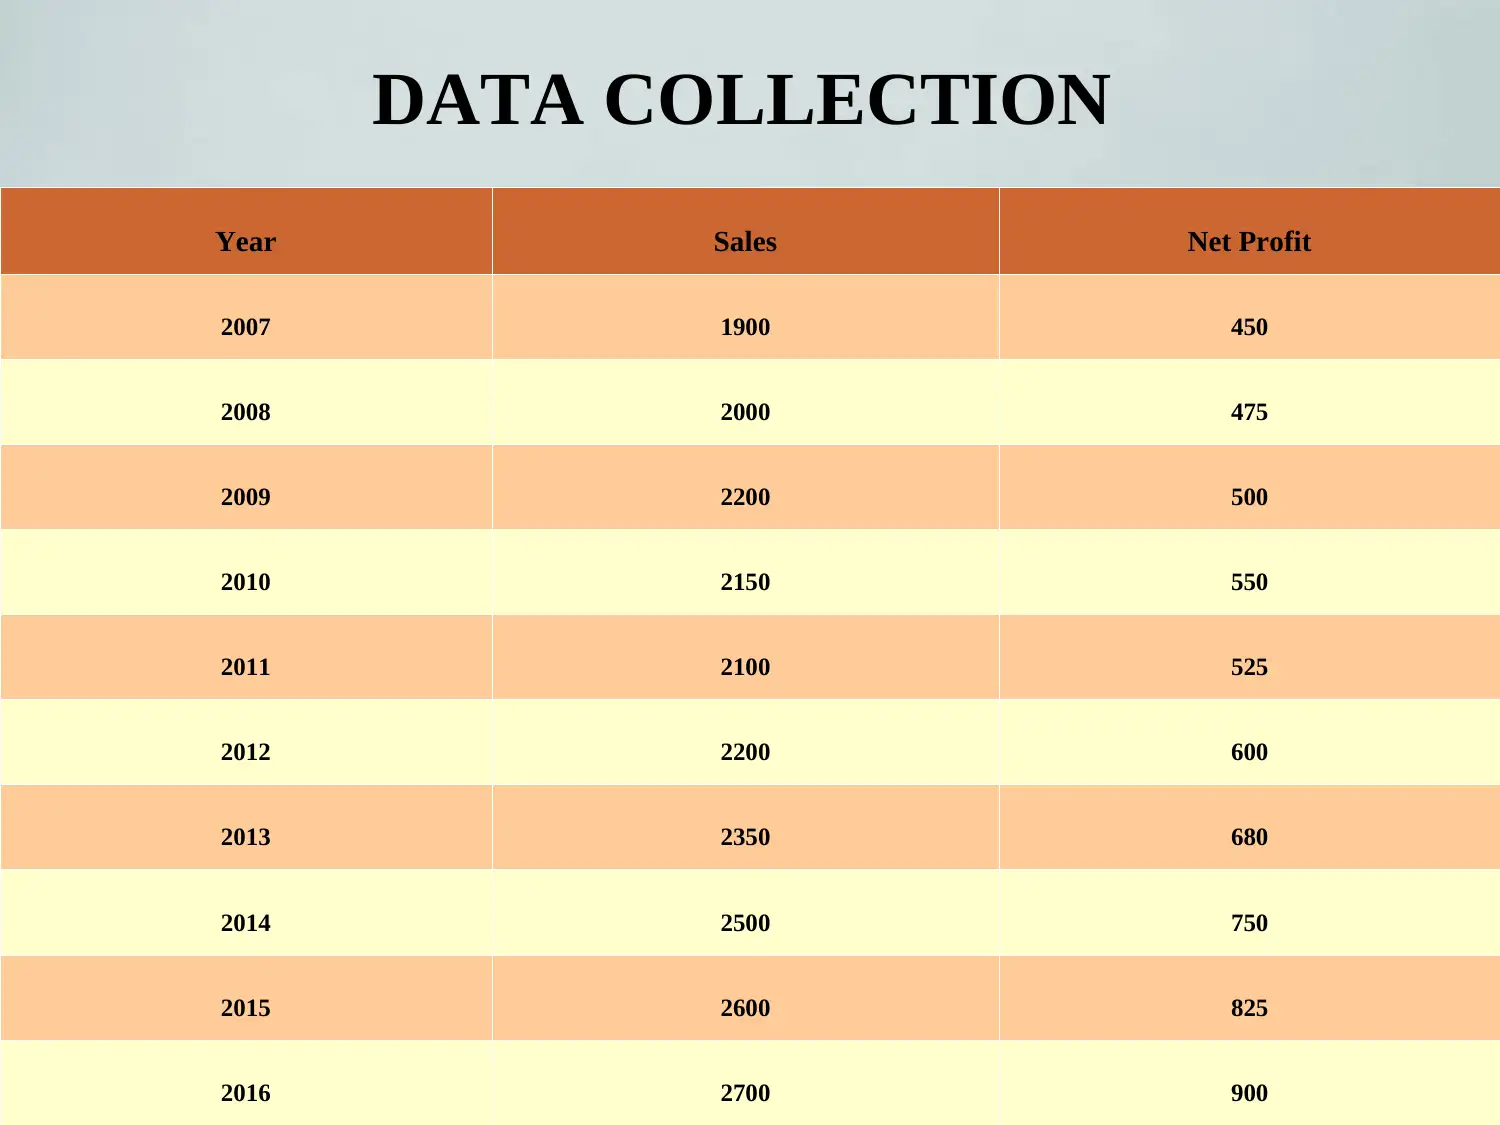
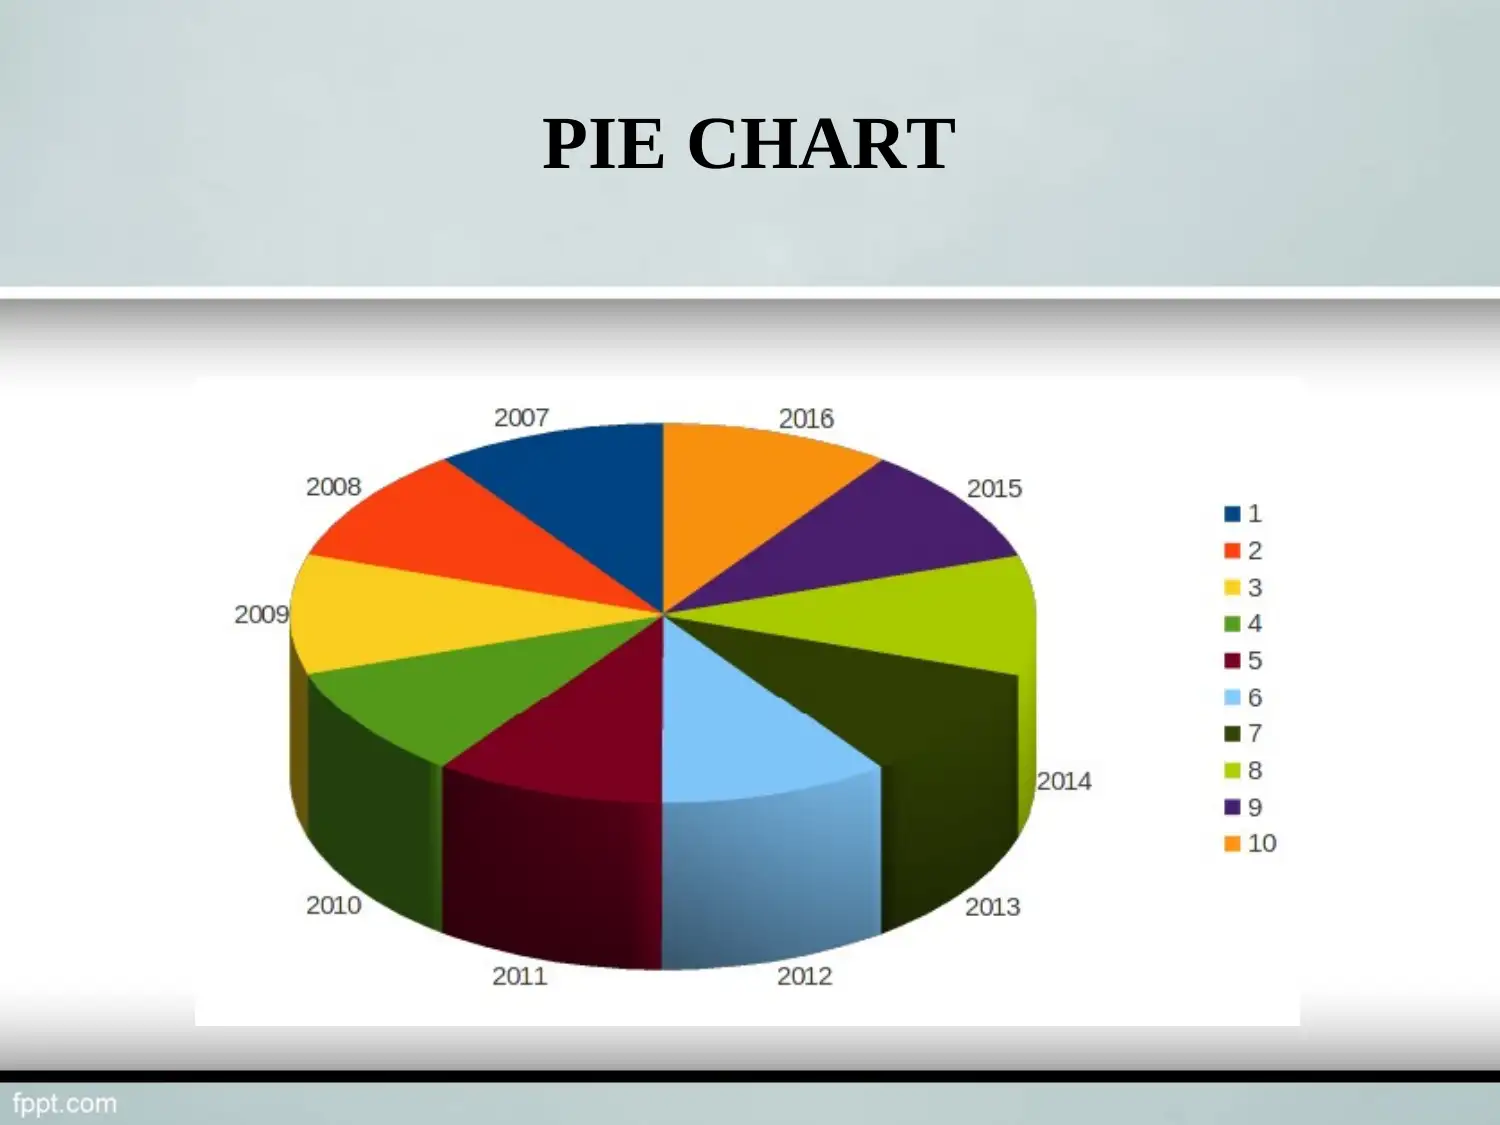
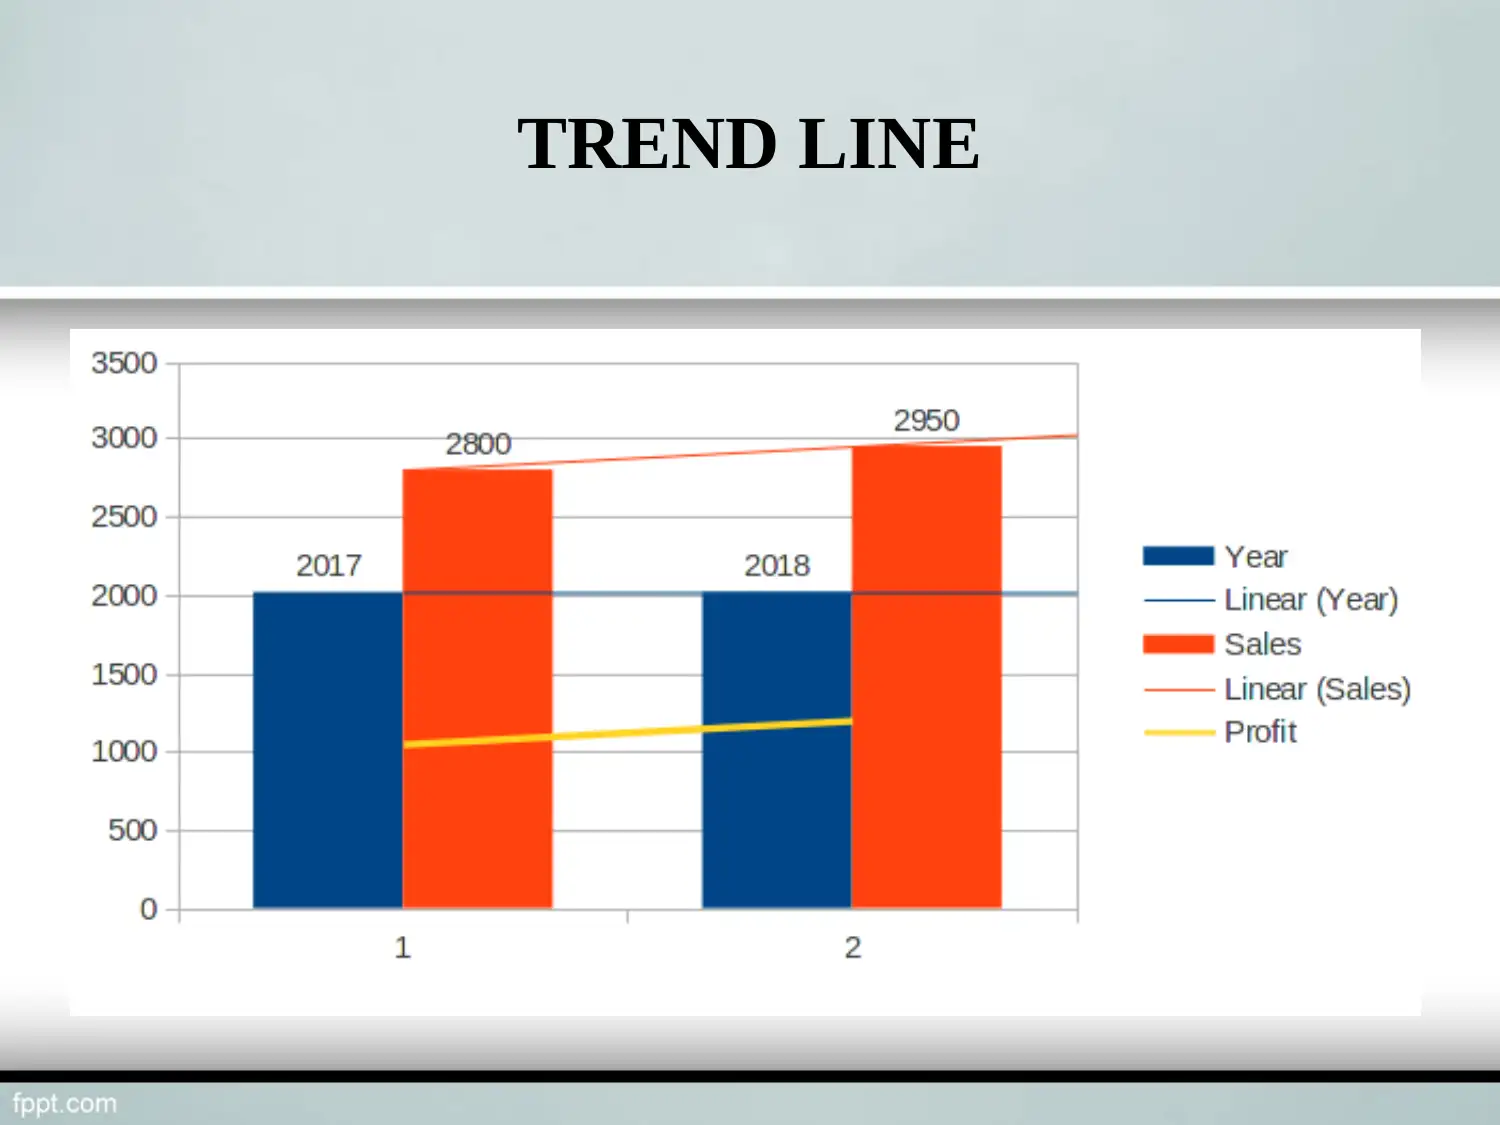
This presentation examines the business decision-making process for Balti Palace, a restaurant planning to open a new outlet in London. It employs charts, graphs, and statistical tools to aid in making informed decisions. The research methodology includes random sampling and primary data collection through questionnaires. The presentation features data on sales and net profit from 2007 to 2016, visualized through a pie chart and trend line. Key findings indicate customer satisfaction with food quality, initial challenges overcome, a positive profit trend, and some dissatisfaction with services. The analysis is supported by references to business intelligence and management information systems research. Desklib provides access to similar solved assignments and past papers for students.
Document Page
BUSINESS DECISION
MAKING
Task 3.3
tabler-icon-diamond-filled.svg

Paraphrase This Document

Need a fresh take? Get an instant paraphrase of this document with our AI Paraphraser
Document Page
COVERED CONTENT
Introduction
Research Methodology
Data collection
Trend line
Pie Chart
Findings
References
Document Page
INTRODUCTION
This presentation is related to the restaurant
Balti Palace. They are planning to open a new outlet in
London. Charts and graphs will help them in making the right
selection. It will also support them in better processing of the
information. Utilisation of statistical tools can give some
extra edge to the restaurant.
Document Page
RESEARCH METHODOLOGY
Random sampling is the method of selecting sample
which is used in this research.
Primary data is gathered by asking participants to fill the
questionnaire.
Graphs are charts made for better analysis of the
information. Trend line assists in predicting the growth
which restaurant can attain in forthcoming time.
tabler-icon-diamond-filled.svg

Paraphrase This Document

Need a fresh take? Get an instant paraphrase of this document with our AI Paraphraser
Document Page
DATA COLLECTION
Year Sales Net Profit
2007 1900 450
2008 2000 475
2009 2200 500
2010 2150 550
2011 2100 525
2012 2200 600
2013 2350 680
2014 2500 750
2015 2600 825
2016 2700 900
Document Page
PIE CHART
Document Page
TREND LINE
tabler-icon-diamond-filled.svg

Paraphrase This Document

Need a fresh take? Get an instant paraphrase of this document with our AI Paraphraser
Document Page
FINDINGS
Most of the customers are satisfied with the food quality.
This restaurant faced some problems in starting but
gradually, they came on track.
Their trend line shows that they will earn more profit in
upcoming time.
Some customers were not happy with the services of
restaurant.
Document Page
REFERENCES
Vercellis, C., 2011. Business intelligence: data mining and optimization for
decision making. John Wiley & Sons.
Laudon, K.C. and Laudon, J.P., 2015. Management Information Systems:
Managing the Digital Firm Plus MyMISLab with Pearson eText--Access
Card Package. Prentice Hall Press.
Maxwell, A.L., Jeffrey, S.A. and Lévesque, M., 2011. Business angel early
stage decision making. Journal of Business Venturing. 26(2). pp.212-
225.
Document Page
THANK YOU!!
chevron_up_icon
1 out of 10
circle_padding
hide_on_mobile
zoom_out_icon
[object Object]