Business Decision Making Report: Balti Palace Expansion in London
VerifiedAdded on 2020/07/23
|32
|4630
|28
Report
AI Summary
This report presents a comprehensive analysis of business decision-making for Balti Palace, focusing on its potential expansion. The report begins by outlining a plan for data collection, differentiating between primary and secondary research methods, and detailing the survey methodologies employed. A questionnaire designed to gather customer insights on various aspects, such as food quality, preferences, and location, is presented. The subsequent analysis of the collected data involves the use of central tendency measures and measures of dispersion, providing a clear understanding of customer preferences. The report then proceeds to produce graphs and trend line analyses to derive valid conclusions, which are further elaborated in a formal report format. Finally, the report covers information processing tools and the critical path for effective decision-making, along with the application of financial tools to support business strategies. The conclusion summarizes the key findings and their implications for Balti Palace's expansion strategy.
Business Decision Making
Paraphrase This Document
Need a fresh take? Get an instant paraphrase of this document with our AI Paraphraser
Table of Contents
INTRODUCTION...........................................................................................................................3
Task 1...............................................................................................................................................3
P1. Plan for collection of data:...............................................................................................3
P2 Survey methodologies:......................................................................................................4
1.3 Questionnaire for the collection of data...........................................................................5
2.1 Information for decision making:.....................................................................................6
2.2 Analysis by using measure of central tendency:..............................................................9
2.3 Measures of dispersion:..................................................................................................10
2.4 Quartiles, percentiles and correlation coefficient under this decision making:..............11
TASK 2..........................................................................................................................................11
3.1 Produce graphs in order to get the valid conclusion.......................................................11
3.2 Trend line analysis:.........................................................................................................13
3.3 Covered in PPT:.............................................................................................................13
3.4 Formal report:.................................................................................................................13
TASK 3..........................................................................................................................................14
4.1 Information processing tools:.........................................................................................14
4.2 Critical path:...................................................................................................................15
........................................................................................................................................................15
4.3 Use financial tools for making business decisions:........................................................15
CONCLUSION..............................................................................................................................16
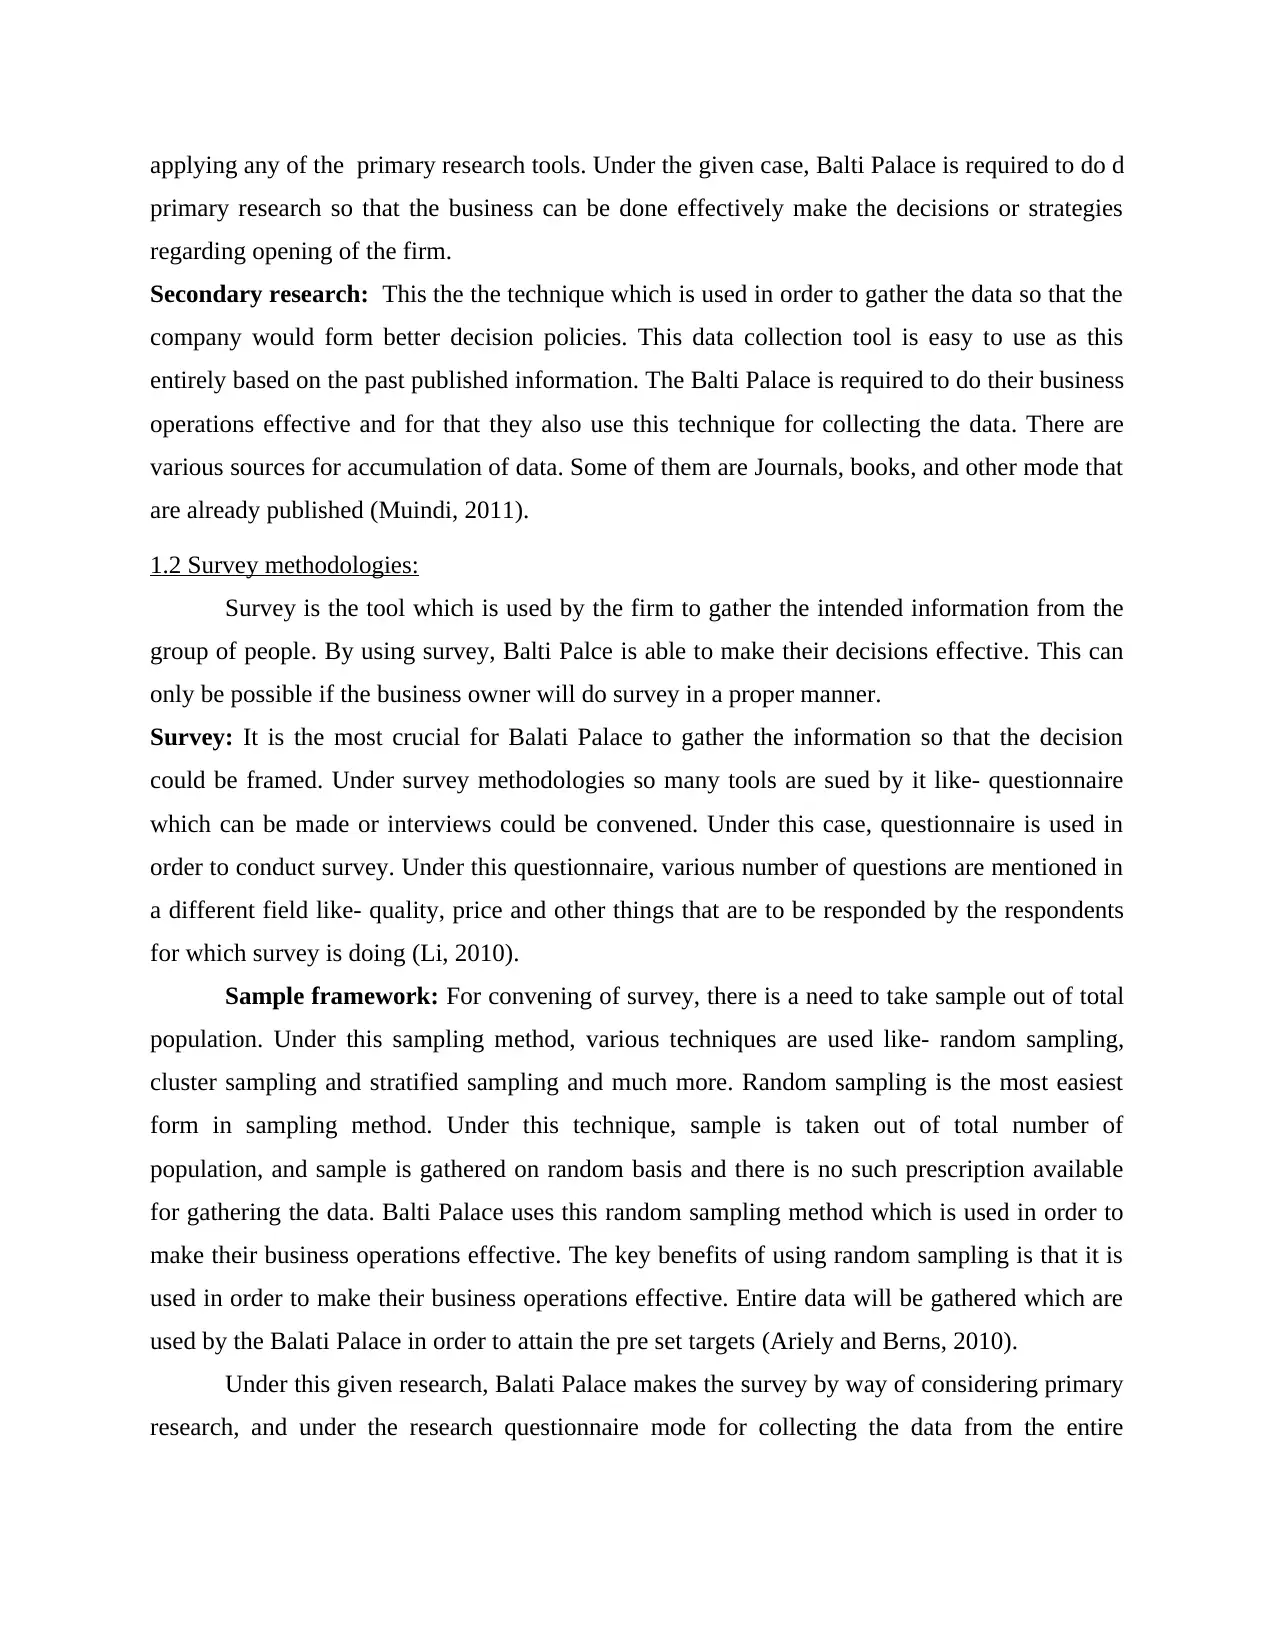
INTRODUCTION
Decision making is the crucial aspect for getting sustainable development. In this
competitive world, where everyone is looking to enhance their revenues by improving their
decisions through analysing customers and market. The decisions are taken after gone through
extensive research. The research is required to be done of entire market which are totally based
on the primary research or secondary research (Smith, Binns and Tushman, 2010). Balti place
needs to open their one branch in somewhere in London, and for that the business owner needs to
open proper research of potential market and then take business decisions so that Balti Palace
would able to get the sustainability. The Balti Palace also need to make their business operations
in an effective manner by way of making effective decisions.
Task 1
1.1. Plan for collection of data:
Each company is required to do market survey in order to get the potential outcomes of
the intended market. Balati palace is planning to expand its operations by setting up a new
branch somewhere in London, and for that it's business owner needs to have research properly in
order to make business operations effective. Basically, there are two research methods I.e,
primary and secondary. It is upto the company's analysts whether they opt primary methods for
market research or go for secondary market. If the data requirement is little then the company
needs to go for primary research method for collection of data from the potential market
(Nielsen, B. B and Nielsen, S., 2011). And if the data requirement is huge then in that case,
company will go for secondary data method. These methods are defined in details hereunder:
Primary research method: Primary data is the fresh data and it gives exclusive attention to the
intended information. At the time of gathering primary data, company requires to pay attention.
As, this technique for collecting data is so costly. The many of the company do not opt this
technique for collecting data. The data collecting by using primary research takes so much time.
The intended company needs to make their research activity of the potential market by way of
considering primary research methods so that the reliable information can be gathered, on the
basis of that reliable information, company would frame effective decisions. There are various
sources through which the data can be gathered using primary research method. These are:
observation, interviews, questionnaire and so on. Primary research can be done by way of
⊘ This is a preview!⊘
Do you want full access?
Subscribe today to unlock all pages.
Trusted by 1+ million students worldwide
applying any of the primary research tools. Under the given case, Balti Palace is required to do d
primary research so that the business can be done effectively make the decisions or strategies
regarding opening of the firm.
Secondary research: This the the technique which is used in order to gather the data so that the
company would form better decision policies. This data collection tool is easy to use as this
entirely based on the past published information. The Balti Palace is required to do their business
operations effective and for that they also use this technique for collecting the data. There are
various sources for accumulation of data. Some of them are Journals, books, and other mode that
are already published (Muindi, 2011).
1.2 Survey methodologies:
Survey is the tool which is used by the firm to gather the intended information from the
group of people. By using survey, Balti Palce is able to make their decisions effective. This can
only be possible if the business owner will do survey in a proper manner.
Survey: It is the most crucial for Balati Palace to gather the information so that the decision
could be framed. Under survey methodologies so many tools are sued by it like- questionnaire
which can be made or interviews could be convened. Under this case, questionnaire is used in
order to conduct survey. Under this questionnaire, various number of questions are mentioned in
a different field like- quality, price and other things that are to be responded by the respondents
for which survey is doing (Li, 2010).
Sample framework: For convening of survey, there is a need to take sample out of total
population. Under this sampling method, various techniques are used like- random sampling,
cluster sampling and stratified sampling and much more. Random sampling is the most easiest
form in sampling method. Under this technique, sample is taken out of total number of
population, and sample is gathered on random basis and there is no such prescription available
for gathering the data. Balti Palace uses this random sampling method which is used in order to
make their business operations effective. The key benefits of using random sampling is that it is
used in order to make their business operations effective. Entire data will be gathered which are
used by the Balati Palace in order to attain the pre set targets (Ariely and Berns, 2010).
Under this given research, Balati Palace makes the survey by way of considering primary
research, and under the research questionnaire mode for collecting the data from the entire
Paraphrase This Document
Need a fresh take? Get an instant paraphrase of this document with our AI Paraphraser
market. They also choose 40 respondents out of the total market population in order to make
effective survey. For that, they are going to used random sampling method.
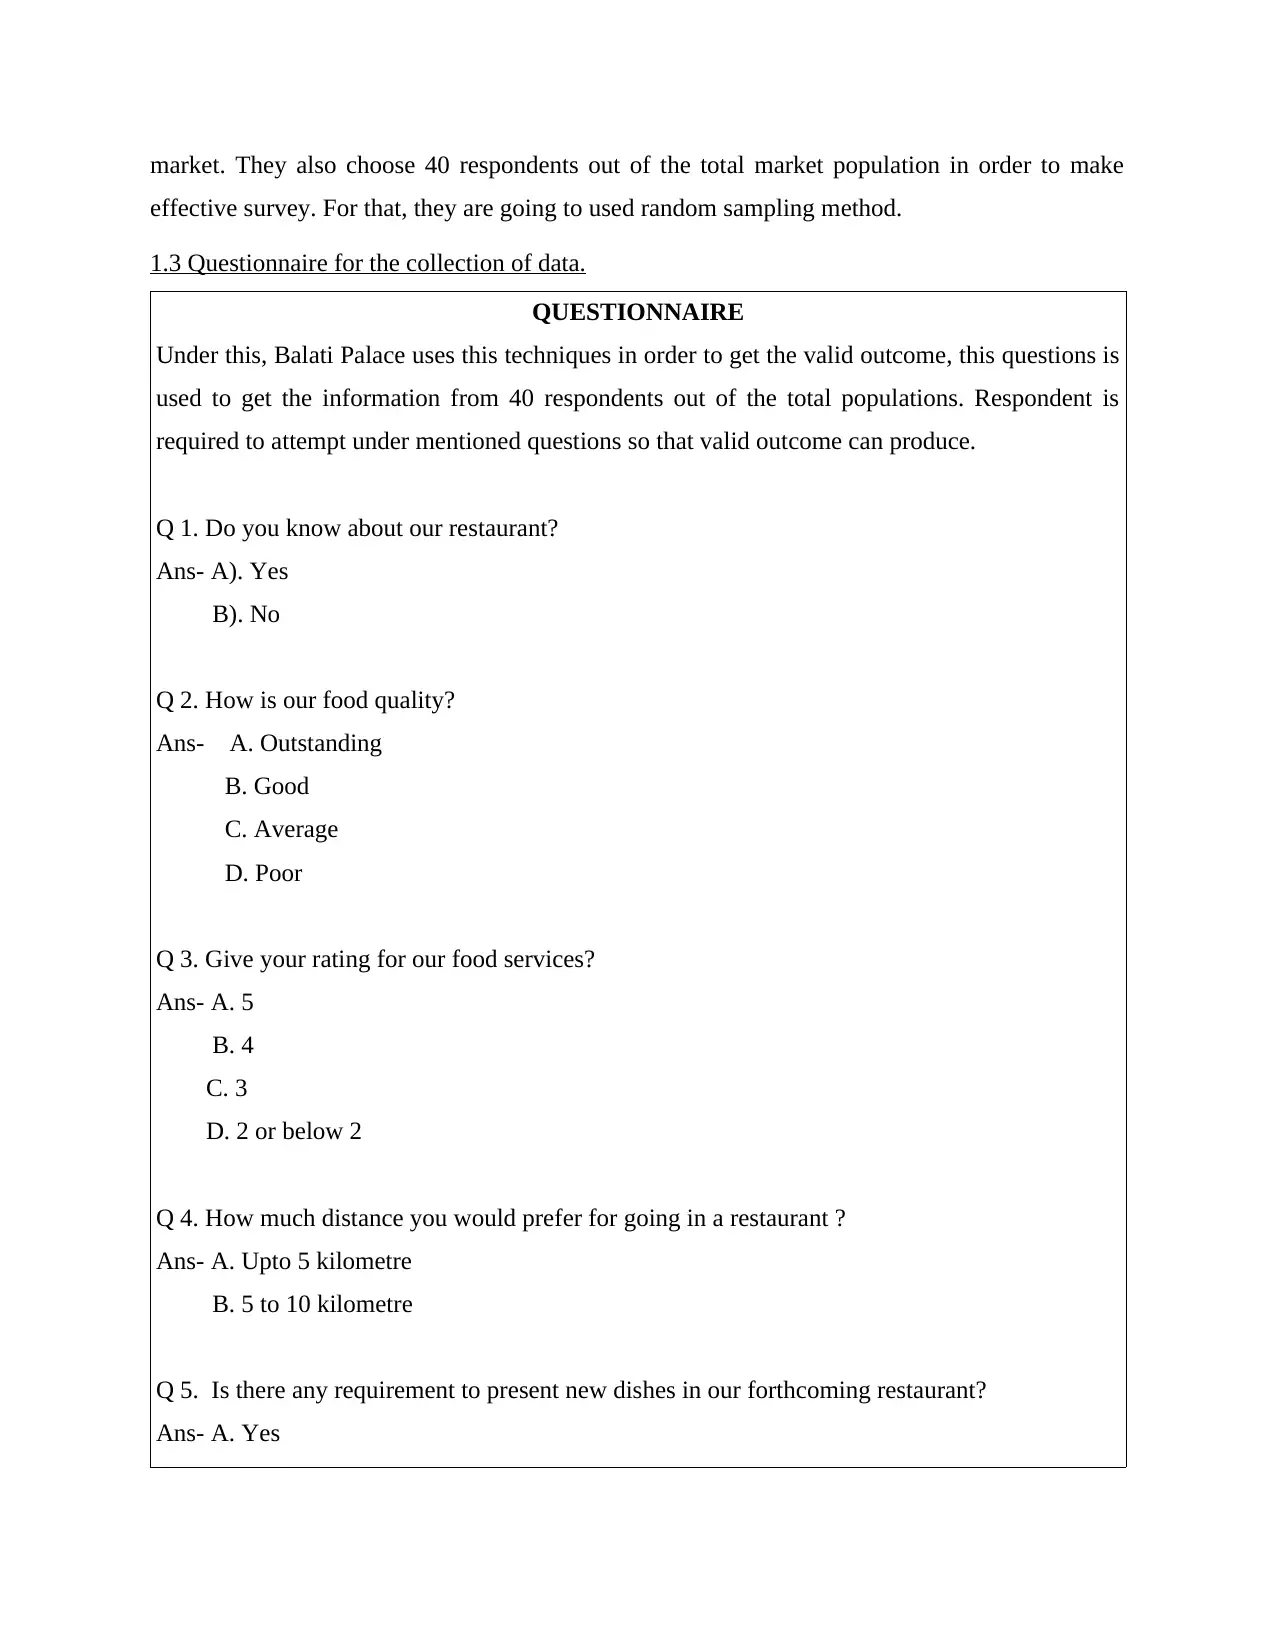
1.3 Questionnaire for the collection of data.
QUESTIONNAIRE
Under this, Balati Palace uses this techniques in order to get the valid outcome, this questions is
used to get the information from 40 respondents out of the total populations. Respondent is
required to attempt under mentioned questions so that valid outcome can produce.
Q 1. Do you know about our restaurant?
Ans- A). Yes
B). No
Q 2. How is our food quality?
Ans- A. Outstanding
B. Good
C. Average
D. Poor
Q 3. Give your rating for our food services?
Ans- A. 5
B. 4
C. 3
D. 2 or below 2
Q 4. How much distance you would prefer for going in a restaurant ?
Ans- A. Upto 5 kilometre
B. 5 to 10 kilometre
Q 5. Is there any requirement to present new dishes in our forthcoming restaurant?
Ans- A. Yes
effective survey. For that, they are going to used random sampling method.
1.3 Questionnaire for the collection of data.
QUESTIONNAIRE
Under this, Balati Palace uses this techniques in order to get the valid outcome, this questions is
used to get the information from 40 respondents out of the total populations. Respondent is
required to attempt under mentioned questions so that valid outcome can produce.
Q 1. Do you know about our restaurant?
Ans- A). Yes
B). No
Q 2. How is our food quality?
Ans- A. Outstanding
B. Good
C. Average
D. Poor
Q 3. Give your rating for our food services?
Ans- A. 5
B. 4
C. 3
D. 2 or below 2
Q 4. How much distance you would prefer for going in a restaurant ?
Ans- A. Upto 5 kilometre
B. 5 to 10 kilometre
Q 5. Is there any requirement to present new dishes in our forthcoming restaurant?
Ans- A. Yes
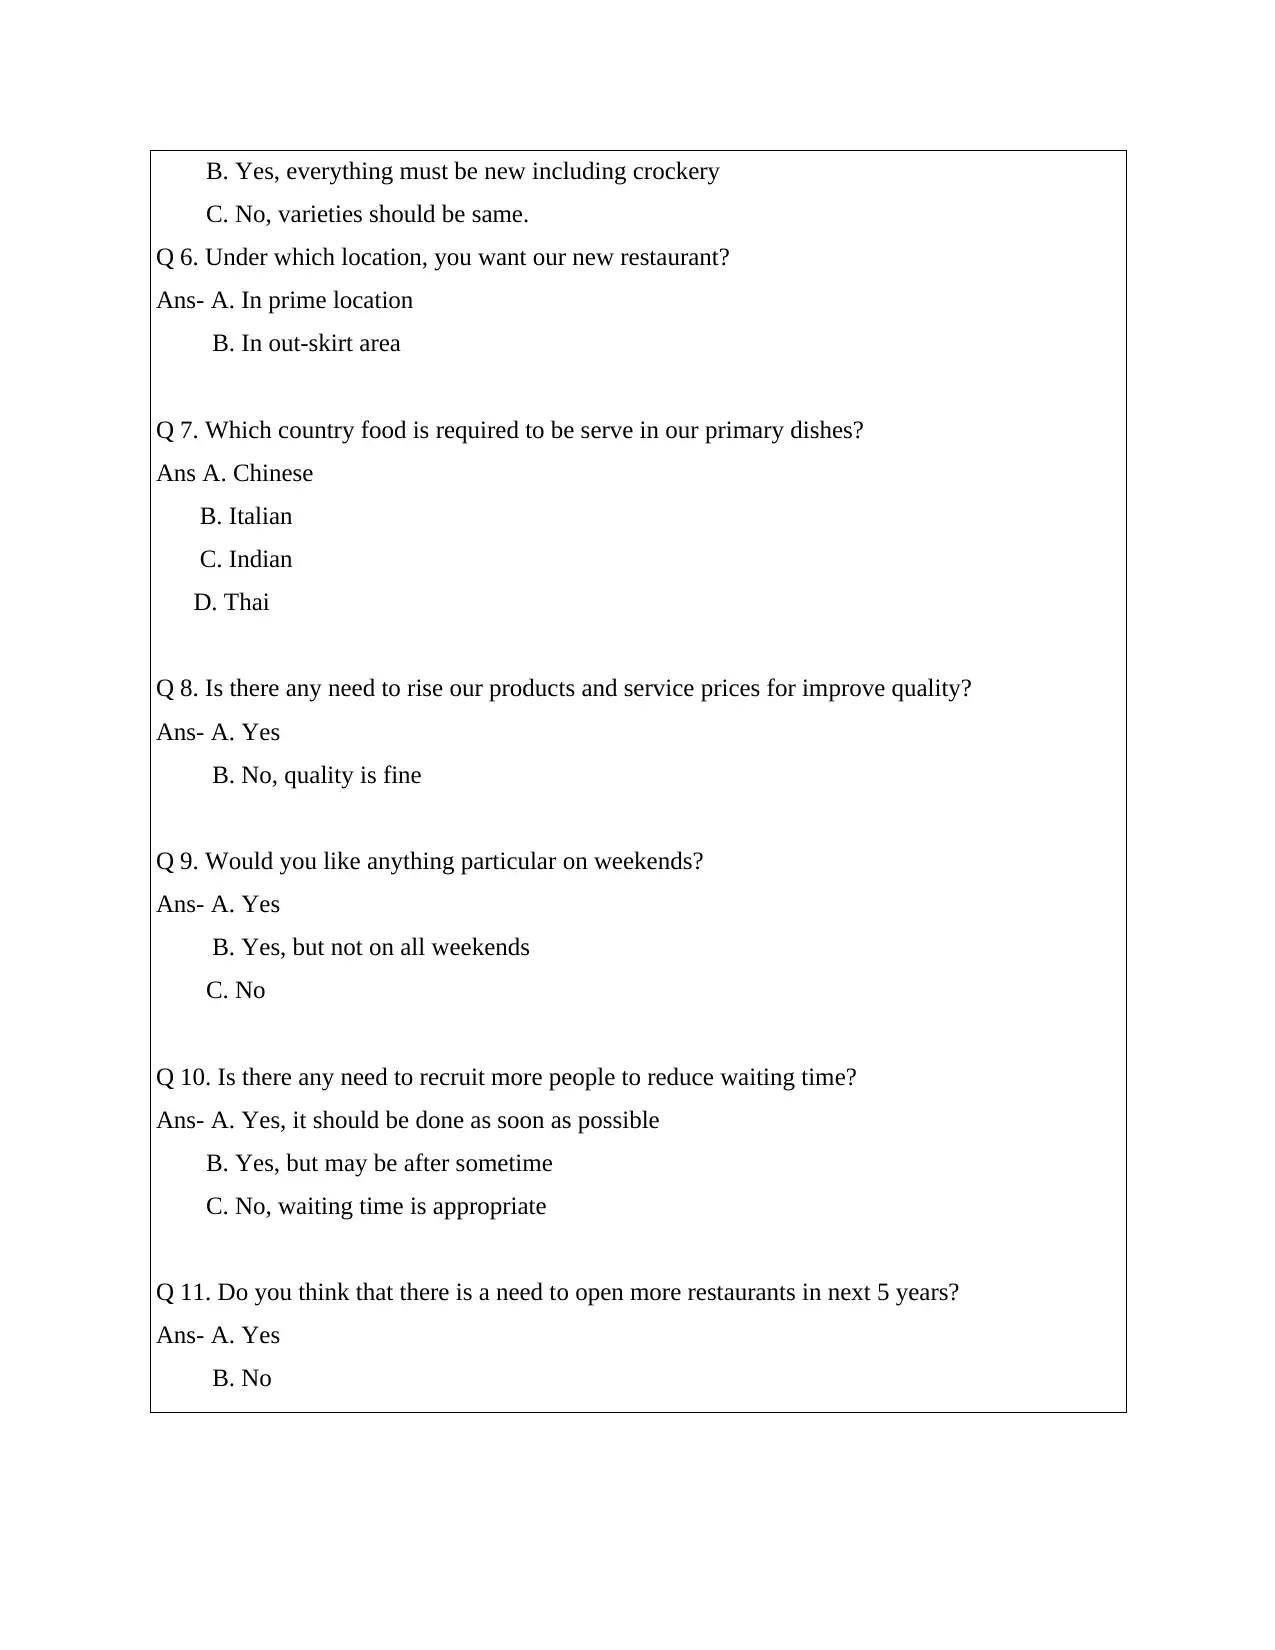
B. Yes, everything must be new including crockery
C. No, varieties should be same.
Q 6. Under which location, you want our new restaurant?
Ans- A. In prime location
B. In out-skirt area
Q 7. Which country food is required to be serve in our primary dishes?
Ans A. Chinese
B. Italian
C. Indian
D. Thai
Q 8. Is there any need to rise our products and service prices for improve quality?
Ans- A. Yes
B. No, quality is fine
Q 9. Would you like anything particular on weekends?
Ans- A. Yes
B. Yes, but not on all weekends
C. No
Q 10. Is there any need to recruit more people to reduce waiting time?
Ans- A. Yes, it should be done as soon as possible
B. Yes, but may be after sometime
C. No, waiting time is appropriate
Q 11. Do you think that there is a need to open more restaurants in next 5 years?
Ans- A. Yes
B. No
⊘ This is a preview!⊘
Do you want full access?
Subscribe today to unlock all pages.
Trusted by 1+ million students worldwide
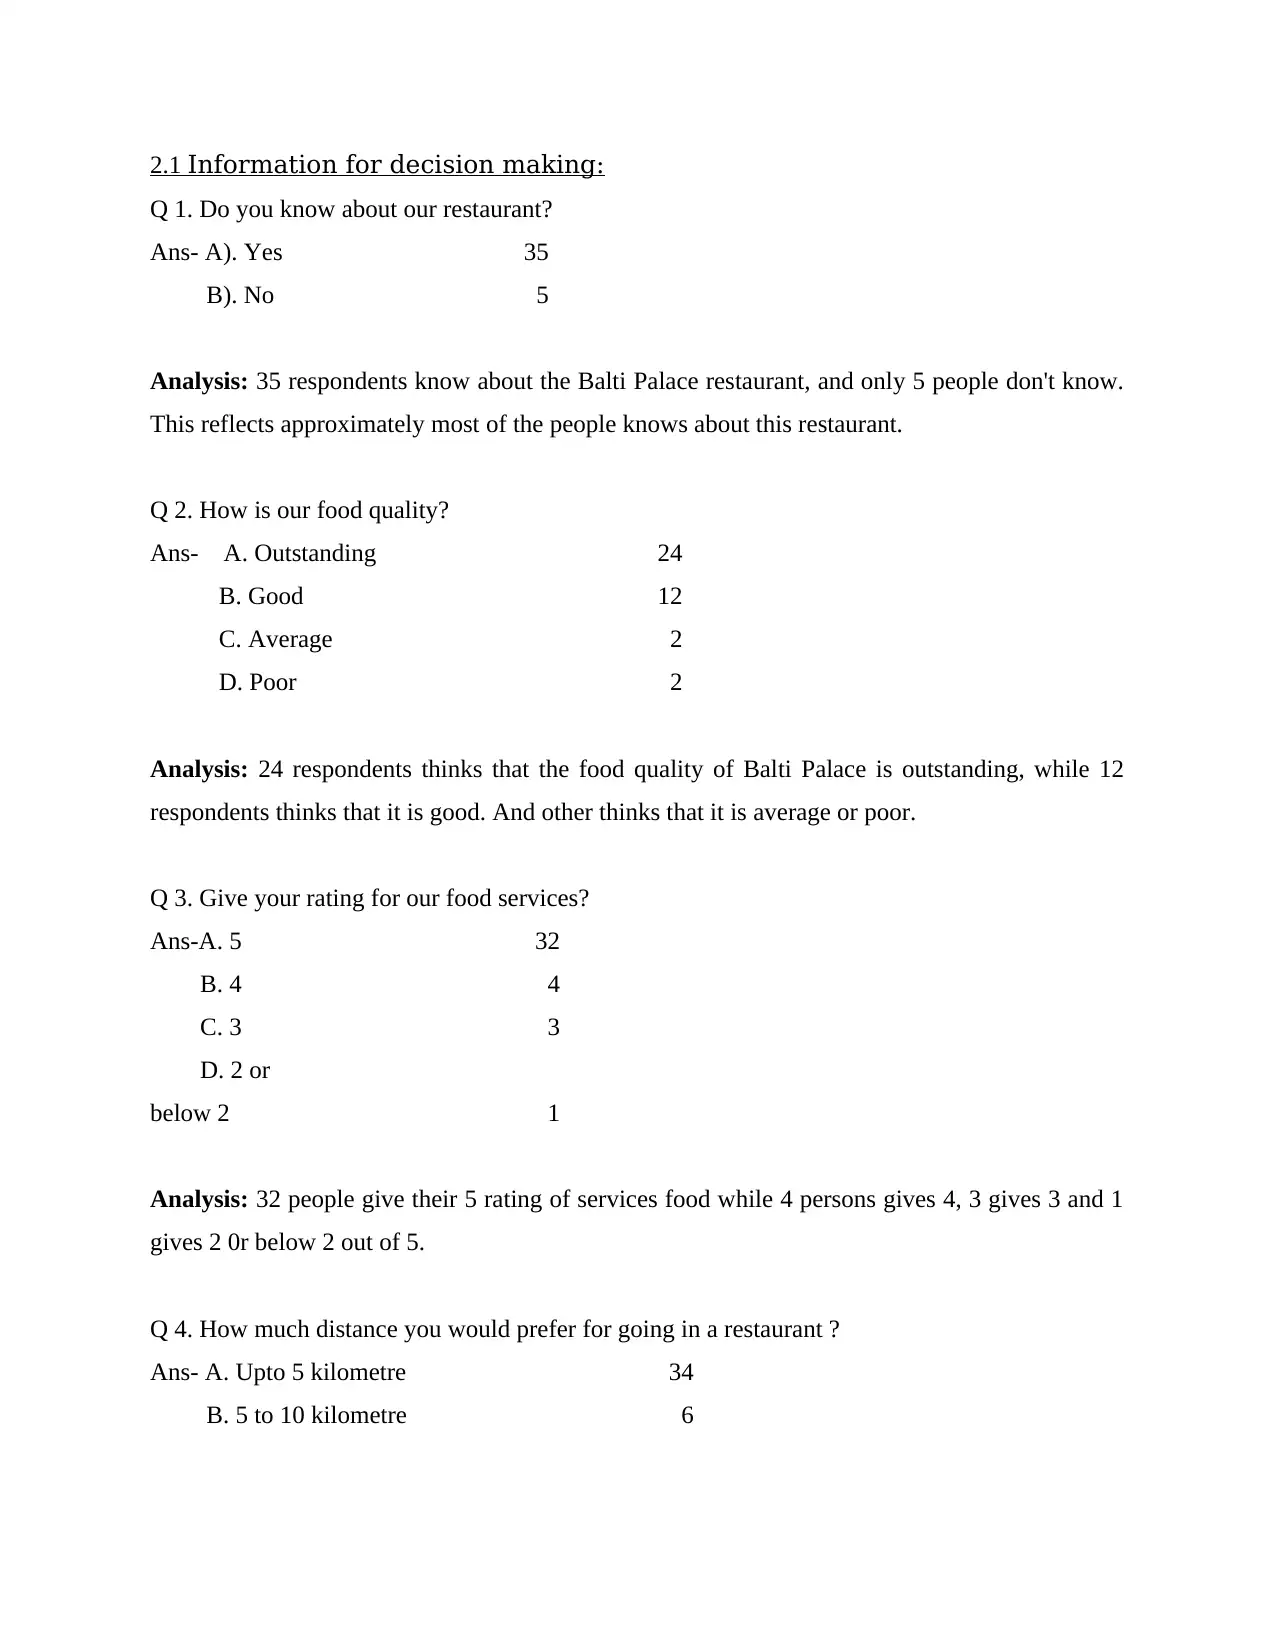
2.1 Information for decision making:
Q 1. Do you know about our restaurant?
Ans- A). Yes 35
B). No 5
Analysis: 35 respondents know about the Balti Palace restaurant, and only 5 people don't know.
This reflects approximately most of the people knows about this restaurant.
Q 2. How is our food quality?
Ans- A. Outstanding 24
B. Good 12
C. Average 2
D. Poor 2
Analysis: 24 respondents thinks that the food quality of Balti Palace is outstanding, while 12
respondents thinks that it is good. And other thinks that it is average or poor.
Q 3. Give your rating for our food services?
Ans-A. 5 32
B. 4 4
C. 3 3
D. 2 or
below 2 1
Analysis: 32 people give their 5 rating of services food while 4 persons gives 4, 3 gives 3 and 1
gives 2 0r below 2 out of 5.
Q 4. How much distance you would prefer for going in a restaurant ?
Ans- A. Upto 5 kilometre 34
B. 5 to 10 kilometre 6
Paraphrase This Document
Need a fresh take? Get an instant paraphrase of this document with our AI Paraphraser
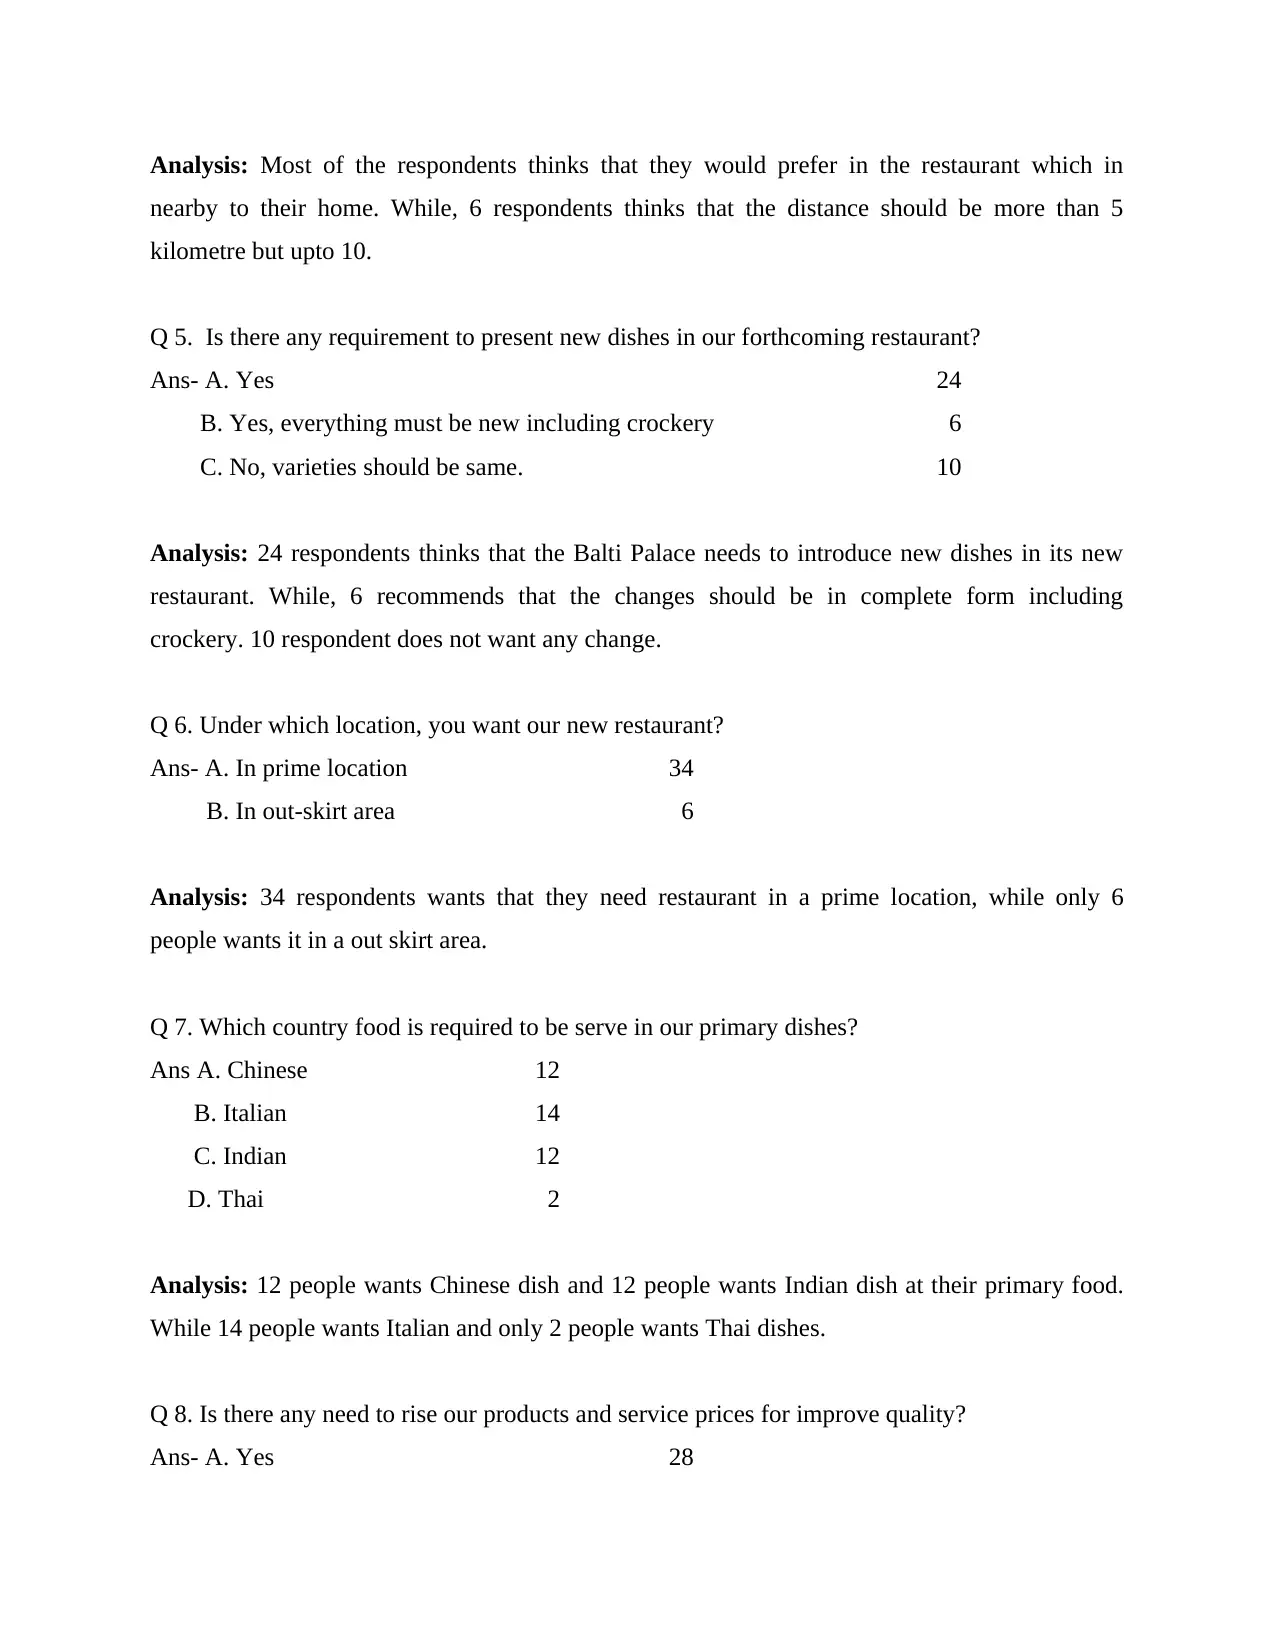
Analysis: Most of the respondents thinks that they would prefer in the restaurant which in
nearby to their home. While, 6 respondents thinks that the distance should be more than 5
kilometre but upto 10.
Q 5. Is there any requirement to present new dishes in our forthcoming restaurant?
Ans- A. Yes 24
B. Yes, everything must be new including crockery 6
C. No, varieties should be same. 10
Analysis: 24 respondents thinks that the Balti Palace needs to introduce new dishes in its new
restaurant. While, 6 recommends that the changes should be in complete form including
crockery. 10 respondent does not want any change.
Q 6. Under which location, you want our new restaurant?
Ans- A. In prime location 34
B. In out-skirt area 6
Analysis: 34 respondents wants that they need restaurant in a prime location, while only 6
people wants it in a out skirt area.
Q 7. Which country food is required to be serve in our primary dishes?
Ans A. Chinese 12
B. Italian 14
C. Indian 12
D. Thai 2
Analysis: 12 people wants Chinese dish and 12 people wants Indian dish at their primary food.
While 14 people wants Italian and only 2 people wants Thai dishes.
Q 8. Is there any need to rise our products and service prices for improve quality?
Ans- A. Yes 28
B. No, quality is fine 12
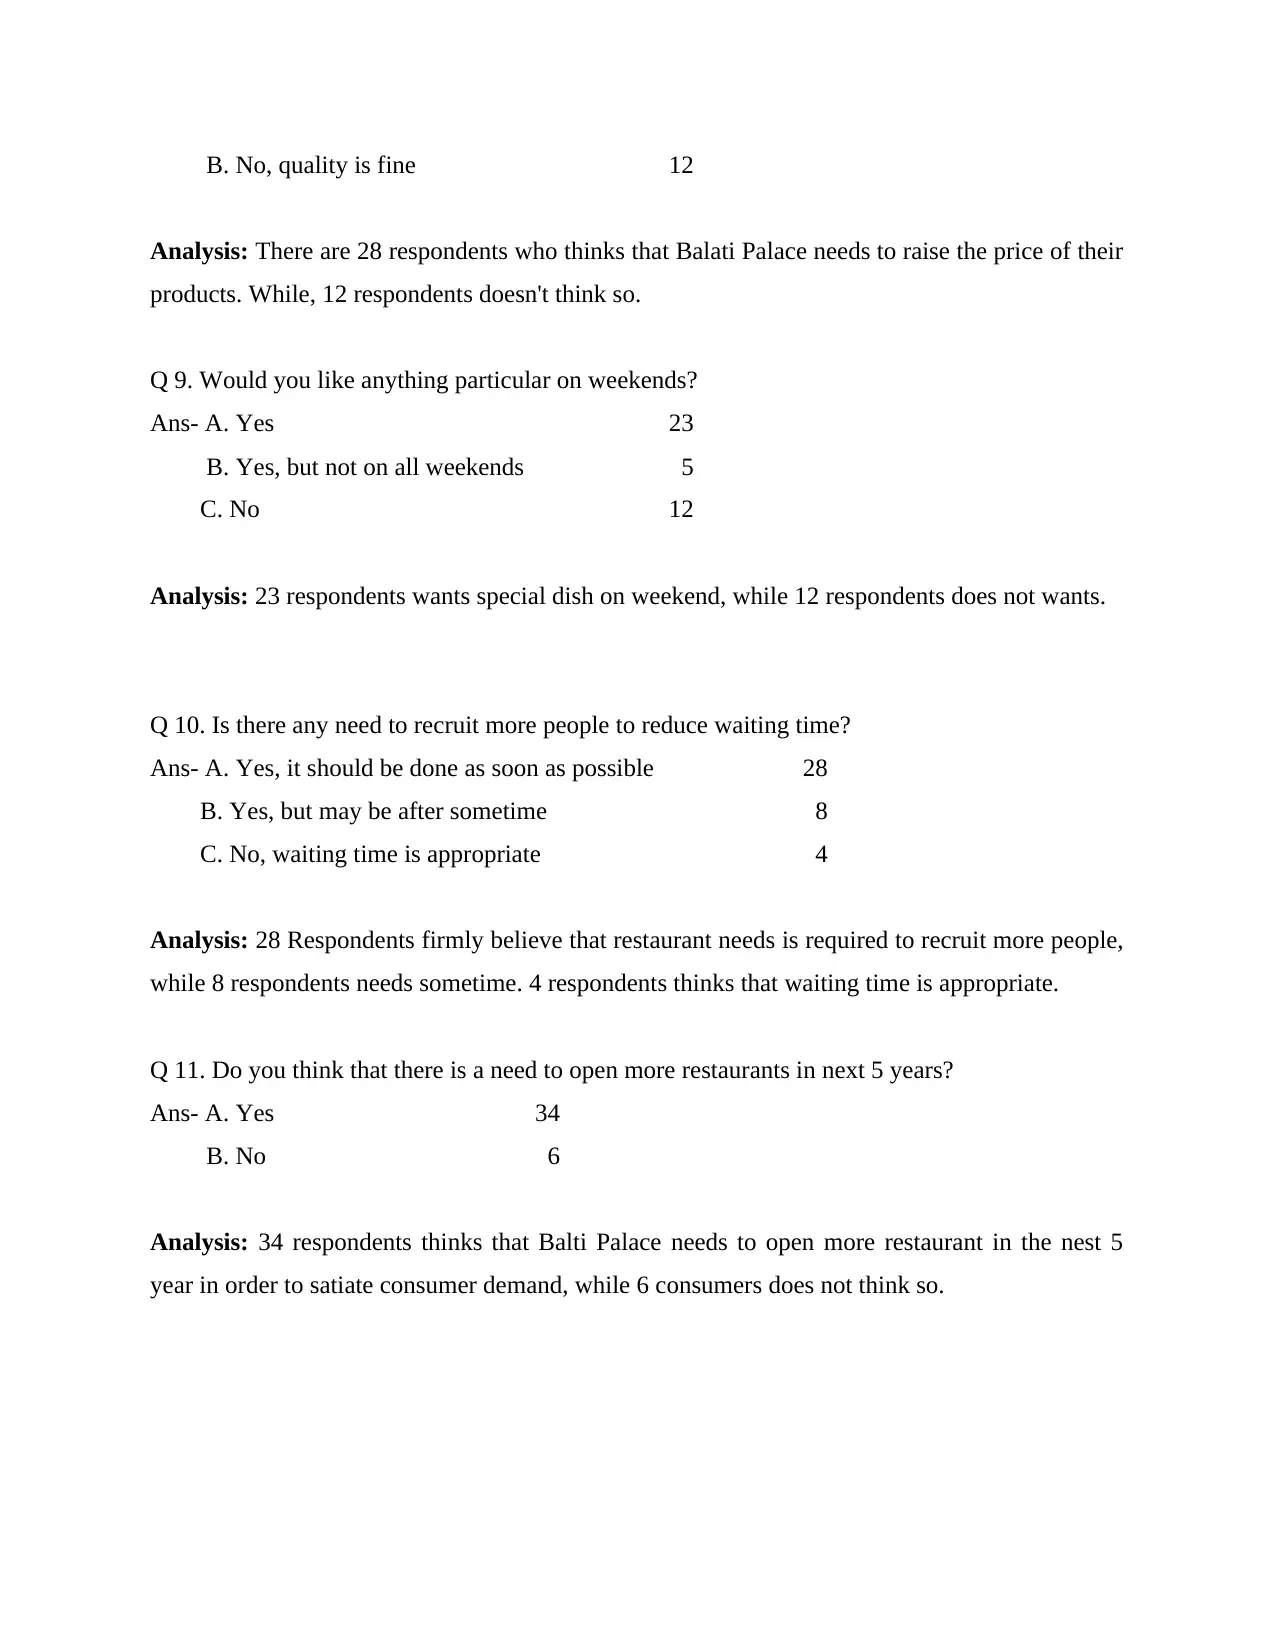
Analysis: There are 28 respondents who thinks that Balati Palace needs to raise the price of their
products. While, 12 respondents doesn't think so.
Q 9. Would you like anything particular on weekends?
Ans- A. Yes 23
B. Yes, but not on all weekends 5
C. No 12
Analysis: 23 respondents wants special dish on weekend, while 12 respondents does not wants.
Q 10. Is there any need to recruit more people to reduce waiting time?
Ans- A. Yes, it should be done as soon as possible 28
B. Yes, but may be after sometime 8
C. No, waiting time is appropriate 4
Analysis: 28 Respondents firmly believe that restaurant needs is required to recruit more people,
while 8 respondents needs sometime. 4 respondents thinks that waiting time is appropriate.
Q 11. Do you think that there is a need to open more restaurants in next 5 years?
Ans- A. Yes 34
B. No 6
Analysis: 34 respondents thinks that Balti Palace needs to open more restaurant in the nest 5
year in order to satiate consumer demand, while 6 consumers does not think so.
⊘ This is a preview!⊘
Do you want full access?
Subscribe today to unlock all pages.
Trusted by 1+ million students worldwide
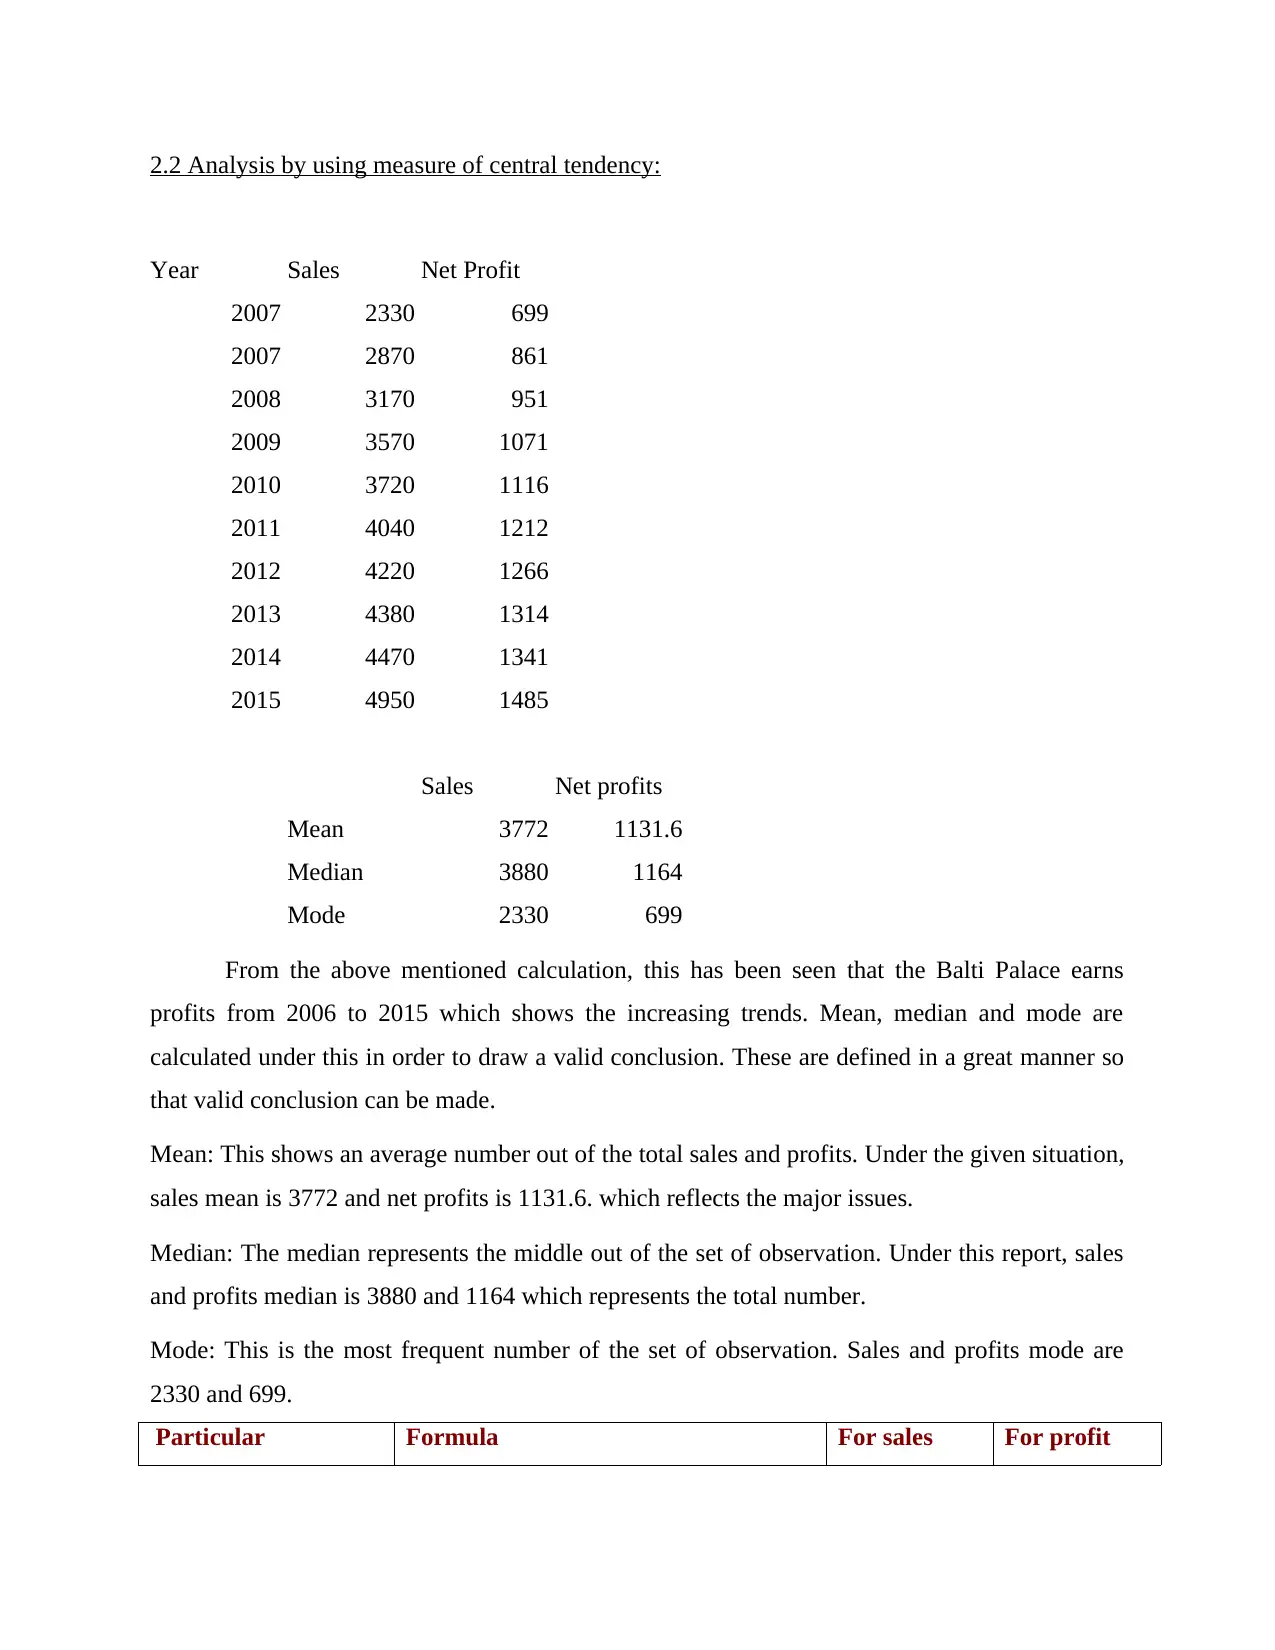
2.2 Analysis by using measure of central tendency:
Year Sales Net Profit
2007 2330 699
2007 2870 861
2008 3170 951
2009 3570 1071
2010 3720 1116
2011 4040 1212
2012 4220 1266
2013 4380 1314
2014 4470 1341
2015 4950 1485
Sales Net profits
Mean 3772 1131.6
Median 3880 1164
Mode 2330 699
From the above mentioned calculation, this has been seen that the Balti Palace earns
profits from 2006 to 2015 which shows the increasing trends. Mean, median and mode are
calculated under this in order to draw a valid conclusion. These are defined in a great manner so
that valid conclusion can be made.
Mean: This shows an average number out of the total sales and profits. Under the given situation,
sales mean is 3772 and net profits is 1131.6. which reflects the major issues.
Median: The median represents the middle out of the set of observation. Under this report, sales
and profits median is 3880 and 1164 which represents the total number.
Mode: This is the most frequent number of the set of observation. Sales and profits mode are
2330 and 699.
Particular Formula For sales For profit
Paraphrase This Document
Need a fresh take? Get an instant paraphrase of this document with our AI Paraphraser
Median(In case of
even number values) {L1 + (N/2) – c/F}*i]
3880 1164
Mean ∑X/N 3772 1131.6
Mode L + h ( fm – f1 / 2fm – f1 - f2 ) 2330 699
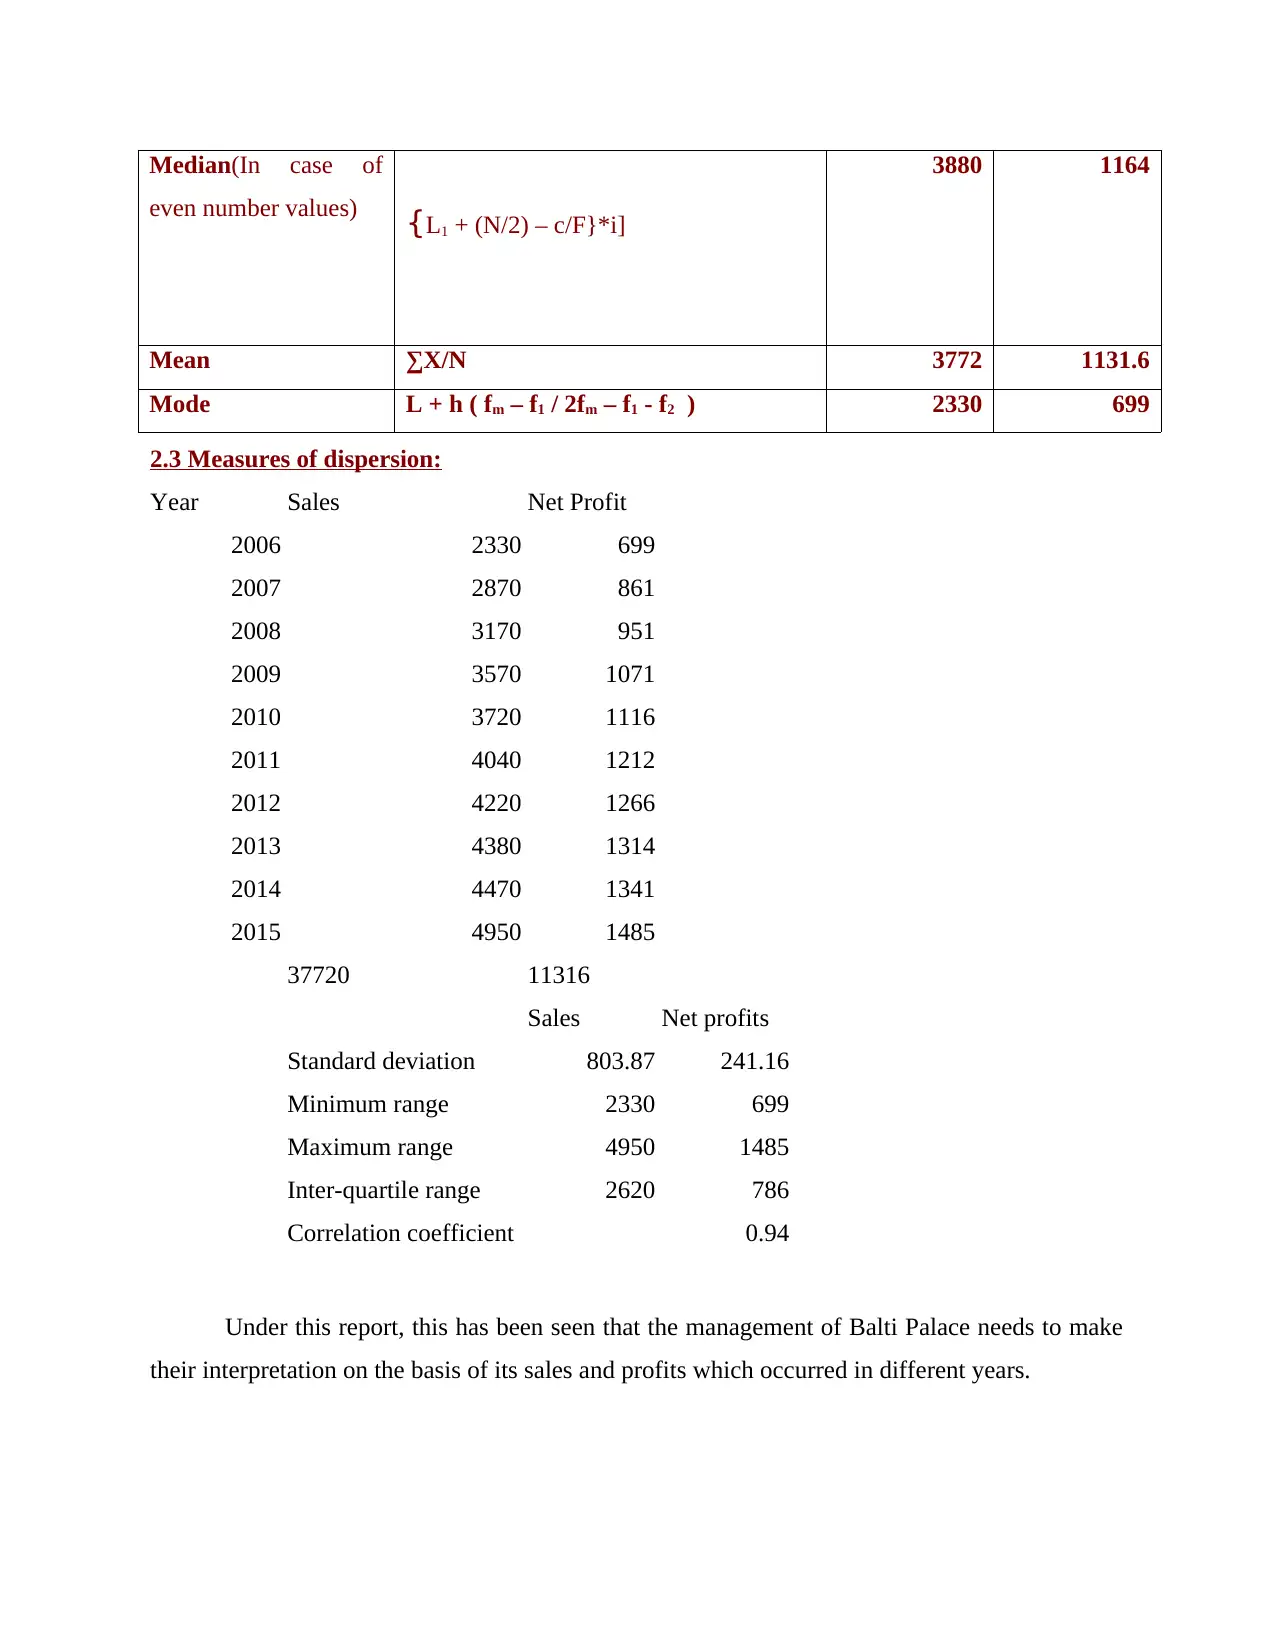
2.3 Measures of dispersion:
Year Sales Net Profit
2006 2330 699
2007 2870 861
2008 3170 951
2009 3570 1071
2010 3720 1116
2011 4040 1212
2012 4220 1266
2013 4380 1314
2014 4470 1341
2015 4950 1485
37720 11316
Sales Net profits
Standard deviation 803.87 241.16
Minimum range 2330 699
Maximum range 4950 1485
Inter-quartile range 2620 786
Correlation coefficient 0.94
Under this report, this has been seen that the management of Balti Palace needs to make
their interpretation on the basis of its sales and profits which occurred in different years.
even number values) {L1 + (N/2) – c/F}*i]
3880 1164
Mean ∑X/N 3772 1131.6
Mode L + h ( fm – f1 / 2fm – f1 - f2 ) 2330 699
2.3 Measures of dispersion:
Year Sales Net Profit
2006 2330 699
2007 2870 861
2008 3170 951
2009 3570 1071
2010 3720 1116
2011 4040 1212
2012 4220 1266
2013 4380 1314
2014 4470 1341
2015 4950 1485
37720 11316
Sales Net profits
Standard deviation 803.87 241.16
Minimum range 2330 699
Maximum range 4950 1485
Inter-quartile range 2620 786
Correlation coefficient 0.94
Under this report, this has been seen that the management of Balti Palace needs to make
their interpretation on the basis of its sales and profits which occurred in different years.
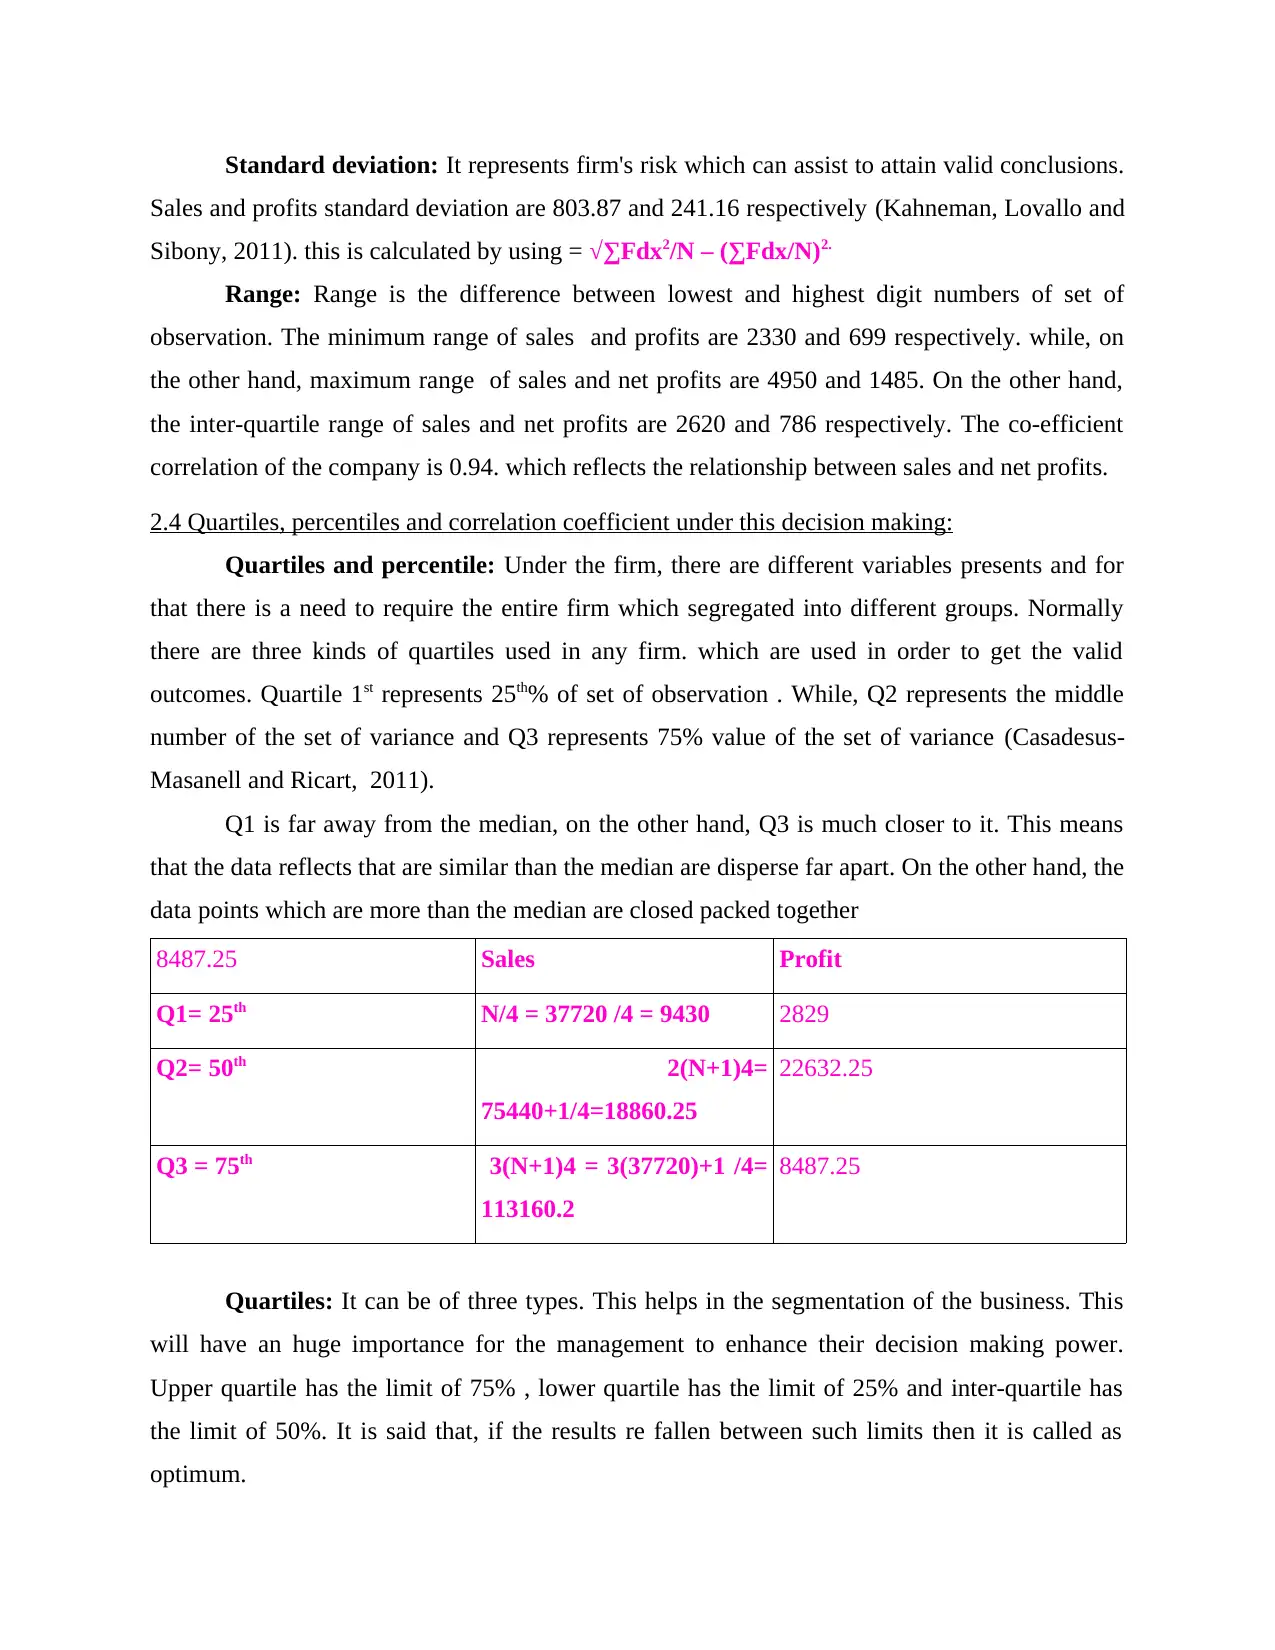
Standard deviation: It represents firm's risk which can assist to attain valid conclusions.
Sales and profits standard deviation are 803.87 and 241.16 respectively (Kahneman, Lovallo and
Sibony, 2011). this is calculated by using = √∑Fdx2/N – (∑Fdx/N)2.
Range: Range is the difference between lowest and highest digit numbers of set of
observation. The minimum range of sales and profits are 2330 and 699 respectively. while, on
the other hand, maximum range of sales and net profits are 4950 and 1485. On the other hand,
the inter-quartile range of sales and net profits are 2620 and 786 respectively. The co-efficient
correlation of the company is 0.94. which reflects the relationship between sales and net profits.
2.4 Quartiles, percentiles and correlation coefficient under this decision making:
Quartiles and percentile: Under the firm, there are different variables presents and for
that there is a need to require the entire firm which segregated into different groups. Normally
there are three kinds of quartiles used in any firm. which are used in order to get the valid
outcomes. Quartile 1st represents 25th% of set of observation . While, Q2 represents the middle
number of the set of variance and Q3 represents 75% value of the set of variance (Casadesus-
Masanell and Ricart, 2011).
Q1 is far away from the median, on the other hand, Q3 is much closer to it. This means
that the data reflects that are similar than the median are disperse far apart. On the other hand, the
data points which are more than the median are closed packed together
8487.25 Sales Profit
Q1= 25th N/4 = 37720 /4 = 9430 2829
Q2= 50th 2(N+1)4=
75440+1/4=18860.25
22632.25
Q3 = 75th 3(N+1)4 = 3(37720)+1 /4=
113160.2
8487.25
Quartiles: It can be of three types. This helps in the segmentation of the business. This
will have an huge importance for the management to enhance their decision making power.
Upper quartile has the limit of 75% , lower quartile has the limit of 25% and inter-quartile has
the limit of 50%. It is said that, if the results re fallen between such limits then it is called as
optimum.
⊘ This is a preview!⊘
Do you want full access?
Subscribe today to unlock all pages.
Trusted by 1+ million students worldwide
1 out of 32
Related Documents


Your All-in-One AI-Powered Toolkit for Academic Success.
+13062052269
info@desklib.com
Available 24*7 on WhatsApp / Email
![[object Object]](/_next/static/media/star-bottom.7253800d.svg)
Unlock your academic potential
Copyright © 2020–2026 A2Z Services. All Rights Reserved. Developed and managed by ZUCOL.