Business Decision Making Analysis: Balti Palace Expansion Report

Verified

Added on  2023/03/20

|16
|431
|68
Report
AI Summary
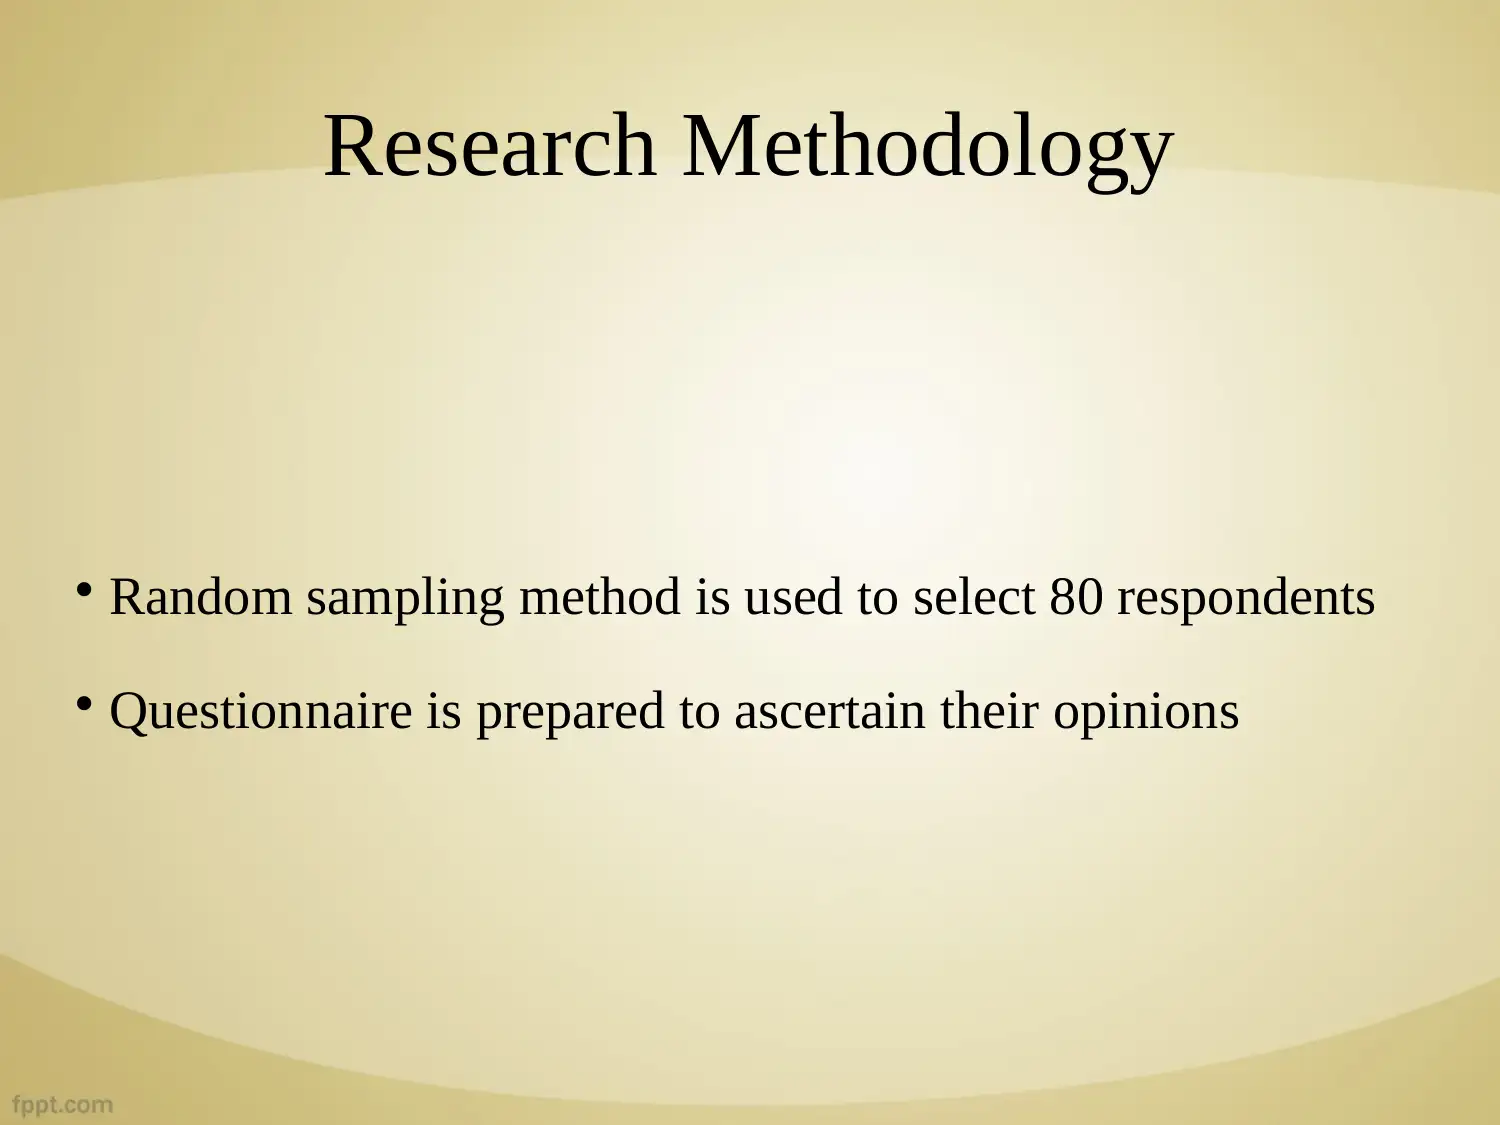
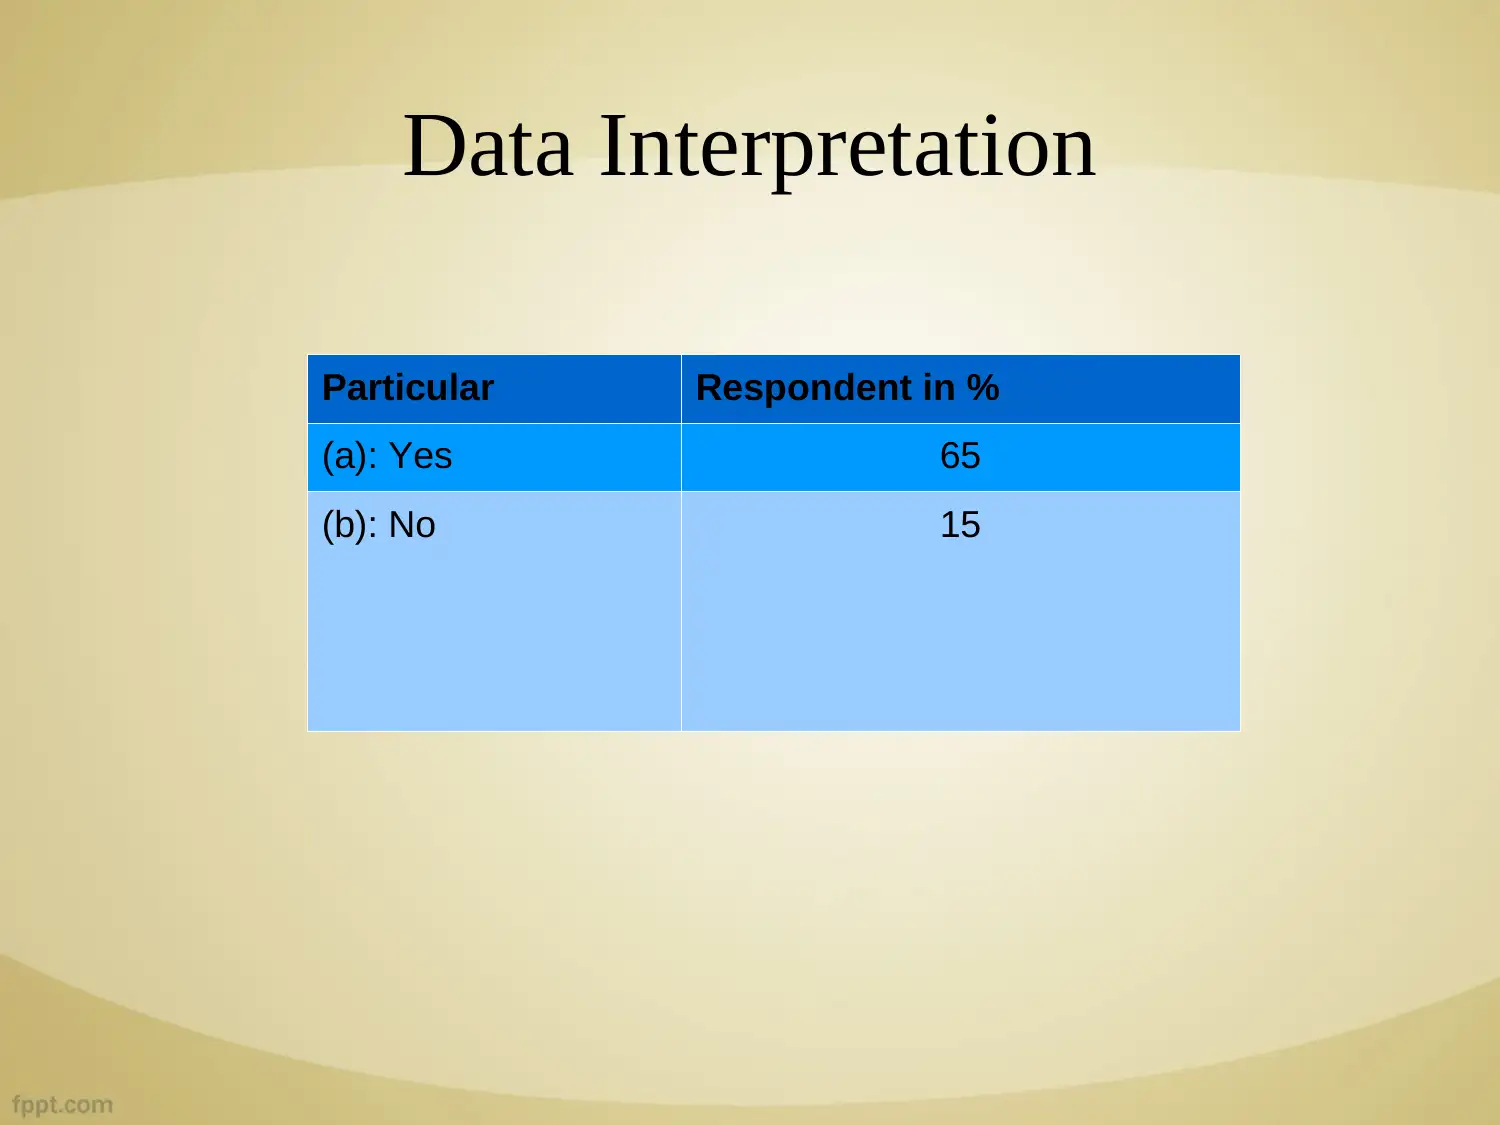
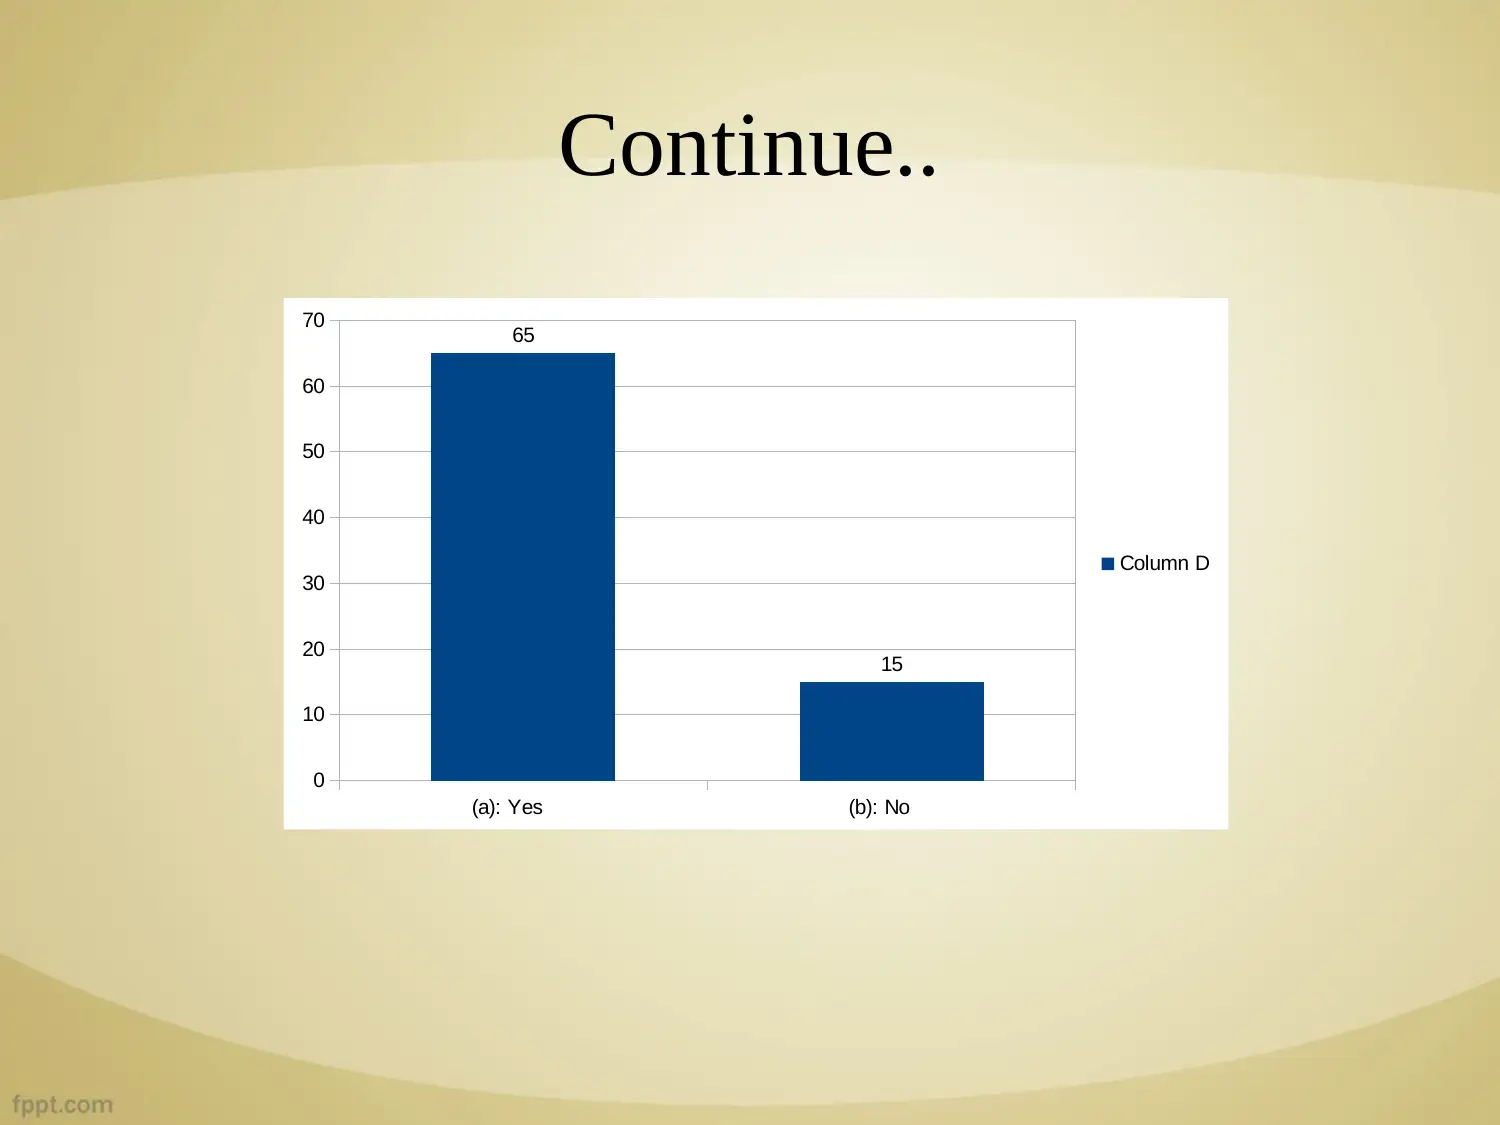
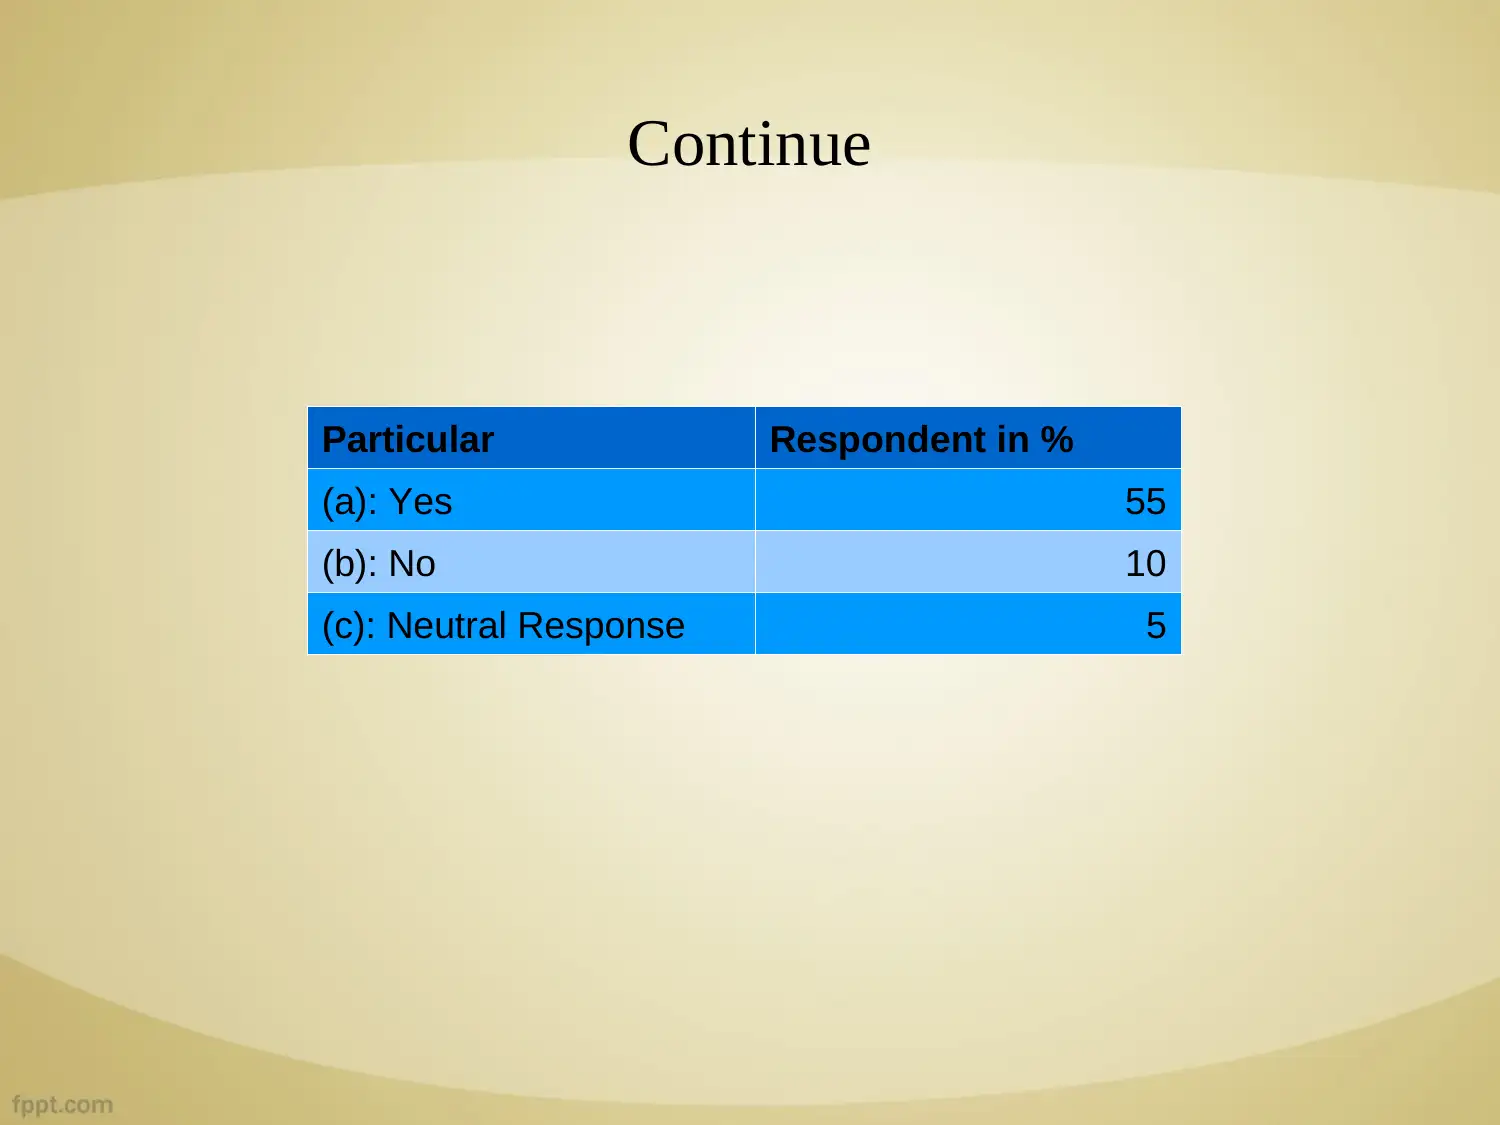
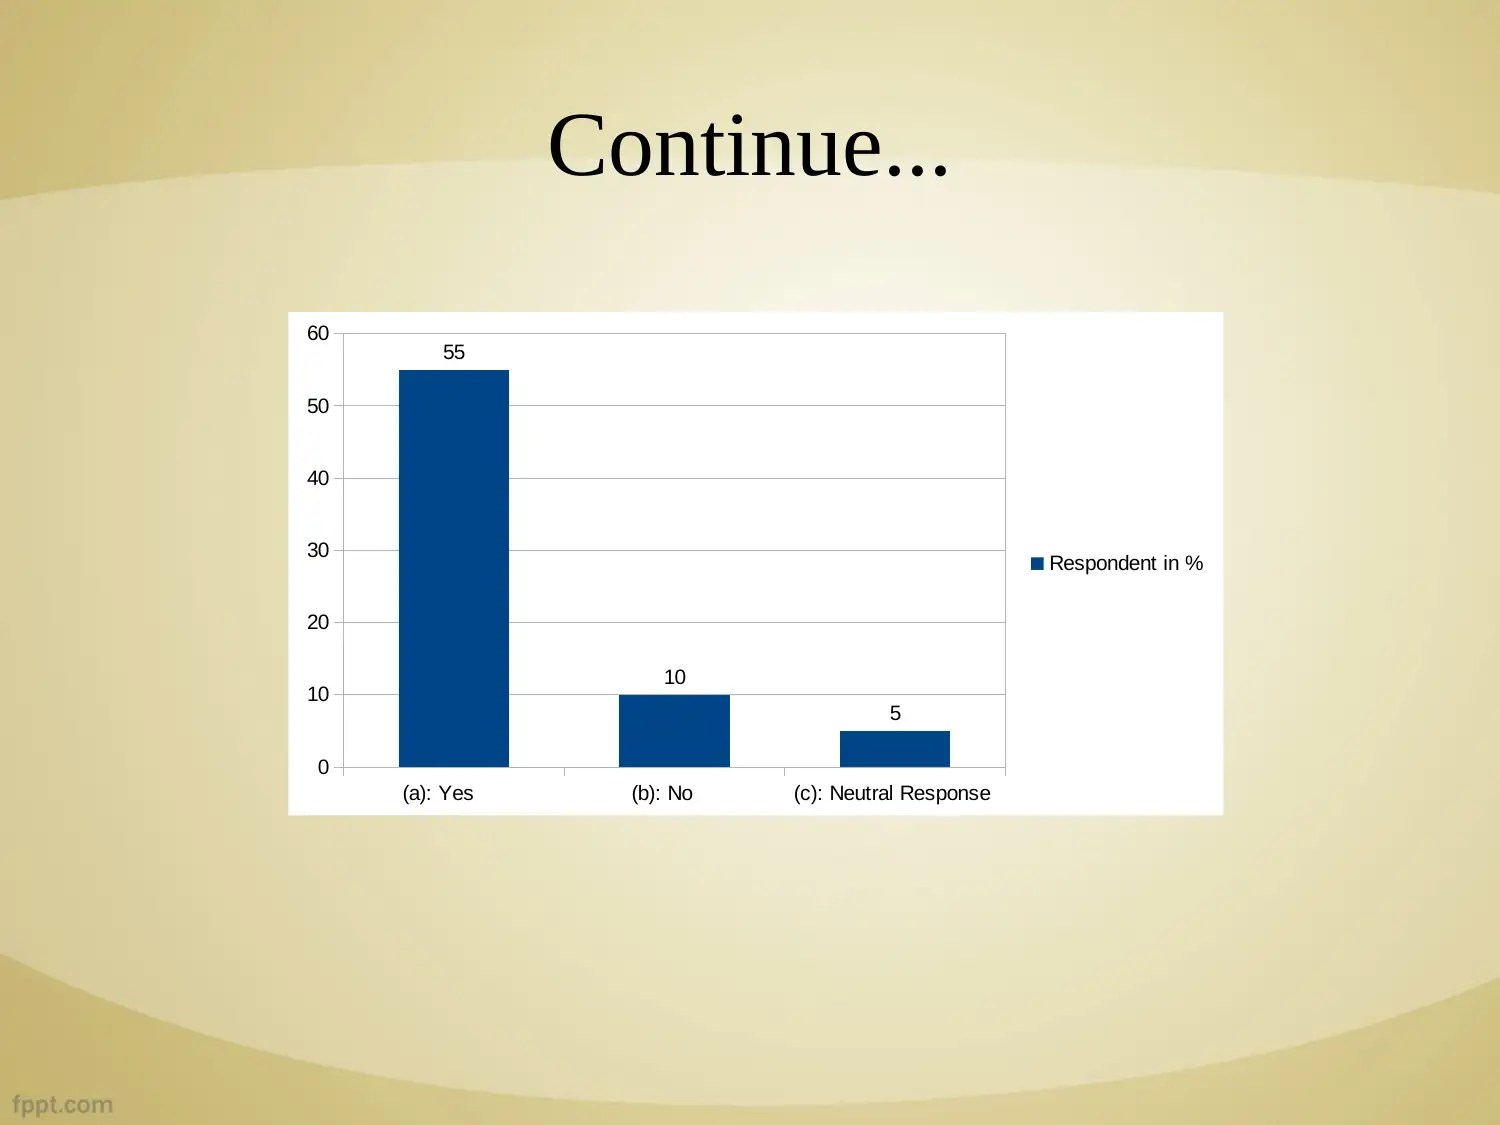
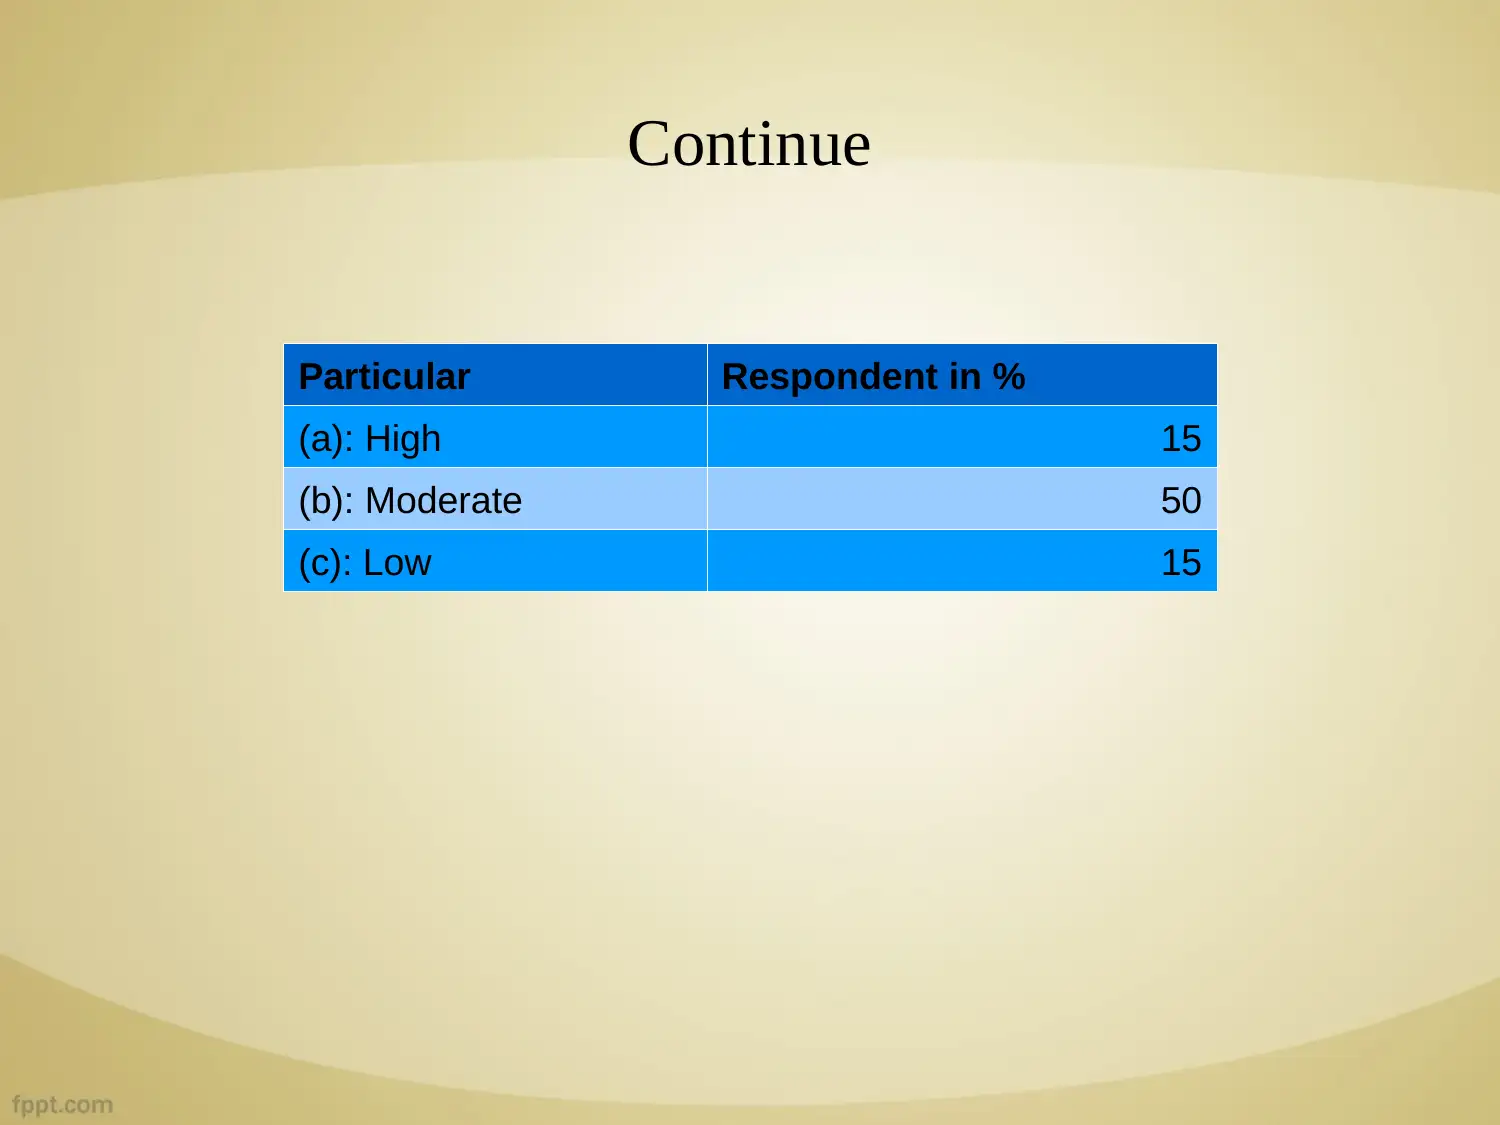
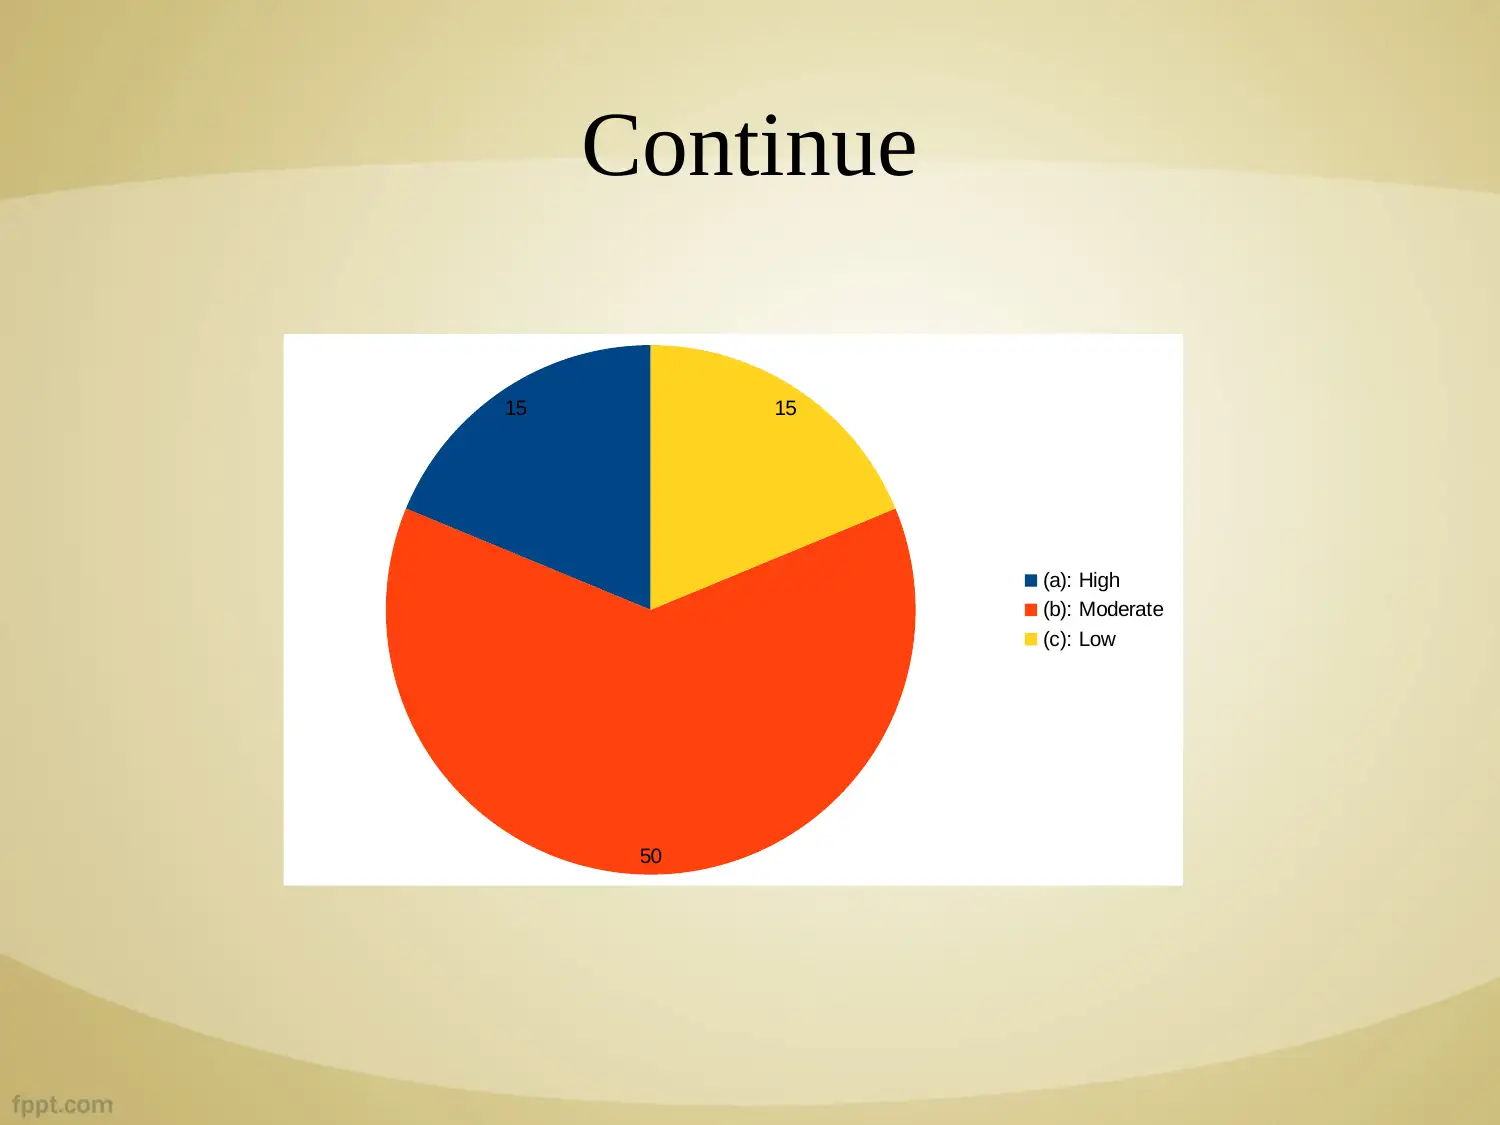
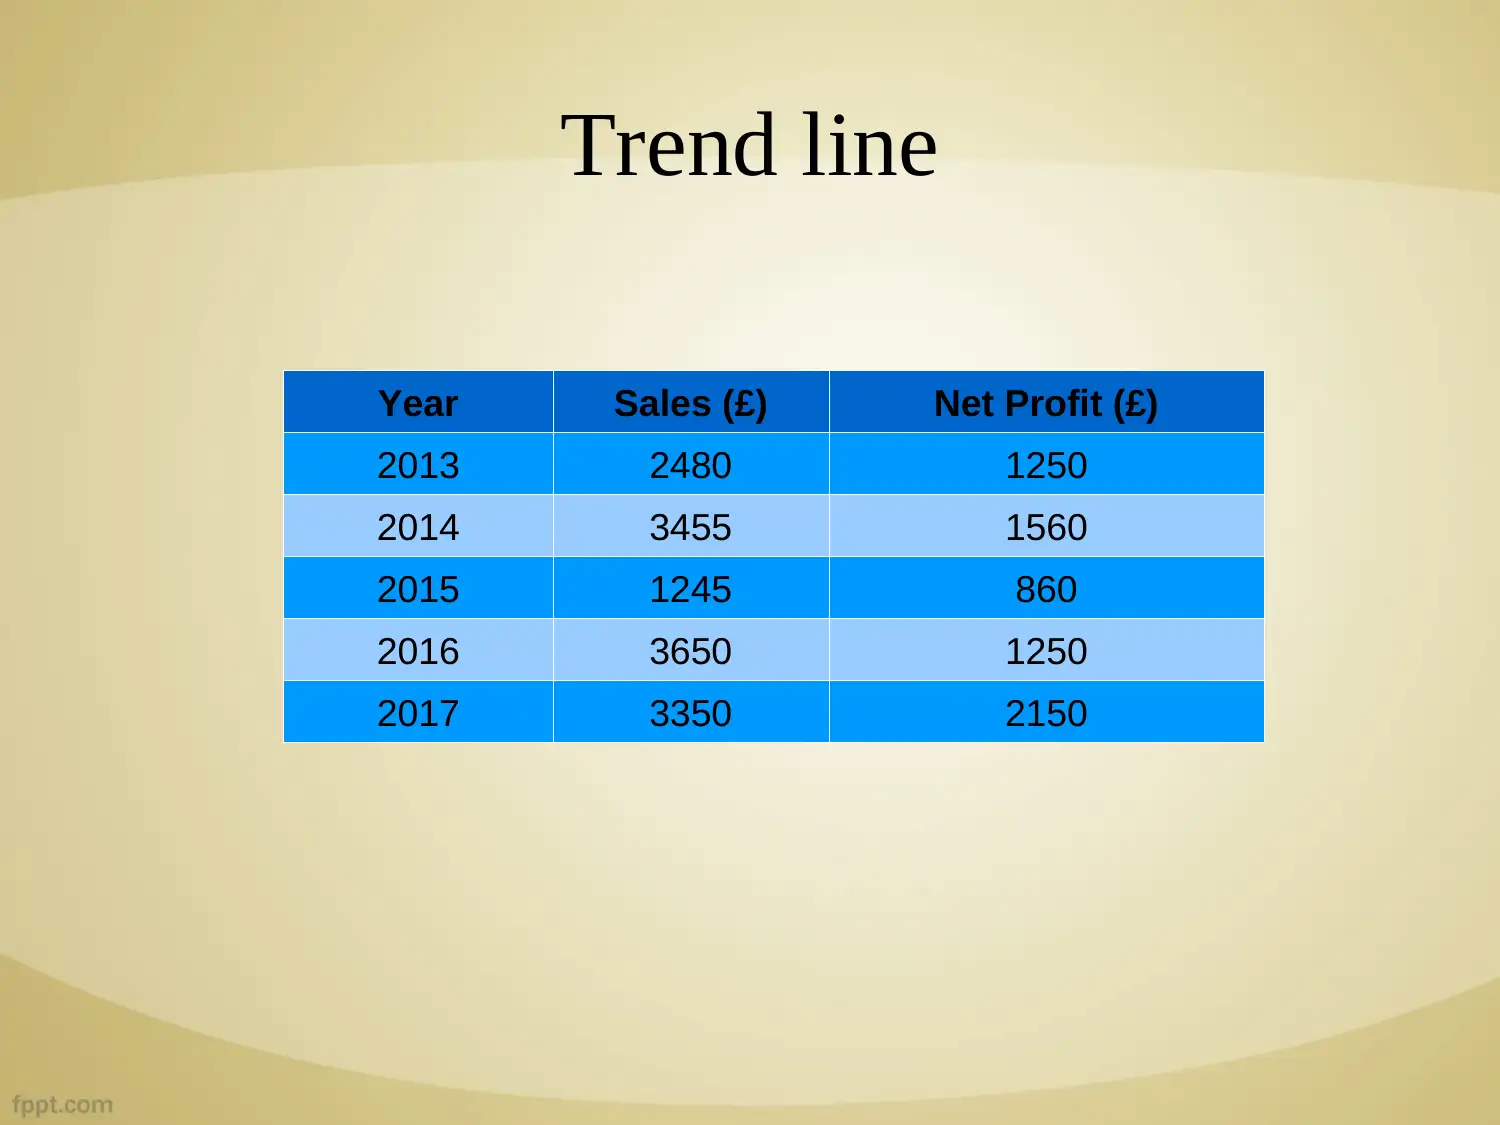
This report analyzes the business decision-making process of Balti Palace, focusing on its expansion plans. The report begins with an introduction, followed by the objective to open a new branch and attract more customers. The research methodology involves a random sampling method using questionnaires to gather primary data, which is then interpreted through statistical tools. Data interpretation includes analysis of respondent opinions, presented in percentages, and sales and profit trends from 2013 to 2017, visualized through trend lines. The conclusion summarizes the report's purpose in examining and elaborating on business dimensions for growth, and highlights the use of primary and secondary data sources. References to relevant academic sources are also included.
Document Page
Business Decision Making
Task 3.3
tabler-icon-diamond-filled.svg

Paraphrase This Document

Need a fresh take? Get an instant paraphrase of this document with our AI Paraphraser
Document Page
Covered content
Introduction
Objective
Research methodology
Data interpretation
Conclusion
References
Document Page
Introduction
Business expansion plan of Balti Place is analysed with the
help of decision making process. Variety of sources for data
collection by both primary and secondary data are defined in
this subject. Information which remain essential for
effective decision making process also illustrated in this
context.
Document Page
Objective
Open new branch of Balti Palace in London to attract
large number of customers
Analysis of results through application statistical tools
tabler-icon-diamond-filled.svg

Paraphrase This Document

Need a fresh take? Get an instant paraphrase of this document with our AI Paraphraser
Document Page
Research Methodology
Random sampling method is used to select 80 respondents
Questionnaire is prepared to ascertain their opinions
Document Page
Data Interpretation
Particular Respondent in %
(a): Yes 65
(b): No 15
Document Page
Continue..
(a): Yes (b): No
0
10
20
30
40
50
60
70 65
15
Column D
tabler-icon-diamond-filled.svg

Paraphrase This Document

Need a fresh take? Get an instant paraphrase of this document with our AI Paraphraser
Document Page
Continue
Particular Respondent in %
(a): Yes 55
(b): No 10
(c): Neutral Response 5
Document Page
Continue...
(a): Yes (b): No (c): Neutral Response
0
10
20
30
40
50
60 55
10
5
Respondent in %
Document Page
Continue
Particular Respondent in %
(a): High 15
(b): Moderate 50
(c): Low 15
tabler-icon-diamond-filled.svg

Paraphrase This Document

Need a fresh take? Get an instant paraphrase of this document with our AI Paraphraser
Document Page
Continue
15
50
15
(a): High
(b): Moderate
(c): Low
Document Page
Trend line
Year Sales (£) Net Profit (£)
2013 2480 1250
2014 3455 1560
2015 1245 860
2016 3650 1250
2017 3350 2150
chevron_up_icon
1 out of 16
circle_padding
hide_on_mobile
zoom_out_icon
[object Object]