Business Decision Making Report: Balti Palace London Expansion Plan
VerifiedAdded on 2020/06/05
|18
|3513
|29
Report
AI Summary
This report focuses on business decision-making (BDM) for Balti Palace, aiming to aid its expansion into London. It starts with an introduction to BDM and its importance, followed by Task 1, which outlines a data collection plan, detailing methods like quantitative and qualitative data gathering, and survey methodologies including questionnaire design and sampling techniques. The report summarizes collected data, analyzes it using measures of central tendency (mean, median, mode) and dispersion, quartiles, percentiles, and correlation coefficients. Task 2 presents data visualization through charts and graphs, including trend lines, and concludes with a formal business report. Task 3 covers information processing tools, critical path analysis, and financial tools. The conclusion summarizes findings and recommendations for the expansion.
BUSINESS DECISION
MAKING
MAKING
Paraphrase This Document
Need a fresh take? Get an instant paraphrase of this document with our AI Paraphraser
Table of Contents
INTRODUCTION...........................................................................................................................1
TASK.1............................................................................................................................................1
P1.Produce a plan:.......................................................................................................................1
P2. Survey methodology:............................................................................................................2
1.3 Questionnaire for the collection of data................................................................................3
2.1 Summarization of the data that is collected..........................................................................4
2.2 Analysation by using Measures of central tendency.............................................................6
2.3 Analysation by using measures of dispersion.......................................................................7
2.4 use of Quartiles, percentiles and Correlation Coefficient in the decision making................8
TASK 2............................................................................................................................................9
3.1 presentation of charts and graphs..........................................................................................9
3.2 Trend line:...........................................................................................................................10
3.3 Covered in PPT:..................................................................................................................11
3.4 Formal business report........................................................................................................11
TASK 3..........................................................................................................................................11
4.1 Information processing tools:..............................................................................................11
4.2 Critical path:.......................................................................................................................12
4.3 Financial tools:....................................................................................................................12
CONCLUSION..............................................................................................................................13
REFERENCES..............................................................................................................................14
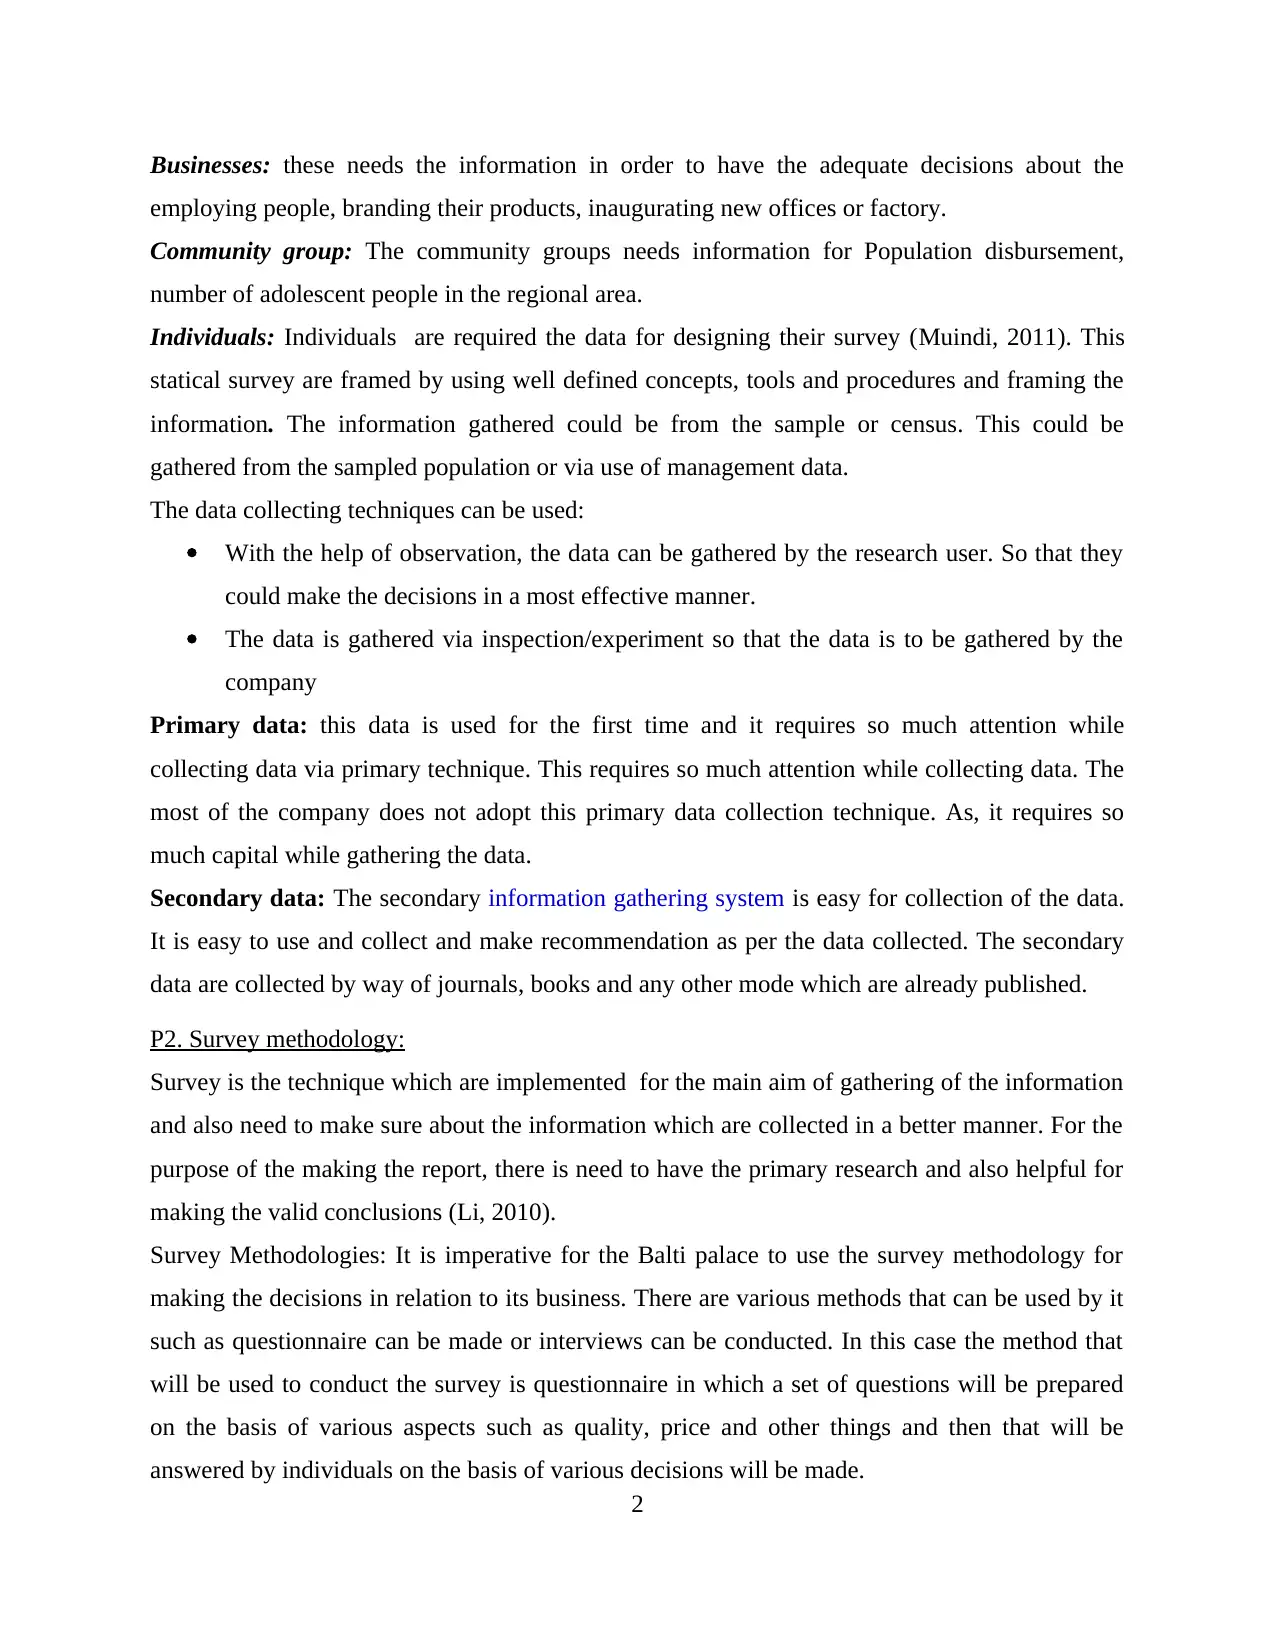
INTRODUCTION
BDM is an important concept that are required after having extensive study and applying
the skills by the talented staff within the organisation. Balti palace wants to open one unit in the
London, but before going to open the firm, there is a need to have the survey about the place
where the firm is going to open the business within the certain manner (Smith, Binns and
Tushman, 2010). That is why the cited firm is required to have the survey process in order to
attain the relevant information so that that the firm could make the strategies for expansion
purpose. As, this has been seen that the business requires the certain decision making process so
that the business can attain their pre set goals in a most effective manner.
TASK.1
P1.Produce a plan:
The data collection plan is generated after having extensive research so that the business decision
can be made in a most effective manner. This also need to make the business sustainable and
profitable. Now, it is observed that the data collection process is not an easy task so that the
business executives can frame the decisions in a most effective manner. Now, this has been seen
that the business can not survive without having proper decisions. But the data can be gathered
with the help proper resources (Nielsen, B. B and Nielsen, S., 2011). There are range of tools
that are utilesd in this concept in order to gather the information. However, before going to
collect the data, there are some of the methods which are used for collecting the data. Some of
them are undermentioned:
Deciding on methods: There are various methods which are mostly implemented in order
to gather and review the data. However, two methods under which the information can be
collected. These are quantitative and qualitative data. Basically, quantitative data is
mostly needed to focus on the quantitative message, asking for norms, way, trends and
link within the information. Before going to collect the information, there is need to know about the requirements
about the intended users. However, there are some tools which are used in order to know
about the user who would used information. These are:
Government: The government used information which are gathered to make the plan, emerged
it, implement and monitor social and economic programs.
1
⊘ This is a preview!⊘
Do you want full access?
Subscribe today to unlock all pages.
Trusted by 1+ million students worldwide
Businesses: these needs the information in order to have the adequate decisions about the
employing people, branding their products, inaugurating new offices or factory.
Community group: The community groups needs information for Population disbursement,
number of adolescent people in the regional area.
Individuals: Individuals are required the data for designing their survey (Muindi, 2011). This
statical survey are framed by using well defined concepts, tools and procedures and framing the
information. The information gathered could be from the sample or census. This could be
gathered from the sampled population or via use of management data.
The data collecting techniques can be used:
With the help of observation, the data can be gathered by the research user. So that they
could make the decisions in a most effective manner.
The data is gathered via inspection/experiment so that the data is to be gathered by the
company
Primary data: this data is used for the first time and it requires so much attention while
collecting data via primary technique. This requires so much attention while collecting data. The
most of the company does not adopt this primary data collection technique. As, it requires so
much capital while gathering the data.
Secondary data: The secondary information gathering system is easy for collection of the data.
It is easy to use and collect and make recommendation as per the data collected. The secondary
data are collected by way of journals, books and any other mode which are already published.
P2. Survey methodology:
Survey is the technique which are implemented for the main aim of gathering of the information
and also need to make sure about the information which are collected in a better manner. For the
purpose of the making the report, there is need to have the primary research and also helpful for
making the valid conclusions (Li, 2010).
Survey Methodologies: It is imperative for the Balti palace to use the survey methodology for
making the decisions in relation to its business. There are various methods that can be used by it
such as questionnaire can be made or interviews can be conducted. In this case the method that
will be used to conduct the survey is questionnaire in which a set of questions will be prepared
on the basis of various aspects such as quality, price and other things and then that will be
answered by individuals on the basis of various decisions will be made.
2
Paraphrase This Document
Need a fresh take? Get an instant paraphrase of this document with our AI Paraphraser
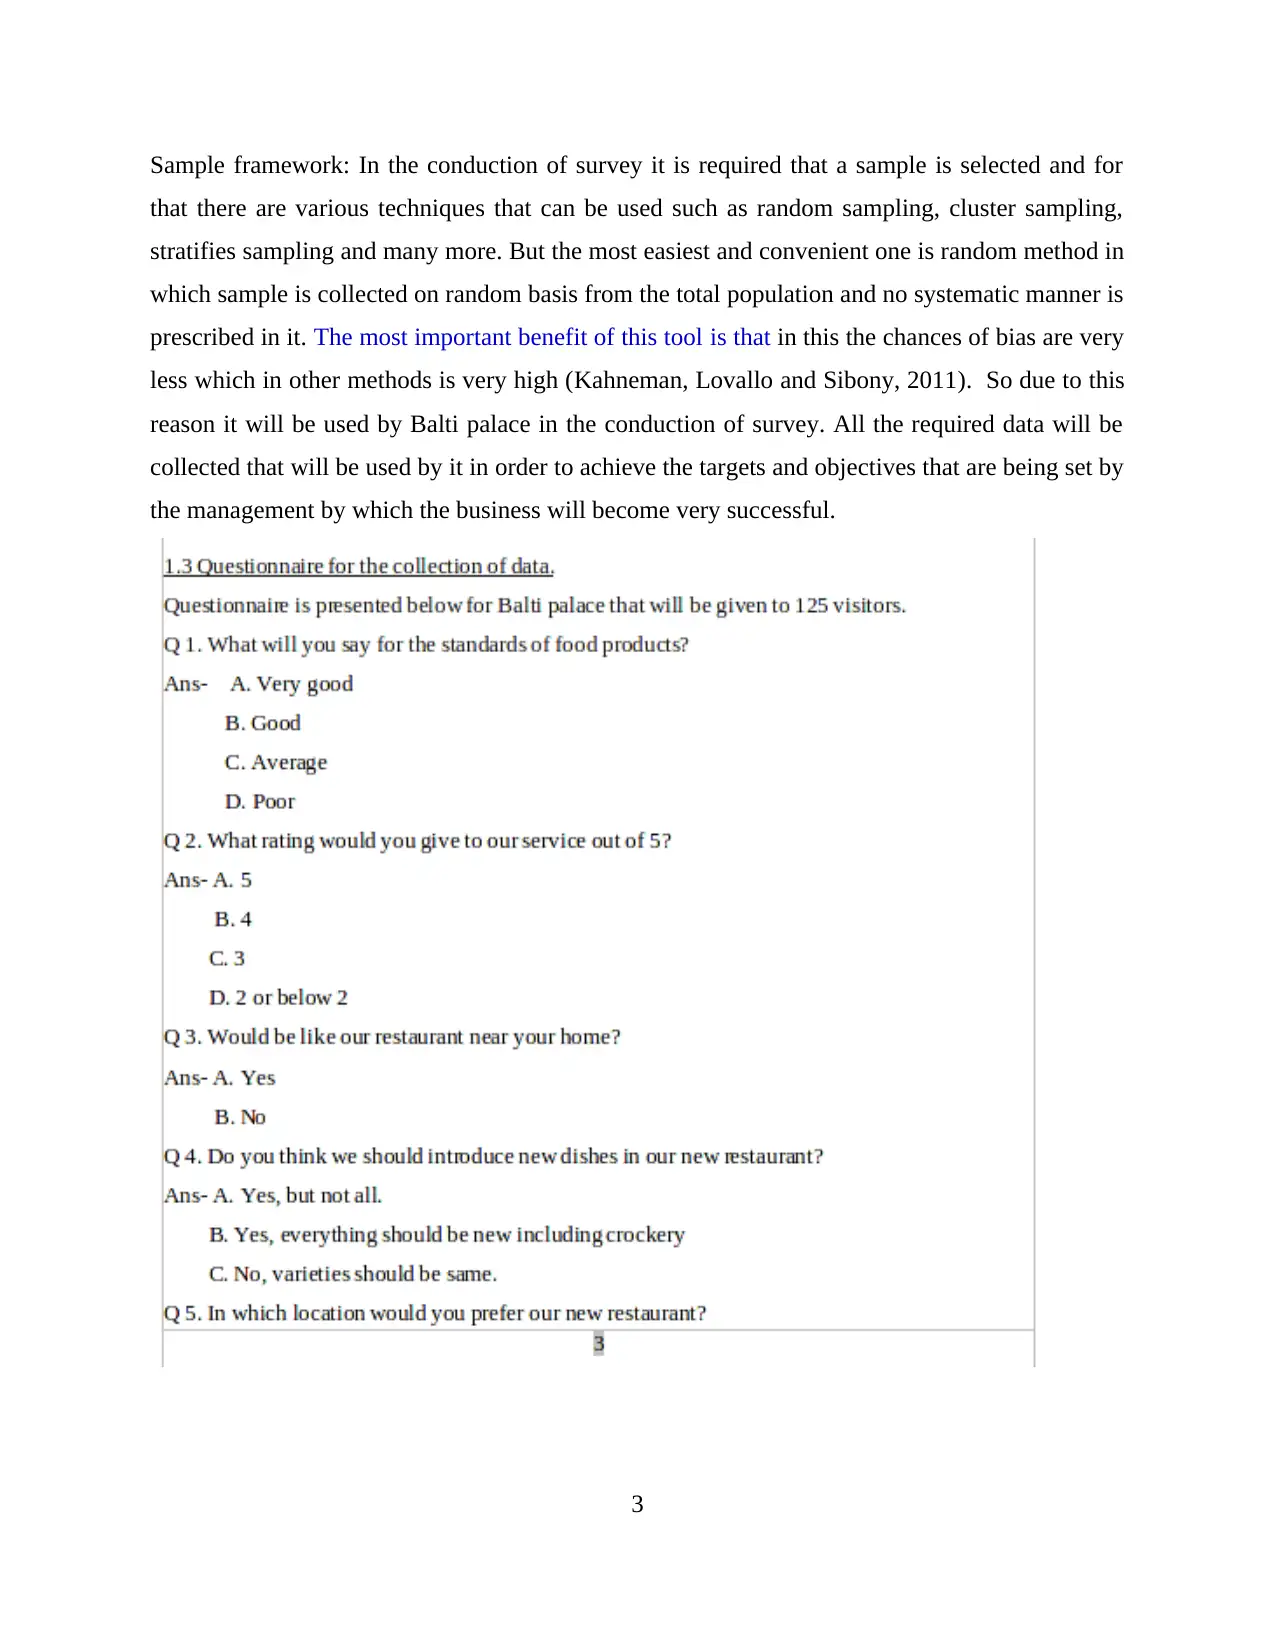
Sample framework: In the conduction of survey it is required that a sample is selected and for
that there are various techniques that can be used such as random sampling, cluster sampling,
stratifies sampling and many more. But the most easiest and convenient one is random method in
which sample is collected on random basis from the total population and no systematic manner is
prescribed in it. The most important benefit of this tool is that in this the chances of bias are very
less which in other methods is very high (Kahneman, Lovallo and Sibony, 2011). So due to this
reason it will be used by Balti palace in the conduction of survey. All the required data will be
collected that will be used by it in order to achieve the targets and objectives that are being set by
the management by which the business will become very successful.
3
4
⊘ This is a preview!⊘
Do you want full access?
Subscribe today to unlock all pages.
Trusted by 1+ million students worldwide
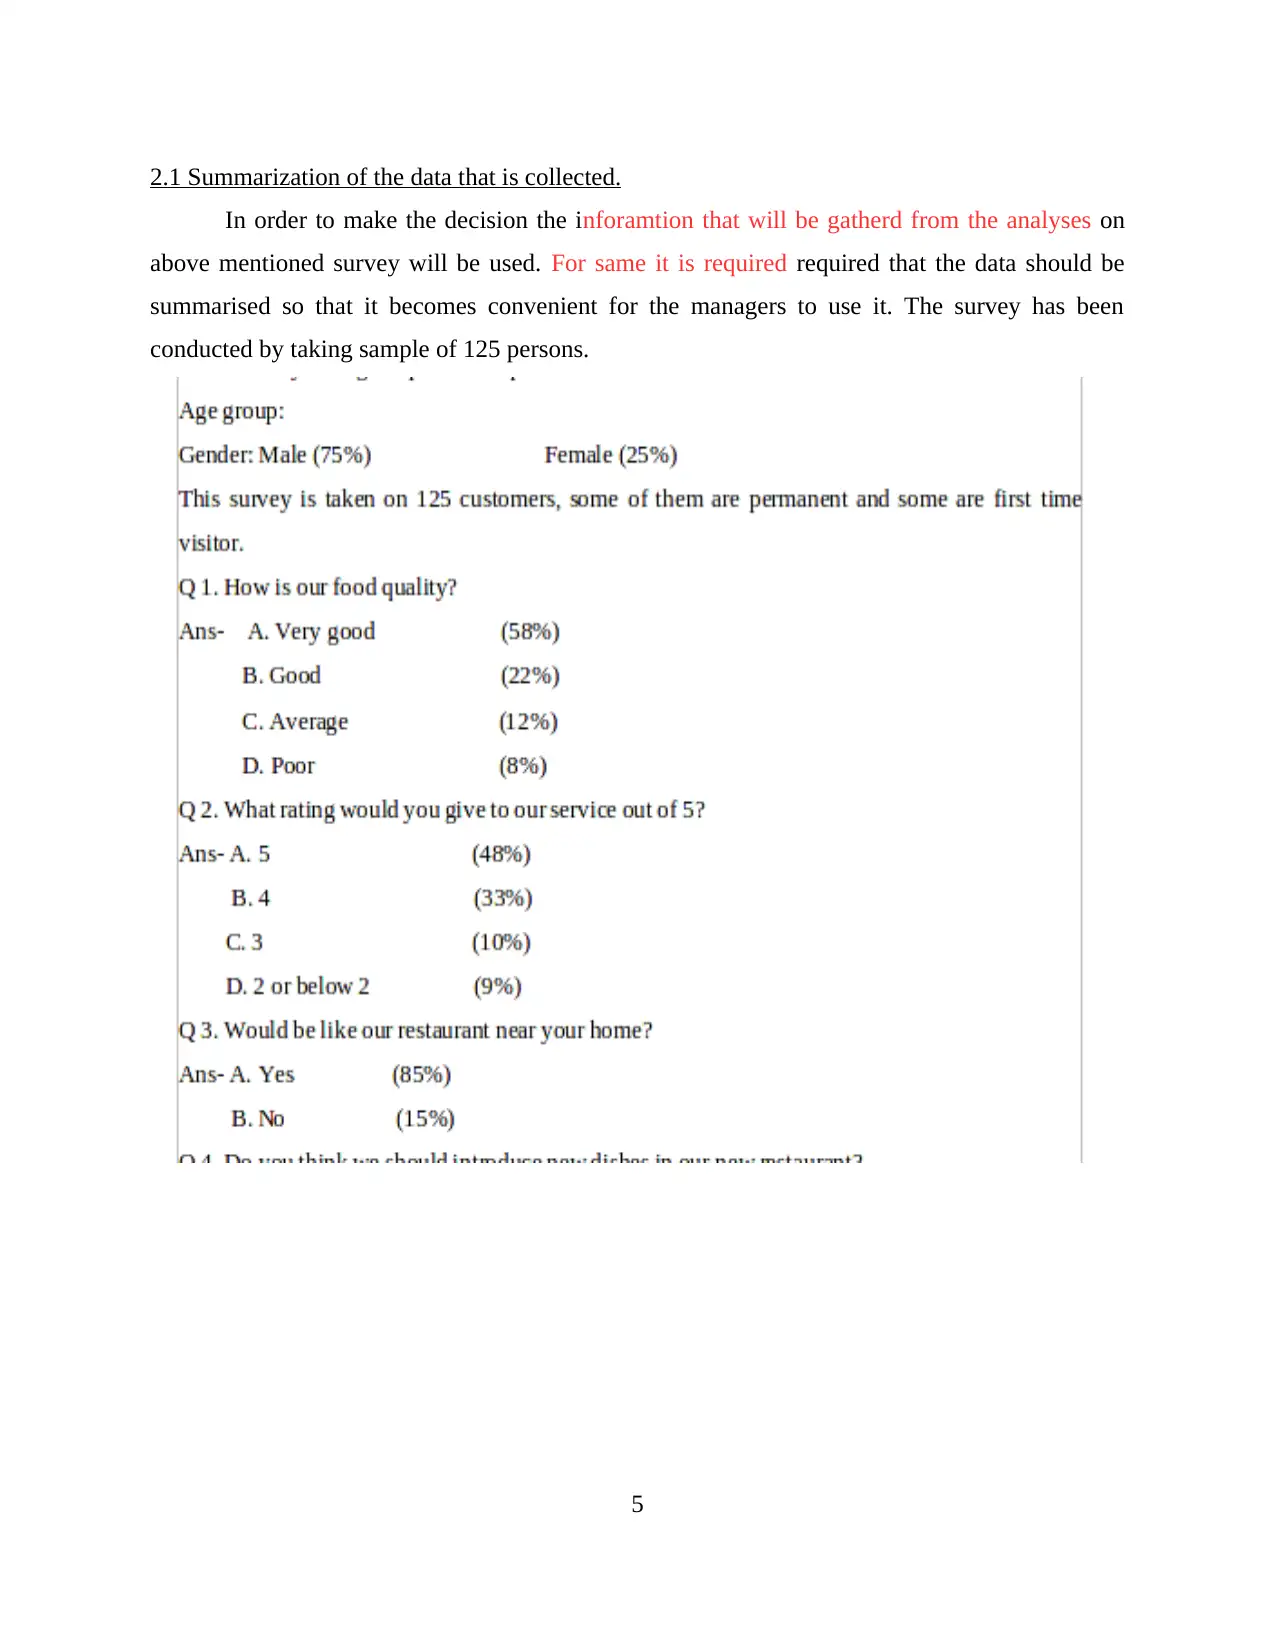
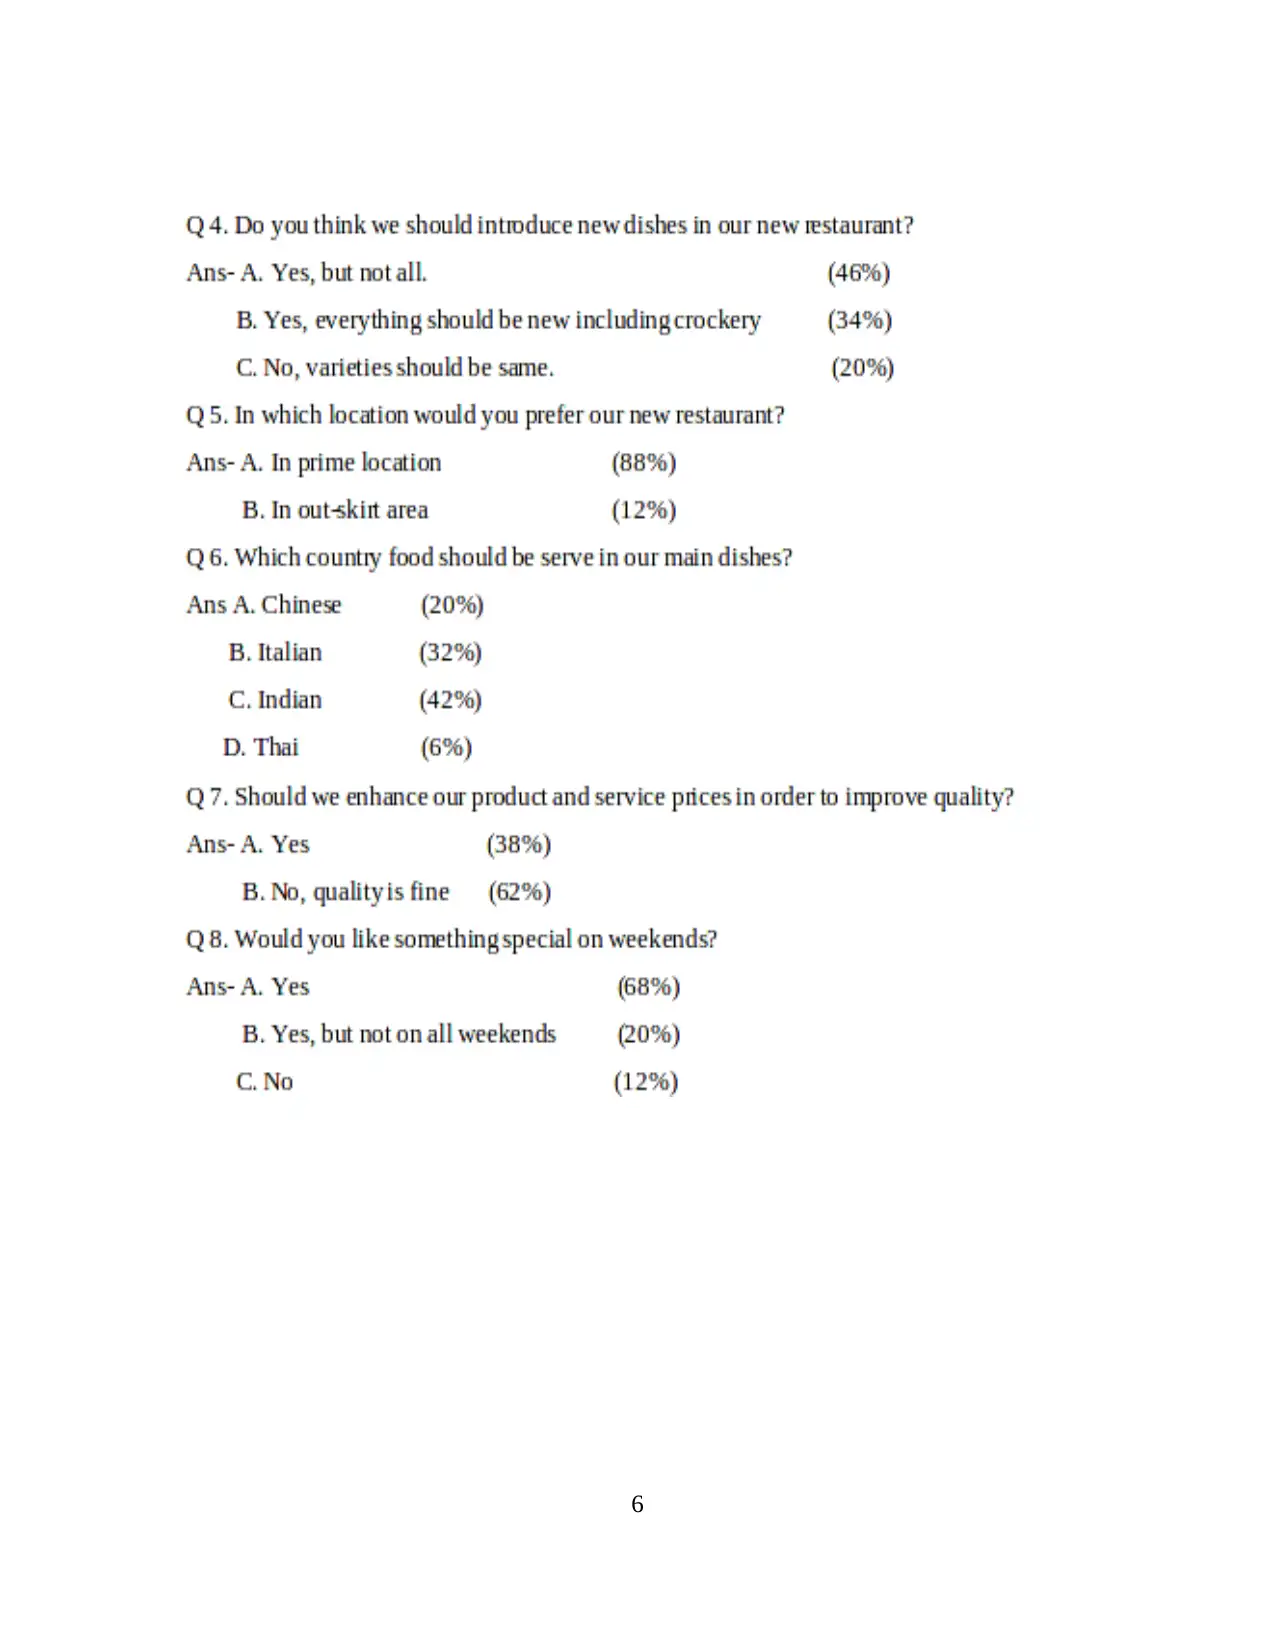
2.1 Summarization of the data that is collected.
In order to make the decision the inforamtion that will be gatherd from the analyses on
above mentioned survey will be used. For same it is required required that the data should be
summarised so that it becomes convenient for the managers to use it. The survey has been
conducted by taking sample of 125 persons.
5
Paraphrase This Document
Need a fresh take? Get an instant paraphrase of this document with our AI Paraphraser
6
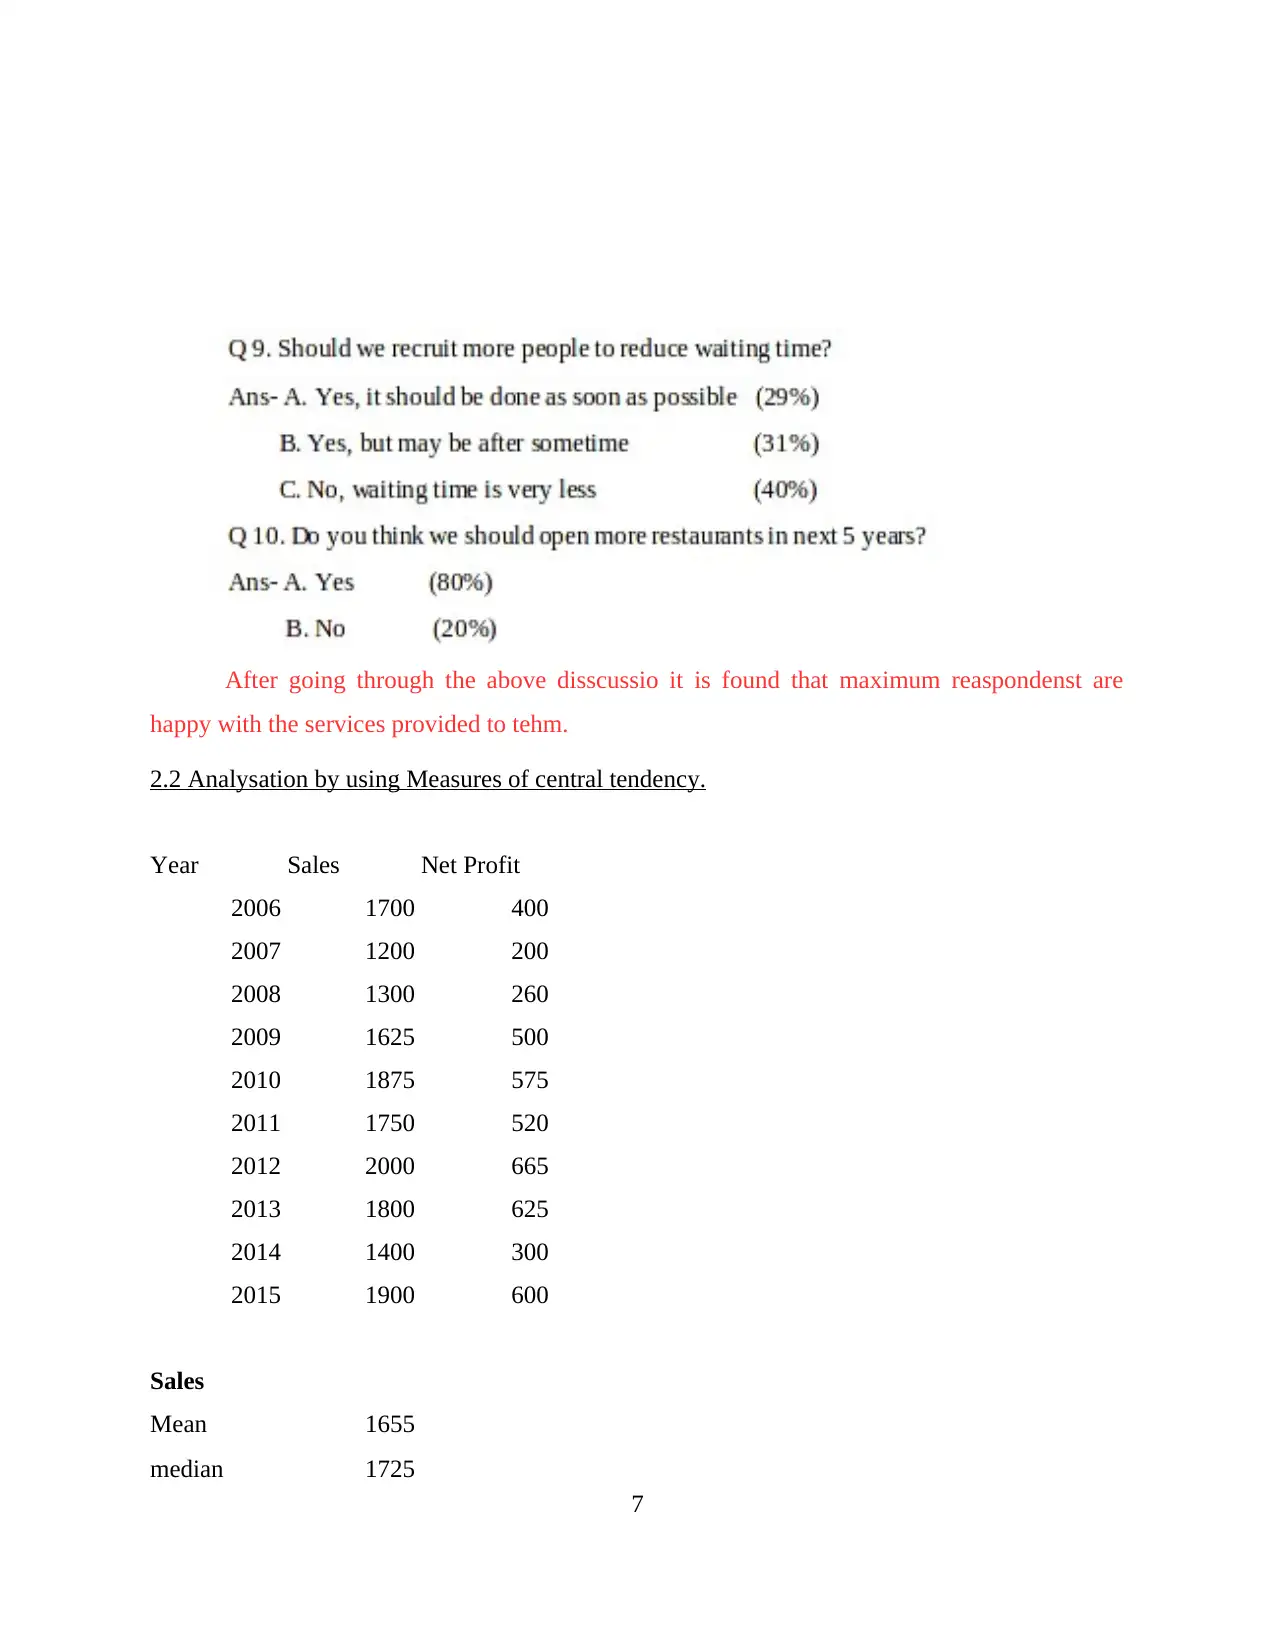
After going through the above disscussio it is found that maximum reaspondenst are
happy with the services provided to tehm.
2.2 Analysation by using Measures of central tendency.
Year Sales Net Profit
2006 1700 400
2007 1200 200
2008 1300 260
2009 1625 500
2010 1875 575
2011 1750 520
2012 2000 665
2013 1800 625
2014 1400 300
2015 1900 600
Sales
Mean 1655
median 1725
7
happy with the services provided to tehm.
2.2 Analysation by using Measures of central tendency.
Year Sales Net Profit
2006 1700 400
2007 1200 200
2008 1300 260
2009 1625 500
2010 1875 575
2011 1750 520
2012 2000 665
2013 1800 625
2014 1400 300
2015 1900 600
Sales
Mean 1655
median 1725
7
⊘ This is a preview!⊘
Do you want full access?
Subscribe today to unlock all pages.
Trusted by 1+ million students worldwide
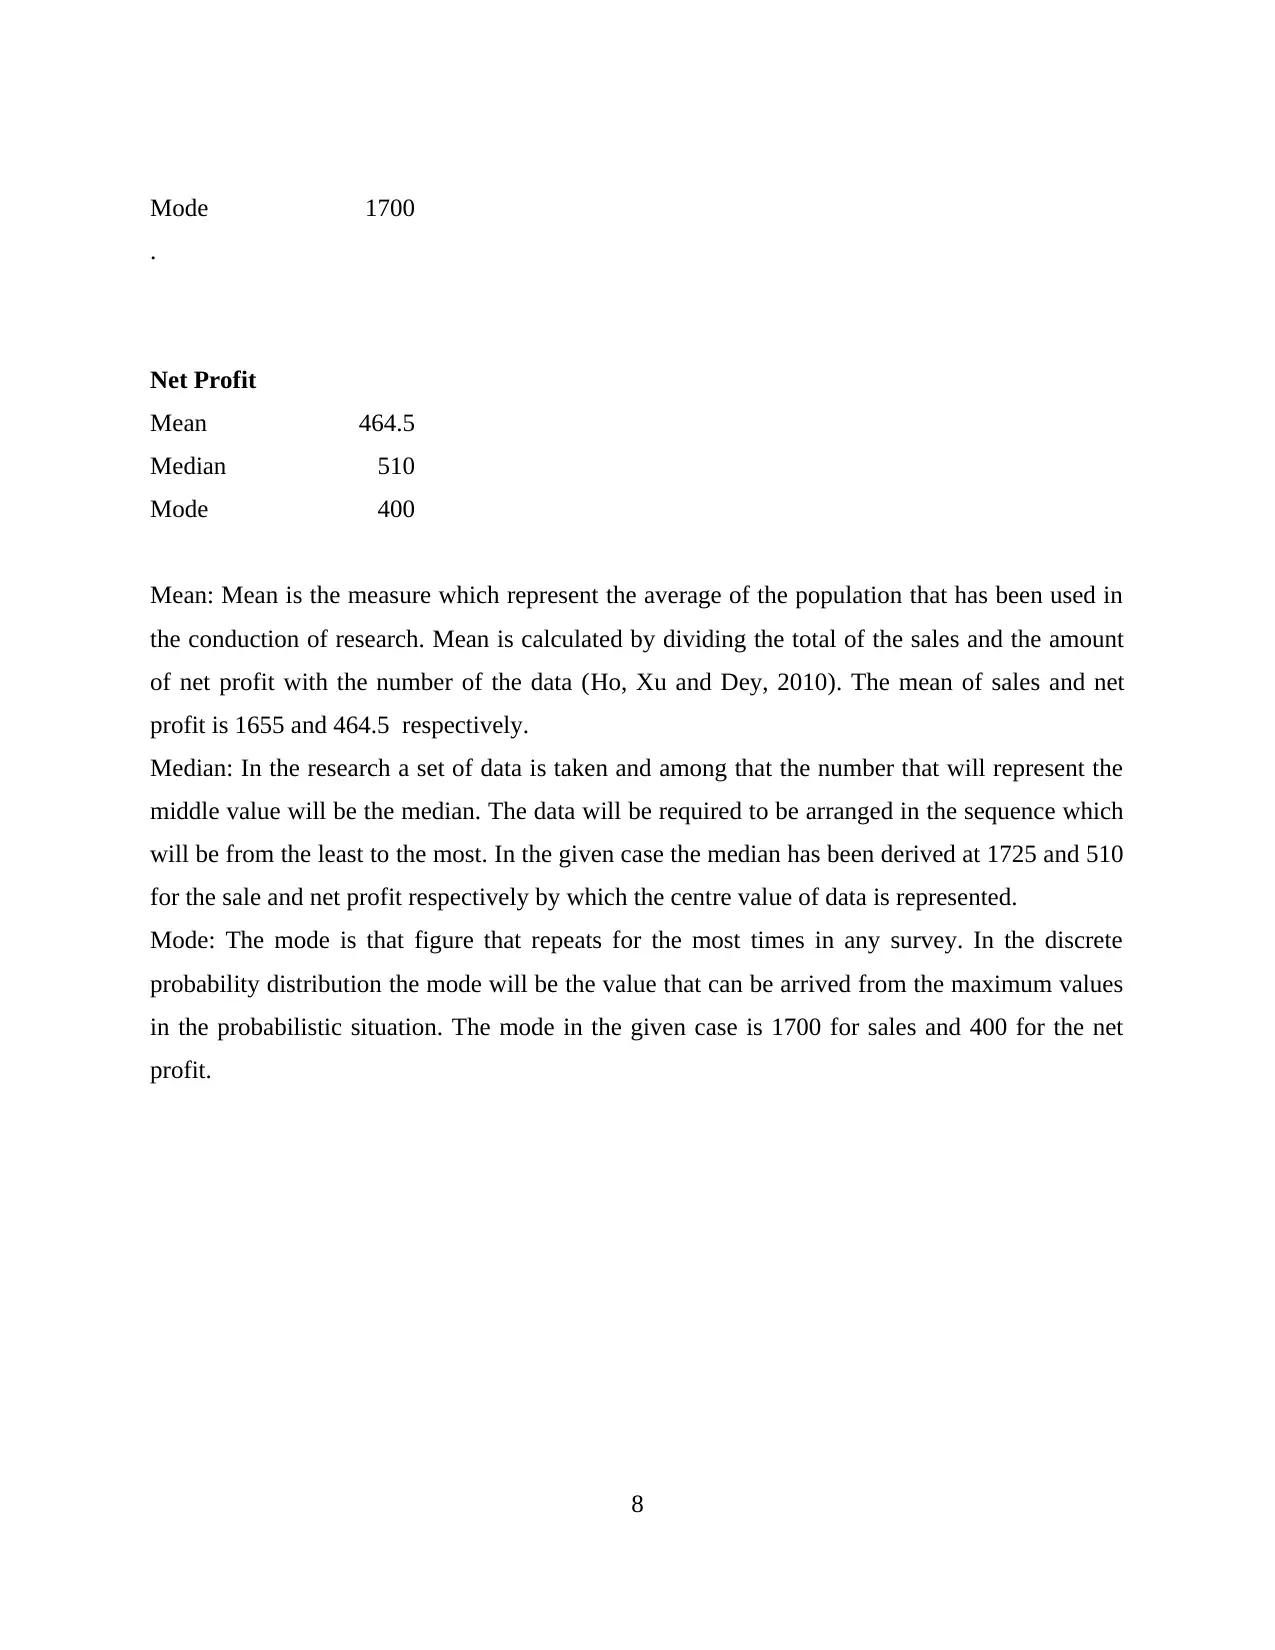
Mode 1700
.
Net Profit
Mean 464.5
Median 510
Mode 400
Mean: Mean is the measure which represent the average of the population that has been used in
the conduction of research. Mean is calculated by dividing the total of the sales and the amount
of net profit with the number of the data (Ho, Xu and Dey, 2010). The mean of sales and net
profit is 1655 and 464.5 respectively.
Median: In the research a set of data is taken and among that the number that will represent the
middle value will be the median. The data will be required to be arranged in the sequence which
will be from the least to the most. In the given case the median has been derived at 1725 and 510
for the sale and net profit respectively by which the centre value of data is represented.
Mode: The mode is that figure that repeats for the most times in any survey. In the discrete
probability distribution the mode will be the value that can be arrived from the maximum values
in the probabilistic situation. The mode in the given case is 1700 for sales and 400 for the net
profit.
8
Paraphrase This Document
Need a fresh take? Get an instant paraphrase of this document with our AI Paraphraser
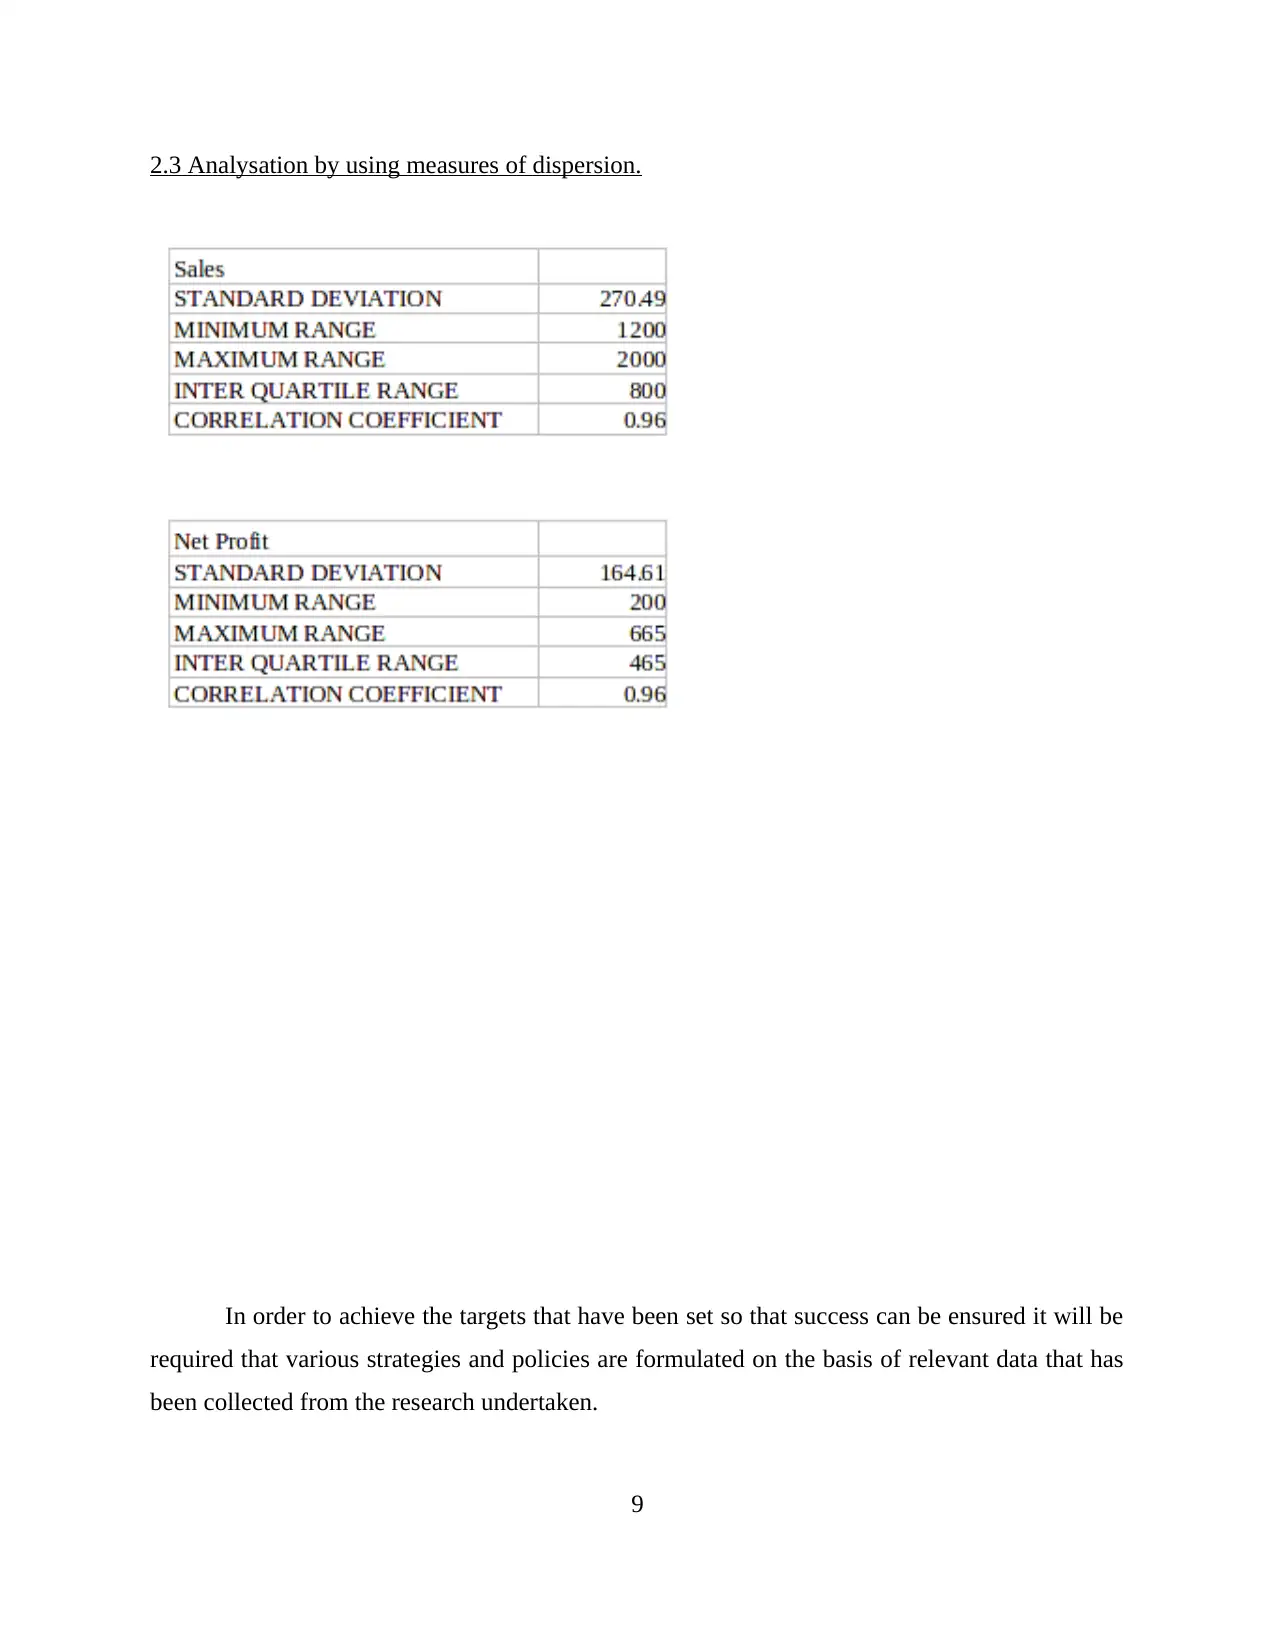
2.3 Analysation by using measures of dispersion.
In order to achieve the targets that have been set so that success can be ensured it will be
required that various strategies and policies are formulated on the basis of relevant data that has
been collected from the research undertaken.
9
In order to achieve the targets that have been set so that success can be ensured it will be
required that various strategies and policies are formulated on the basis of relevant data that has
been collected from the research undertaken.
9
Measures of dispersion: in the portfolio there will be various outcomes that will be found and
they will be known as measures of dispersion (Gigerenzer and Gaissmaier, 2011). With the use
of it the deviation that will be present in the data will be identified and then the decision will be
taken on the basis of it. There are main two types in which this has been classified which are as
follows:
Relative measure of dispersion: In this method the measurement of the data in relation to two or
more sets will be conducted. By this the various sets that are available will be compared and the
best among them will be used. With the help of this the overall profitability of the business will
be increased.
Absolute measure of dispersion: In this measure of dispersion the original data well be used in
order to calculate the outcomes. The methods that can be used in this are mean, range, quartile
and standard deviation on the basis of which decisions will be made.
In the main is the standard deviation by which the level of risk and uncertainty will be
identified and if more risk will be there then the decision that will be made will be negative. In
this it is identified at 270.49 and 164.61 for sales and net profit.
2.4 use of Quartiles, percentiles and Correlation Coefficient in the decision making.
Quartiles: In the business there are various variables and segments that are present and
for that it wilt be required that the whole business is divided into various groups. In basic terms
there are three types of quartiles that are used. Which are upper quartile in which 75 percent of
the section is covered (Chang, Van Witteloostuijn and Eden, 2010). Then comes the lower
quartile which considers the 25 percent of the share. Last is the inter quartile in which 50 percent
of the business is undertaken. The decision will be taken according to them which means that
project wilt be accepted if the data will be arrived in between upper and lower quartile otherwise
not.
Percentiles: this is the method by which the data is represented in the form of percentage
that will be calculated by taking one measure as the base and in this decision will be taken when
the percentage will be maximum but under the limit of hundred percent.
Correlation coefficient: this is the measure by which the relation in between two variable is
determined and then decision will be made according to it. The correlation will be considered to
be good if it is calculated between -1 and 1. if the relation comes other then this range then it will
10
⊘ This is a preview!⊘
Do you want full access?
Subscribe today to unlock all pages.
Trusted by 1+ million students worldwide
1 out of 18
Related Documents


Your All-in-One AI-Powered Toolkit for Academic Success.
+13062052269
info@desklib.com
Available 24*7 on WhatsApp / Email
![[object Object]](/_next/static/media/star-bottom.7253800d.svg)
Unlock your academic potential
Copyright © 2020–2026 A2Z Services. All Rights Reserved. Developed and managed by ZUCOL.