Macroeconomic Policies & Development: Bangladesh and Malaysia Analysis
VerifiedAdded on 2023/06/13
|13
|2175
|263
Report
AI Summary
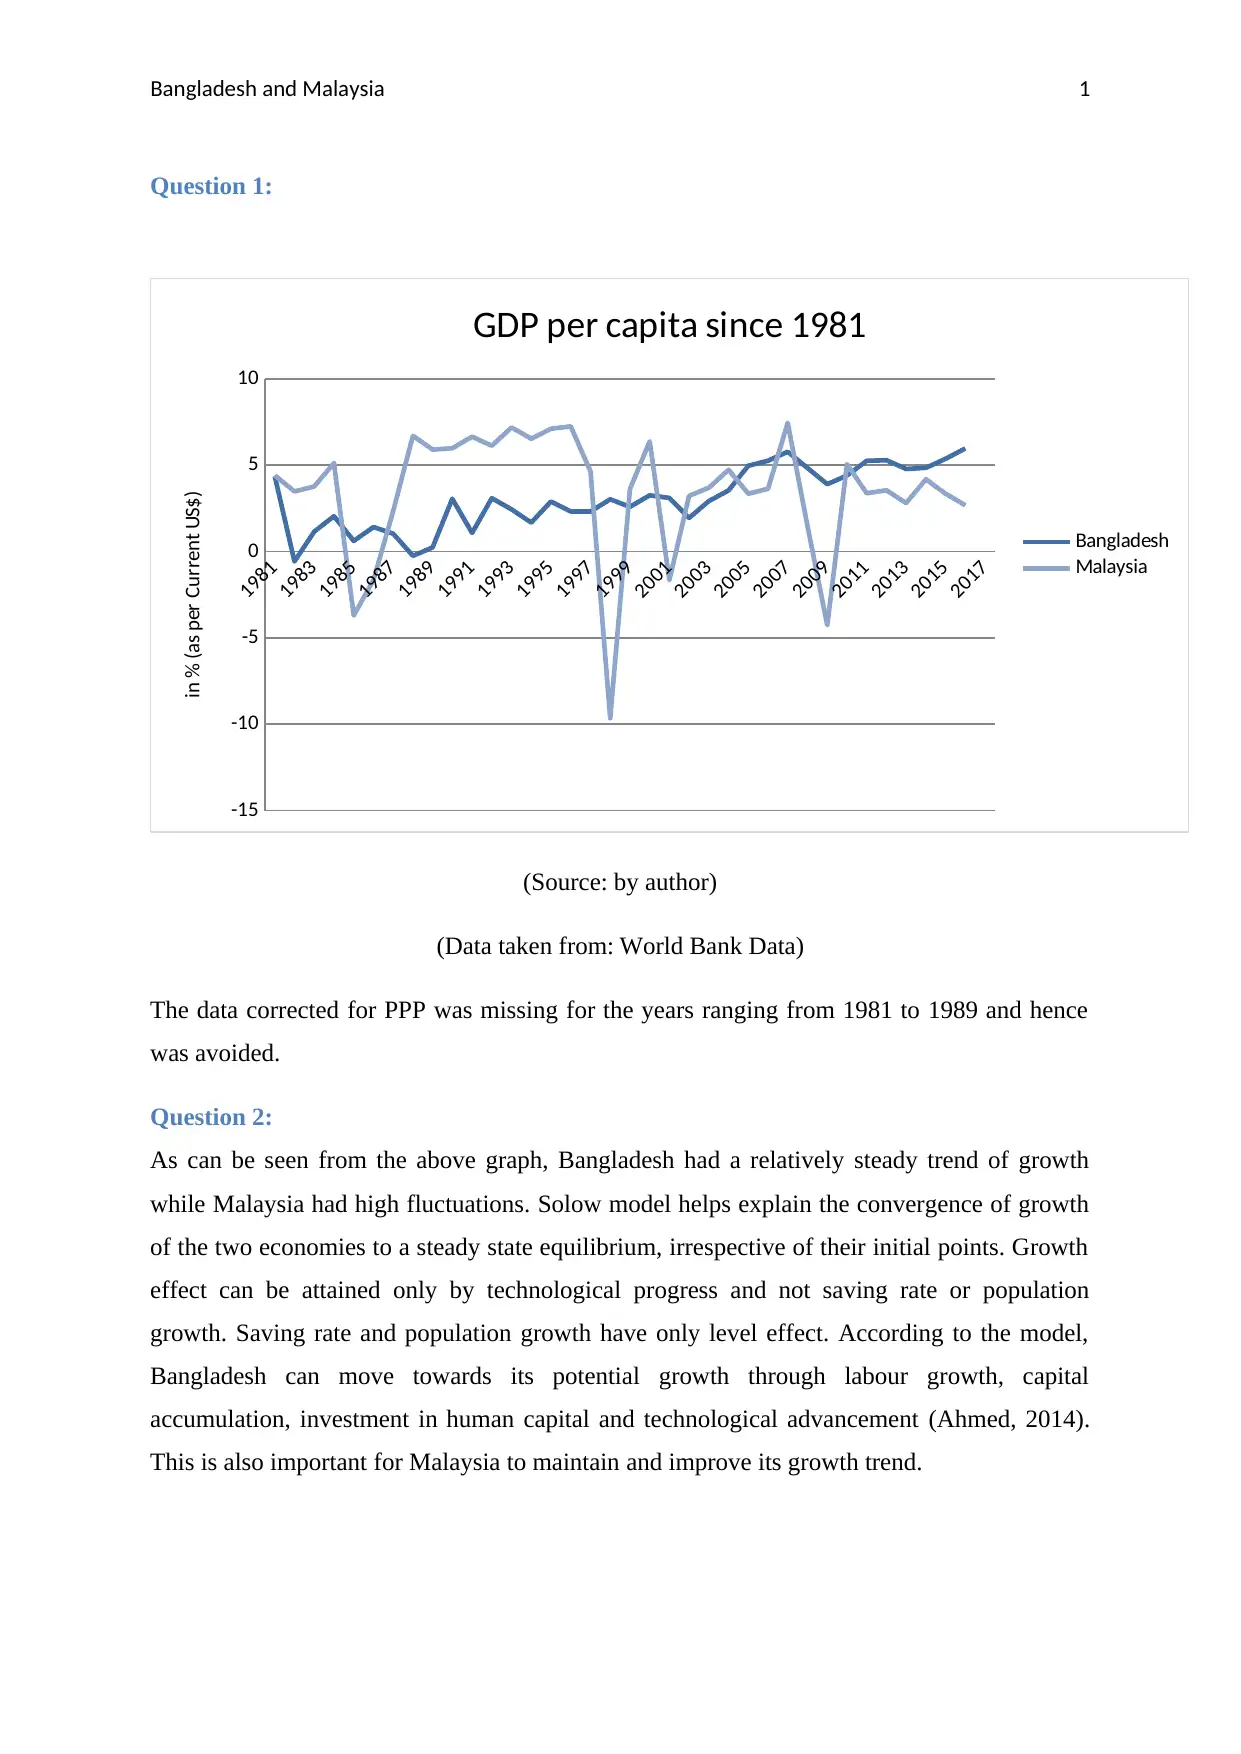
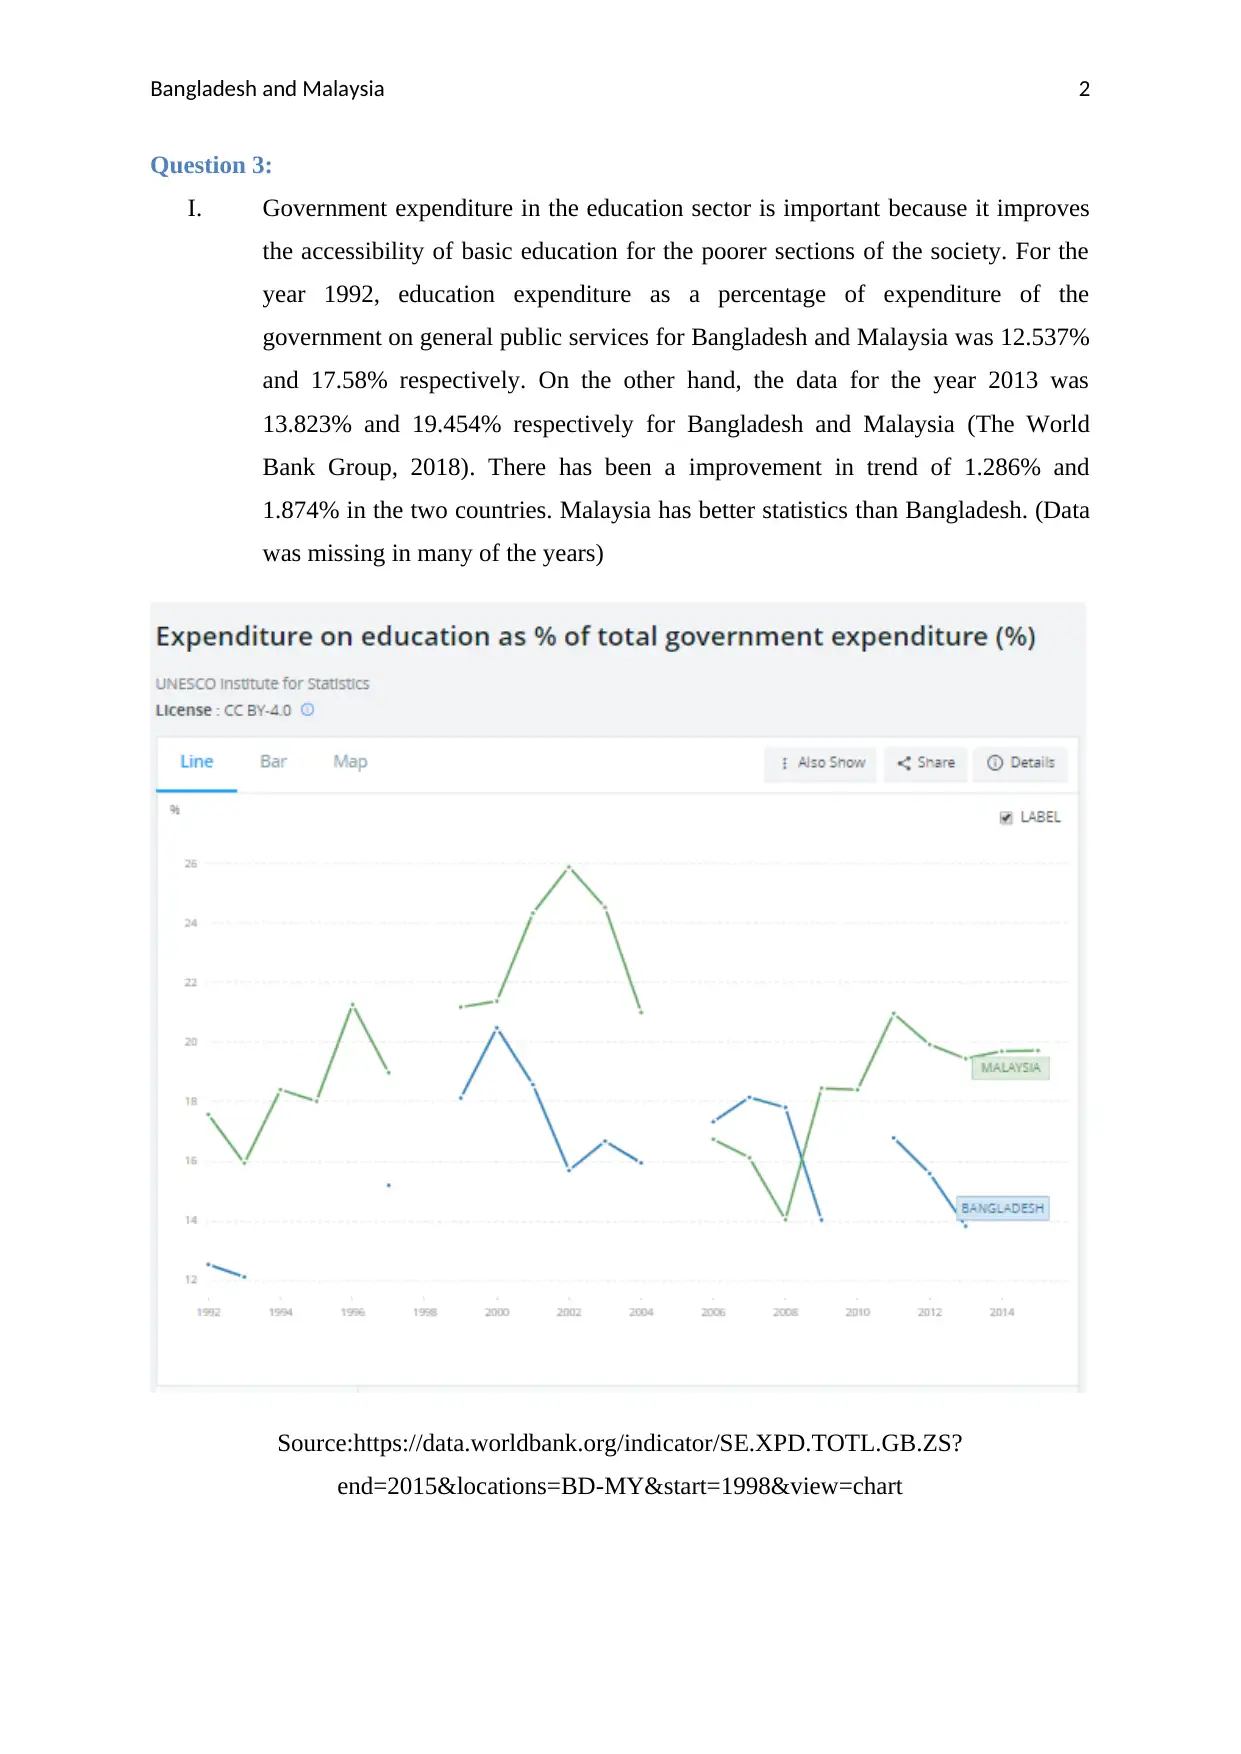
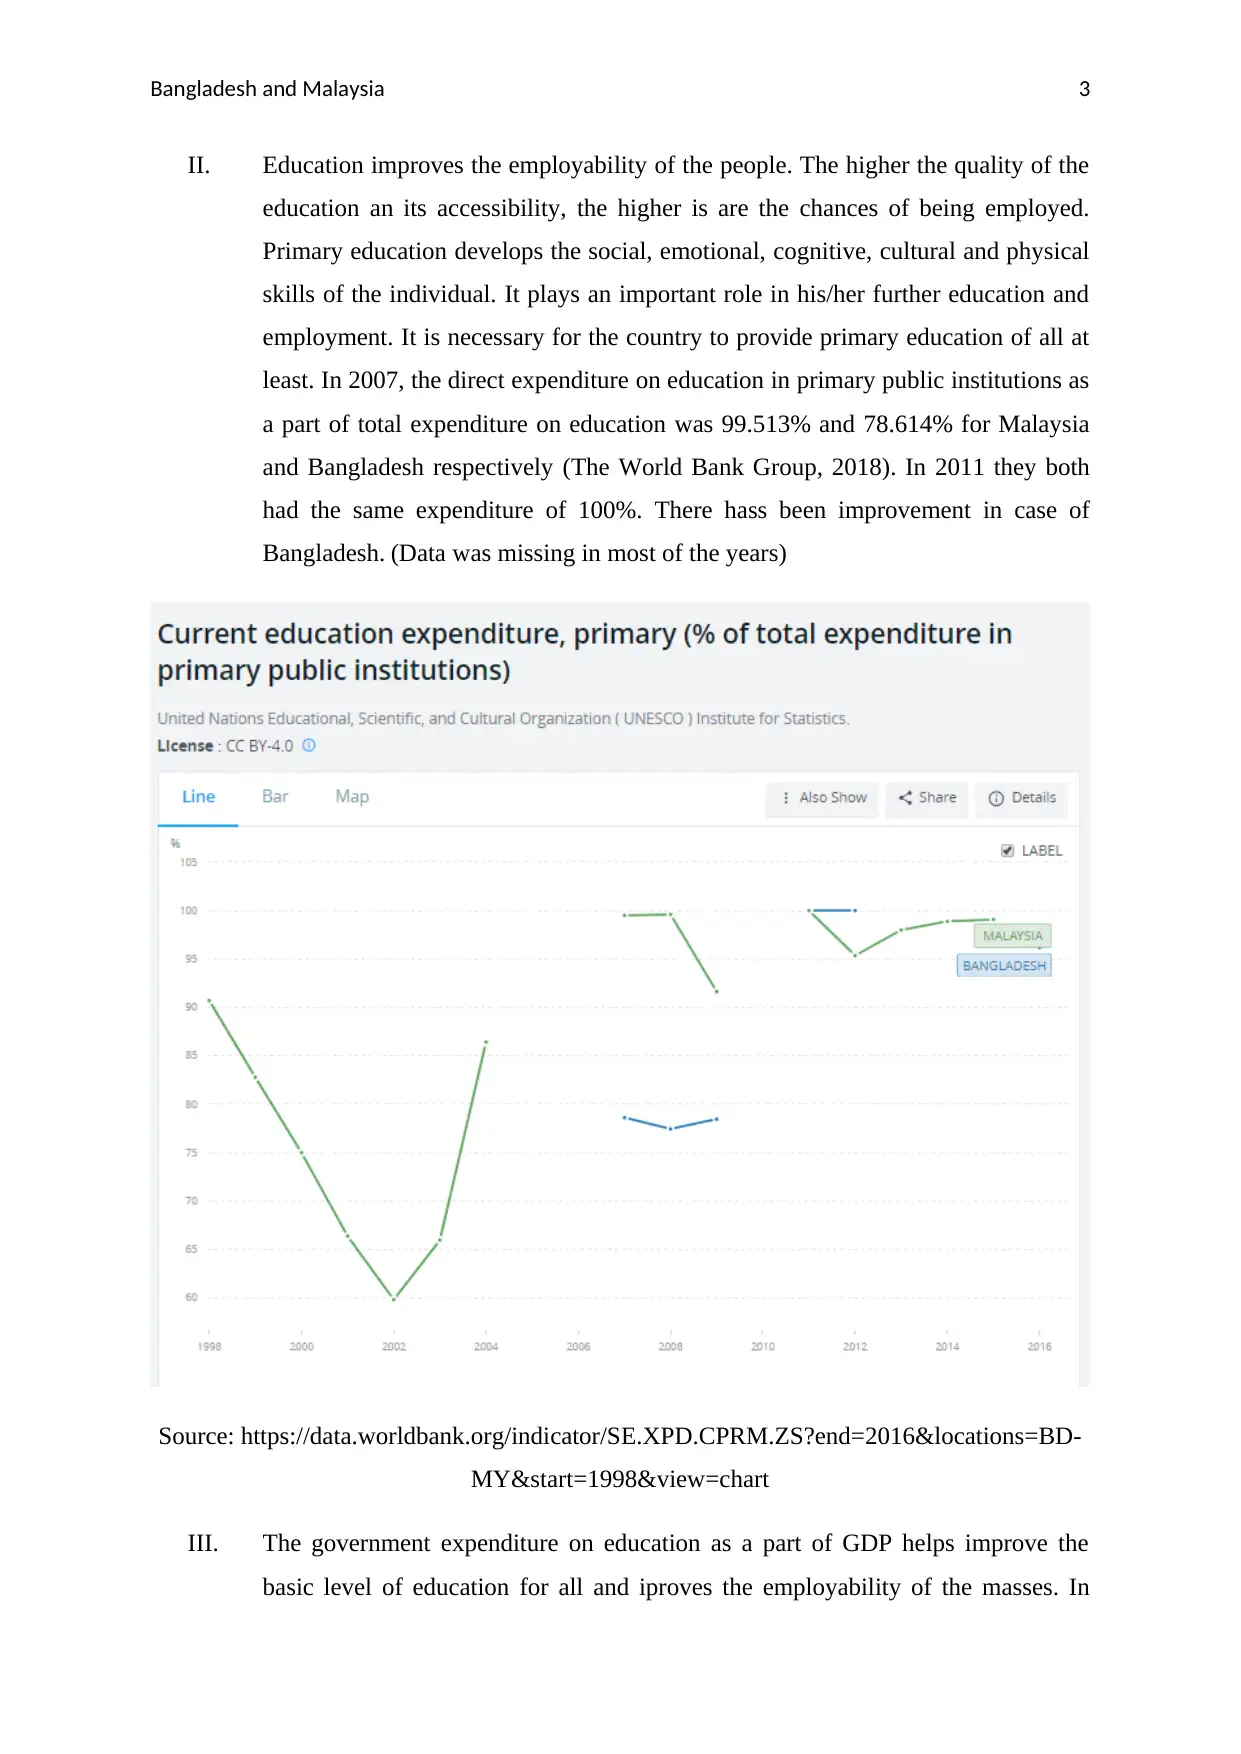
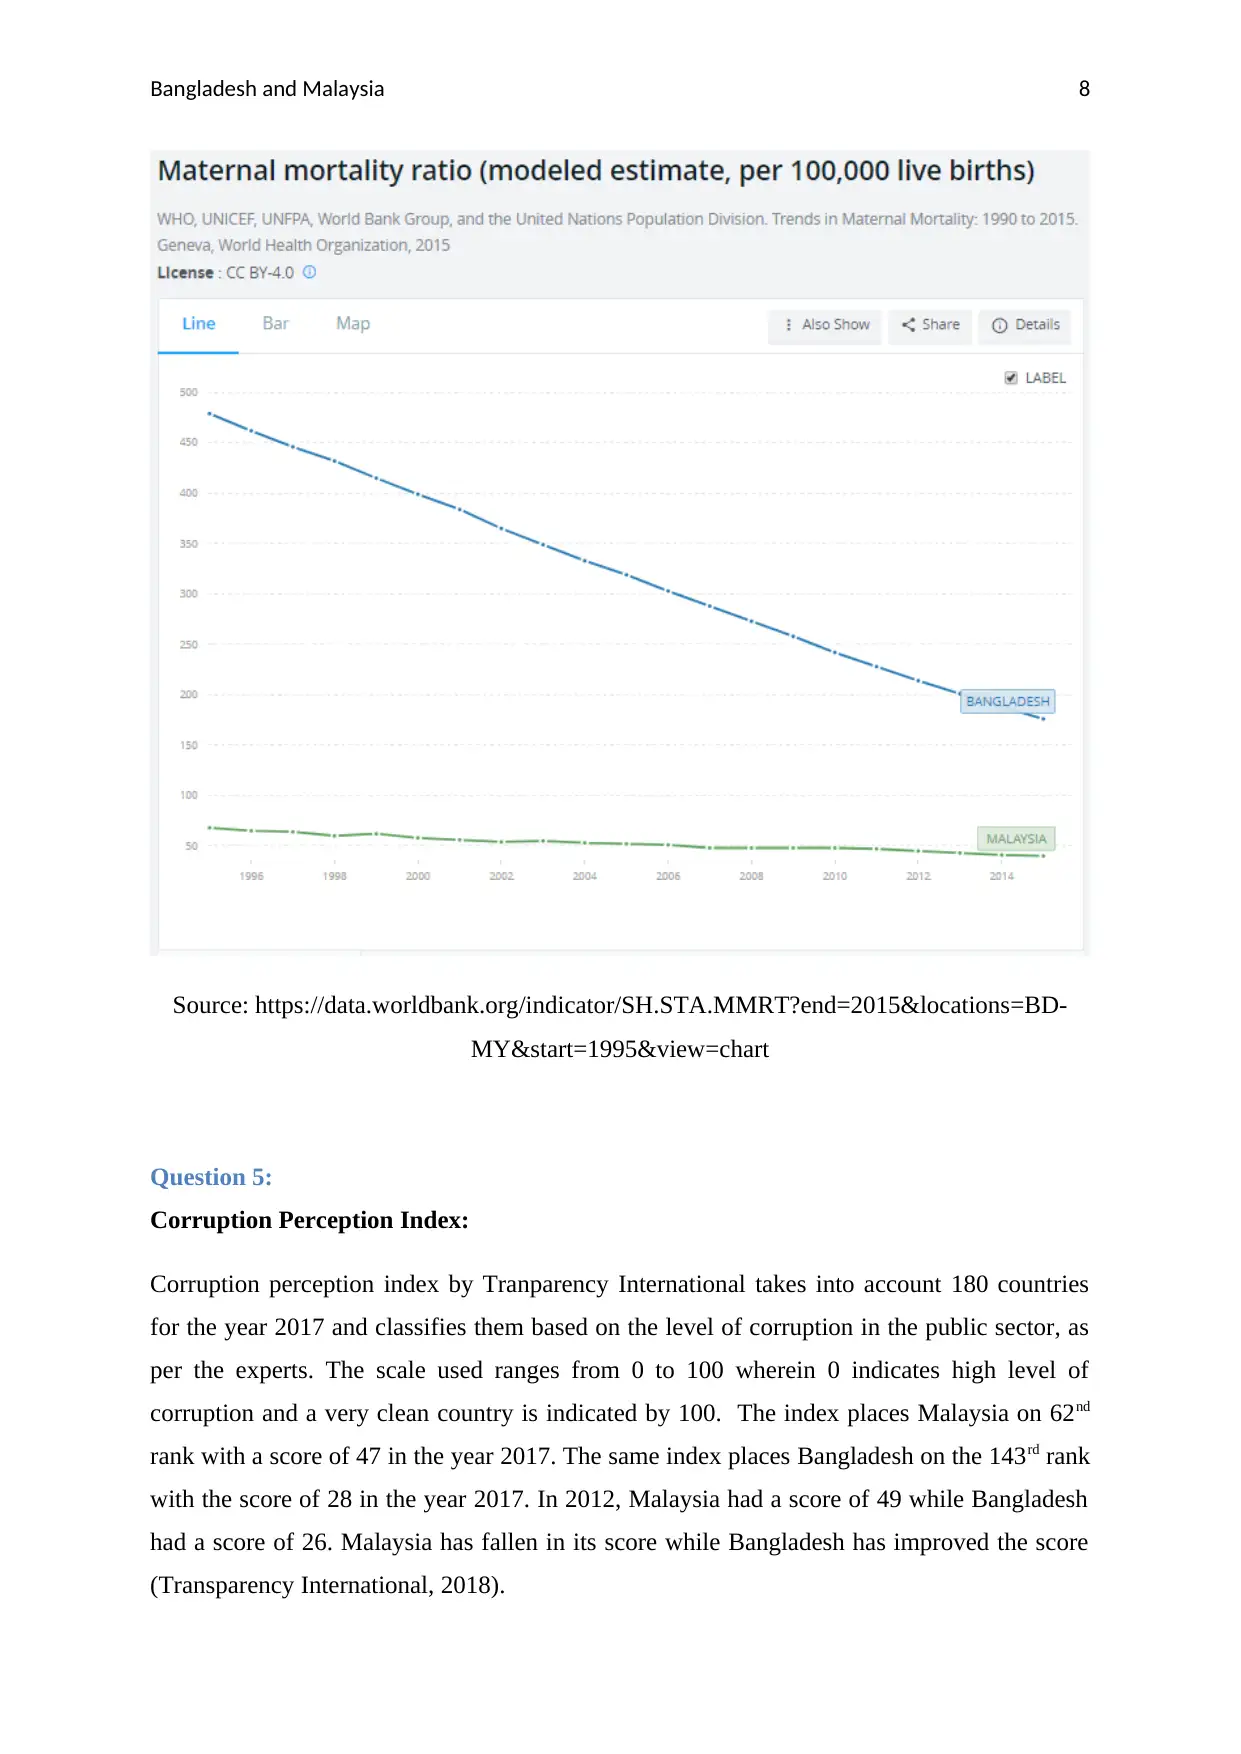
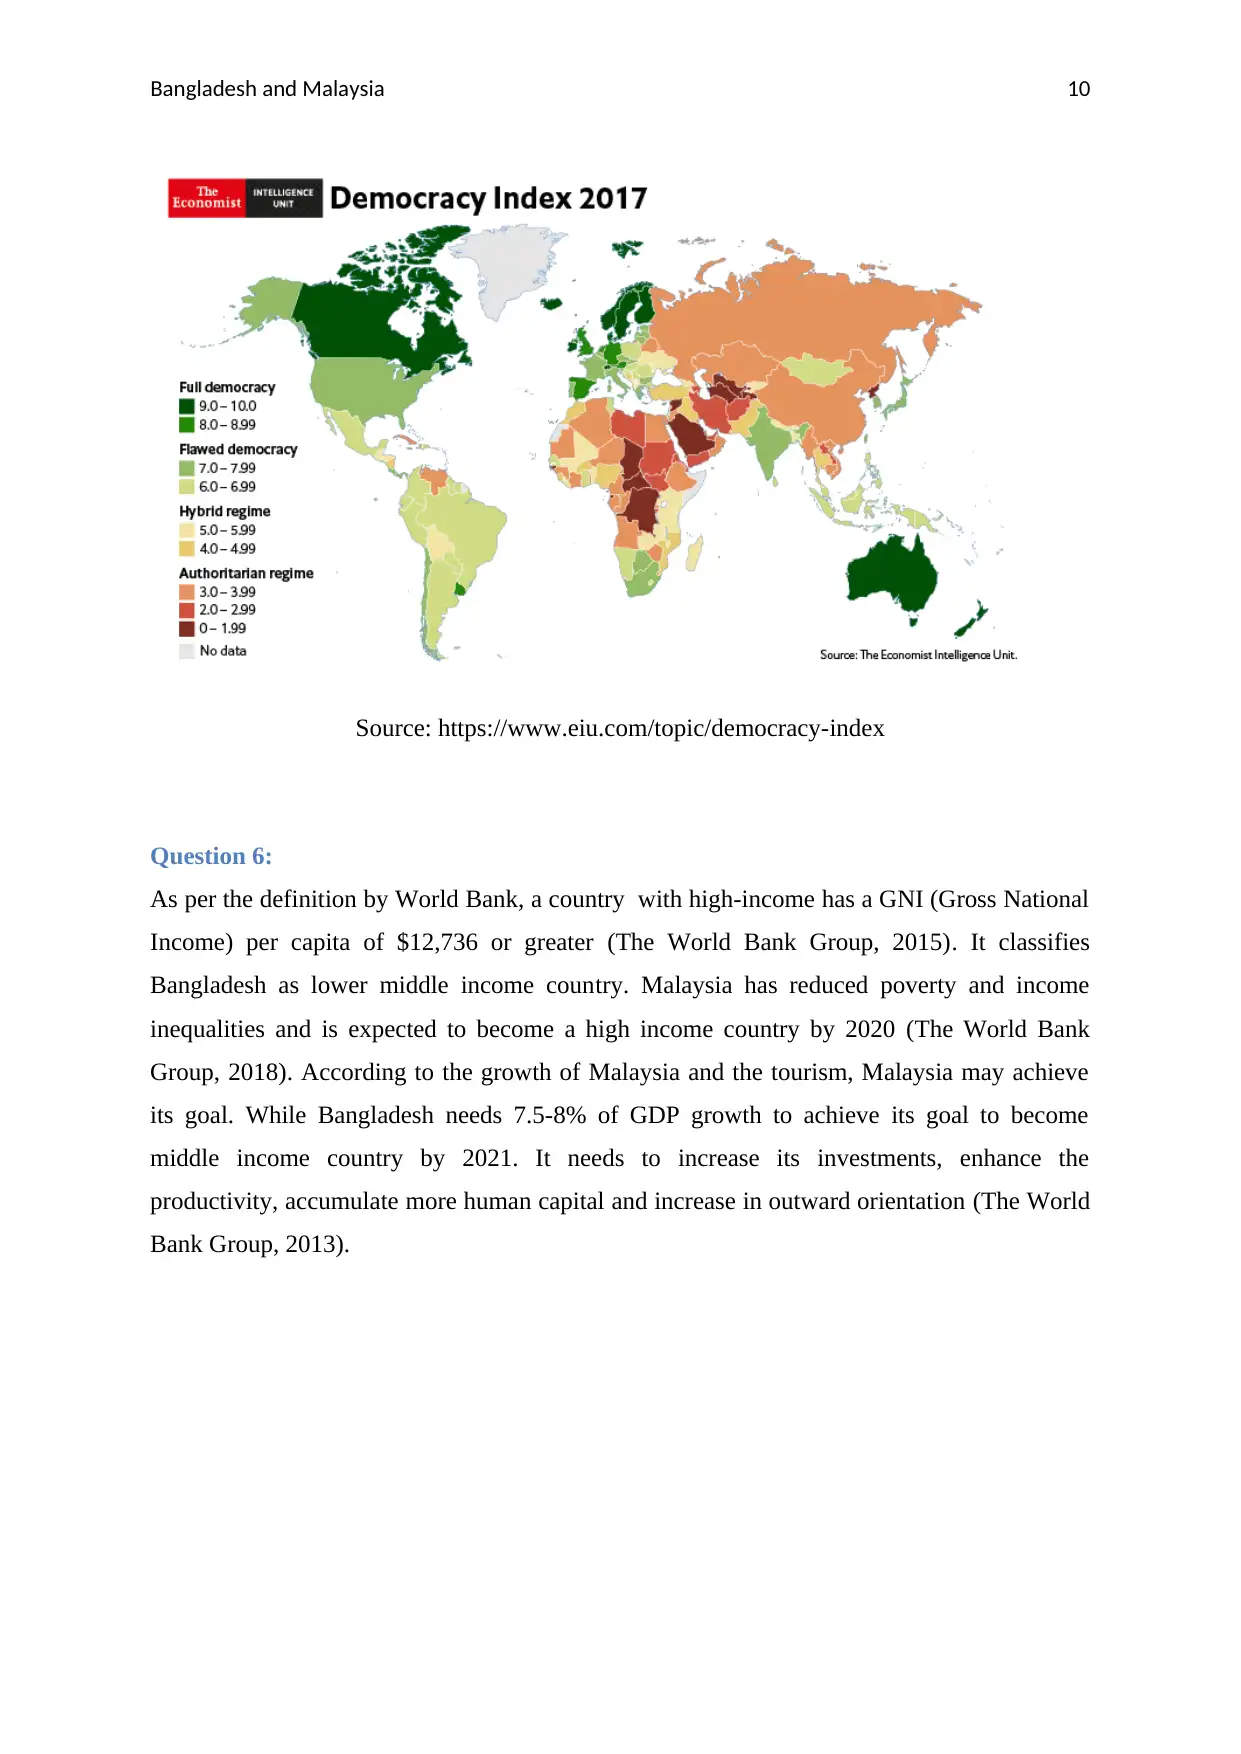
This report provides a comparative analysis of the macroeconomic policies and practices of Bangladesh and Malaysia. It examines the GDP per capita of both countries since 1981, analyzing the growth trends and applying the Solow model to explain potential convergence. The report further investigates government expenditure in the education sector, focusing on accessibility, employability, and overall investment as a percentage of GDP. Various health and life expectancy indicators are also compared, including total health expenditure, crude death rate, life expectancy at birth, and maternal mortality ratios. Additionally, the report assesses corruption perception, press freedom, ease of doing business, and democracy indices in both countries. Finally, it discusses the economic classifications of Bangladesh and Malaysia, highlighting their respective goals for achieving middle-income and high-income status, with reference to data obtained from sources like the World Bank, Transparency International, and Reporters Without Borders. Desklib offers students access to similar solved assignments and past papers.

Running Head: Bangladesh and Malaysia
Macroeconomics Policies and Practices
Bangladesh and Malaysia
Macroeconomics Policies and Practices
Bangladesh and Malaysia
Paraphrase This Document
Need a fresh take? Get an instant paraphrase of this document with our AI Paraphraser

Bangladesh and Malaysia 1
Question 1:
1981
1983
1985
1987
1989
1991
1993
1995
1997
1999
2001
2003
2005
2007
2009
2011
2013
2015
2017
-15
-10
-5
0
5
10
GDP per capita since 1981
Bangladesh
Malaysia
in % (as per Current US$)
(Source: by author)
(Data taken from: World Bank Data)
The data corrected for PPP was missing for the years ranging from 1981 to 1989 and hence
was avoided.
Question 2:
As can be seen from the above graph, Bangladesh had a relatively steady trend of growth
while Malaysia had high fluctuations. Solow model helps explain the convergence of growth
of the two economies to a steady state equilibrium, irrespective of their initial points. Growth
effect can be attained only by technological progress and not saving rate or population
growth. Saving rate and population growth have only level effect. According to the model,
Bangladesh can move towards its potential growth through labour growth, capital
accumulation, investment in human capital and technological advancement (Ahmed, 2014).
This is also important for Malaysia to maintain and improve its growth trend.

Bangladesh and Malaysia 2
Question 3:
I. Government expenditure in the education sector is important because it improves
the accessibility of basic education for the poorer sections of the society. For the
year 1992, education expenditure as a percentage of expenditure of the
government on general public services for Bangladesh and Malaysia was 12.537%
and 17.58% respectively. On the other hand, the data for the year 2013 was
13.823% and 19.454% respectively for Bangladesh and Malaysia (The World
Bank Group, 2018). There has been a improvement in trend of 1.286% and
1.874% in the two countries. Malaysia has better statistics than Bangladesh. (Data
was missing in many of the years)
Source:https://data.worldbank.org/indicator/SE.XPD.TOTL.GB.ZS?
end=2015&locations=BD-MY&start=1998&view=chart
⊘ This is a preview!⊘
Do you want full access?
Subscribe today to unlock all pages.

Trusted by 1+ million students worldwide

Bangladesh and Malaysia 3
II. Education improves the employability of the people. The higher the quality of the
education an its accessibility, the higher is are the chances of being employed.
Primary education develops the social, emotional, cognitive, cultural and physical
skills of the individual. It plays an important role in his/her further education and
employment. It is necessary for the country to provide primary education of all at
least. In 2007, the direct expenditure on education in primary public institutions as
a part of total expenditure on education was 99.513% and 78.614% for Malaysia
and Bangladesh respectively (The World Bank Group, 2018). In 2011 they both
had the same expenditure of 100%. There hass been improvement in case of
Bangladesh. (Data was missing in most of the years)
Source: https://data.worldbank.org/indicator/SE.XPD.CPRM.ZS?end=2016&locations=BD-
MY&start=1998&view=chart
III. The government expenditure on education as a part of GDP helps improve the
basic level of education for all and iproves the employability of the masses. In
Paraphrase This Document
Need a fresh take? Get an instant paraphrase of this document with our AI Paraphraser

Bangladesh and Malaysia 4
Bangladesha and Malaysia it was 1.625% and 5.101% respectively in the year
1992. The same index showed 1.957% and 5.474% expenditure as a part of GDP
for Bangladesh and Malaysia respectively (The World Bank Group, 2018).
Source:https://data.worldbank.org/indicator/SE.XPD.TOTL.GD.ZS?
end=2016&locations=BD-MY&start=1992&view=chart
Question 4:
Various Health and Life expectancy indicators:
I. It is expected that with the higher health expenditure by people as a part of GDP
will lead to improvement in the quality of life and the life expectancy. Total health
expenditure as a percentage of GDP includes the health expenditure both public
and pivate. It was 3.222% and 2.964% in Bangladesh and Malaysia in the year
1995. In the year 2014 it was 2.819% and 4.169% respectively (The World Bank

Bangladesh and Malaysia 5
Group, 2018). Malaysia has shown an increase in the expenditure while
Bangladesh has shown a decline.
Source: https://data.worldbank.org/indicator/SH.XPD.TOTL.ZS?locations=BD-
MY&view=chart
II. Crude death rate is used to indicate the number of deaths that occur per 1,000
people during the year. Poorer the facilities in the country, higher is the value.
Death rate per 1,000 people in 1992 in Bangladesh was 9.488 and in Malaysia was
4.797. In the year 2015 it was 5.312 for Bangladesh and 4.865 in Malaysia (The
World Bank Group, 2018). Bangladesh has shown a sharp decline since 1992
while Malaysia has increased magnitudes.
⊘ This is a preview!⊘
Do you want full access?
Subscribe today to unlock all pages.

Trusted by 1+ million students worldwide

Bangladesh and Malaysia 6
Source: https://data.worldbank.org/indicator/SP.DYN.CDRT.IN?end=2015&locations=BD-
MY&start=1992&view=chart
III. Life expectancy at the time of birth shows the anticipated number of years that a
new born is expected to live given the prevailing mortality patterns. Higher the
expectancy of life, the better are the chances of the survival of th new born. In the
year 1992, life expectancy in Bangladesh was 59.707 years while Malaysia had
71.198 years. In the year 2015, it was 72.222 years and 75.22 years for
Bangladesh and Malaysia respectively (The World Bank Group, 2018).
Bangladesh has improved greatly while Malaysia has tried to achieve stability
with some improvement comparatively.
Paraphrase This Document
Need a fresh take? Get an instant paraphrase of this document with our AI Paraphraser

Bangladesh and Malaysia 7
Source: https://data.worldbank.org/indicator/SP.DYN.LE00.IN?end=2015&locations=BD-
MY&start=1992&view=chart
IV. Maternal mortality includes the number of woment who die because of
pregnancy-related issues which could be during the pregnancy or within the 42
days of it. This indicates the lack of healthcare facilitie and nutrition among the
women. This index in 1995 showed the ratio of 68 for Malaysia and 479 for
Bangladesh. In 2015, Malaysia improved its perfoemance with the ratio of 40
while Bangladesh showed a drastic fall to 176 (The World Bank Group, 2018).
Even though Bangladesh has showed improvement there is still a huge scope.

Bangladesh and Malaysia 8
Source: https://data.worldbank.org/indicator/SH.STA.MMRT?end=2015&locations=BD-
MY&start=1995&view=chart
Question 5:
Corruption Perception Index:
Corruption perception index by Tranparency International takes into account 180 countries
for the year 2017 and classifies them based on the level of corruption in the public sector, as
per the experts. The scale used ranges from 0 to 100 wherein 0 indicates high level of
corruption and a very clean country is indicated by 100. The index places Malaysia on 62nd
rank with a score of 47 in the year 2017. The same index places Bangladesh on the 143rd rank
with the score of 28 in the year 2017. In 2012, Malaysia had a score of 49 while Bangladesh
had a score of 26. Malaysia has fallen in its score while Bangladesh has improved the score
(Transparency International, 2018).
⊘ This is a preview!⊘
Do you want full access?
Subscribe today to unlock all pages.

Trusted by 1+ million students worldwide

Bangladesh and Malaysia 9
World Press Freedom Index:
World Press freedom index given by Reporters Without Borders is an index which ranks
countris annually based on their press freedom records in the last year and scores them. The
lower the score, the greater the freedom of press. It places Bangladesh on 146th rank while
Malaysia on 144th rank. Malaysia has more freedom of press than Bangladesh (Reporters
without borders, 2018).
Ease of doing Business:
World Bank ranks countries from 1-90 based on the ease of doing business. If a country has
high ease of doing business, then it implies that the legal environment promotes and
facilitates the growing and upcoming firms. It ranked Malaysia on 24th position and
Bangladesh on 177th position (The World Bank Group, 2017).
Democracy Index:
Democracy protects the citizen’s interests, provides stable administration and promotes the
equality. Democracy index index lists economies on the basis of level of democracy. It ranks
167 countries on the scale of 0-10. The higher the magnitude, the better is the economy from
the citizen’s interests. Hence, the higher value is preferred. Bangladesh was given 5.73
magnitude in 2016 while Malaysia was given 6.54 magnitude (The Economist Intelligence
Unit, 2018). On the basis on the below scale, Bangladesh has a hybrid rgime while Malaysia
is a flawed democracy.
Paraphrase This Document
Need a fresh take? Get an instant paraphrase of this document with our AI Paraphraser

Bangladesh and Malaysia 10
Source: https://www.eiu.com/topic/democracy-index
Question 6:
As per the definition by World Bank, a country with high-income has a GNI (Gross National
Income) per capita of $12,736 or greater (The World Bank Group, 2015). It classifies
Bangladesh as lower middle income country. Malaysia has reduced poverty and income
inequalities and is expected to become a high income country by 2020 (The World Bank
Group, 2018). According to the growth of Malaysia and the tourism, Malaysia may achieve
its goal. While Bangladesh needs 7.5-8% of GDP growth to achieve its goal to become
middle income country by 2021. It needs to increase its investments, enhance the
productivity, accumulate more human capital and increase in outward orientation (The World
Bank Group, 2013).

Bangladesh and Malaysia 11
References
Ahmed, S. (2014, June 22). Searching for Sources of Growth in Bangladesh. Bangladesh
Economists’ Forum, 1-30. Retrieved April 04, 2018, from
http://www.pri-bd.org/upload/file/bef_paper/1414213387.pdf
Reporters without borders. (2018). 2017 World Press Freedom Index. Retrieved April 04,
2018, from Reporters without borders: https://rsf.org/en/ranking
The Economist Intelligence Unit. (2018). The Economist Intelligence Unit's Democracy
Index. Retrieved April 04, 2018, from The Economist Intelligence Unit:
https://infographics.economist.com/2017/DemocracyIndex/
The World Bank Group. (2013, September 01). What will it take for Bangladesh to become a
Middle Income Country? Retrieved April 04, 2018, from World Bank:
http://blogs.worldbank.org/endpovertyinsouthasia/what-will-it-take-bangladesh-
become-middle-income-country
The World Bank Group. (2015, February 07). New Country Classifications. Retrieved April
04, 2018, from World Bank: https://blogs.worldbank.org/opendata/new-country-
classifications
The World Bank Group. (2017). Doing Business. Retrieved April 04, 2018, from World
Bank: http://www.doingbusiness.org/rankings
The World Bank Group. (2018). Current Education Expenditure, Primary. Retrieved from
World Bank: https://data.worldbank.org/indicator/SE.XPD.CPRM.ZS?
end=2016&locations=BD-MY&start=1998&view=chart
The World Bank Group. (2018). Death Rate, Crude. Retrieved April 04, 2018, from World
Bank: https://data.worldbank.org/indicator/SP.DYN.CDRT.IN?
end=2015&locations=BD-MY&start=1992&view=chart
The World Bank Group. (2018). Expenditure on Education as % of Total Government
Expenditure. Retrieved April 2018, from World Bank:
⊘ This is a preview!⊘
Do you want full access?
Subscribe today to unlock all pages.

Trusted by 1+ million students worldwide
1 out of 13
Related Documents

Your All-in-One AI-Powered Toolkit for Academic Success.
+13062052269
info@desklib.com
Available 24*7 on WhatsApp / Email
Unlock your academic potential
Copyright © 2020–2025 A2Z Services. All Rights Reserved. Developed and managed by ZUCOL.