Business Finance: Report on Liquidity and Capital Structure of BOQ
VerifiedAdded on 2022/08/24
|12
|2940
|15
Report
AI Summary
This report provides a detailed financial analysis of the Bank of Queensland (BOQ), an Australian retail bank. It examines the bank's liquidity and capital structure from 2016 to 2019, utilizing financial ratios such as the current ratio, quick ratio, and debt ratio. The analysis includes a calculation of the cost of equity using the dividend growth model, offering insights into the required rate of return for shareholders. The report highlights BOQ's net working capital position, capital structure ratios, and overall financial risk. The findings suggest that the bank has a low working capital and a high debt ratio. The report also includes recommendations based on the financial data and industry trends, providing a comprehensive overview of BOQ's financial health and performance.
Running head: BUSINESS FINANCE
Business Finance
Name of the Student:
Name of the University:
Author’s Note:
Business Finance
Name of the Student:
Name of the University:
Author’s Note:
Paraphrase This Document
Need a fresh take? Get an instant paraphrase of this document with our AI Paraphraser
1BUSINESS FINANCE
Table of Contents
Introduction......................................................................................................................................2
Discussion and Analysis..................................................................................................................2
Company Overview.....................................................................................................................2
Cost of Equity..............................................................................................................................4
Liquidity and Capital Structure...................................................................................................5
Capital Structure Ratio................................................................................................................6
Conclusion and Recommendations..................................................................................................9
References......................................................................................................................................10
2BUSINESS FINANCE
Introduction
The assignment aims at evaluating the Bank of Queensland which is an Australian Retail
Bank that is having its headquarters in the Brisbane, Queensland. The analyzed bank is regarded
as one of the oldest operating financial institution in the Queensland and is having around 252
branches and 166 “owner managed” branches. The bank in specific has been analyzed in terms
of liquidity and capital structure whereby important aspects of the company has been analyzed in
order to get a review of the financial position of the company. Financial risk is one of the key
risk that the banking industry faces and the same has been well analyzed with the help of debt
ratio and total capital employed ratio which were some of the key aspects analyzed. On the other
hand, for analyzing the liquidity position of the company key ratio’s like current ratio and quick
ratio have been well deployed for the purpose of analyzing the financial statements of the
company. The application of the Dividend Growth Model has also been done specifically for the
purpose of well analyzing the Required Rate of Return from the stock analyzed (Boq.com.au
2020). From the view point of recommendation there were various factors and reasons which are
well associated with the company that have been analyzed based on the given set of numbers.
Discussion and Analysis
Company Overview
The analysis of the company has been done in specific with the help of the business
operations and activities that it undertakes for the purpose of well carrying on its business
activities. The Bank of Queensland is a key Australian Retail Bank that is headquartered in the
Brisbane, Queensland (Carletti, Goldstein and Leonello 2020). The analyzed bank is one of the
key and oldest operating financial institutions that is having around 252 branches throughout the
Australian region, which also includes the 78 corporate branches and a base of around 166
“owned managed” branches in the Australian Region. The bank is considered and regarded as
one of the top 100 Australian Companies that are ranked and marked in terms of market
capitalization on the Australian Securities Exchange. The company is well regulated with the
help of the Australian Prudential Regulation Authority and is also considered as an Authorized
⊘ This is a preview!⊘
Do you want full access?
Subscribe today to unlock all pages.
Trusted by 1+ million students worldwide
3BUSINESS FINANCE
Deposit taking institution. The key branches of the company in particular or key companies that
operates under the BOQ are as follows:
Virgin Money Australia: The BOQ offers and operates a number of brands that
is having a diversified range of products and services for the various personal and
business customers (Rehman et al., 2019).
BOQ Finance: The subsidiary is wholly owned by the BOQ, that well specializes
in management of assets, cash flows and other structured financial solutions.
BOQF is a key mid-market financier that provides deep industry and products
skills.
BOQ Specialist: BOQ Specializes in delivering distinctive banking solutions to
the niche market segments that well includes medical, dental and accounting
experts.
St. Andrew Insurance: St. Andrew acts as a leading Australian provider of
various life insurance products and consumer insurance products that are offered
by the company. Since, the year 1998, the company have been well helping to
protect the Australians by giving or delivering an innovative and streamlined
insurance solutions for various corporate partners and customers.
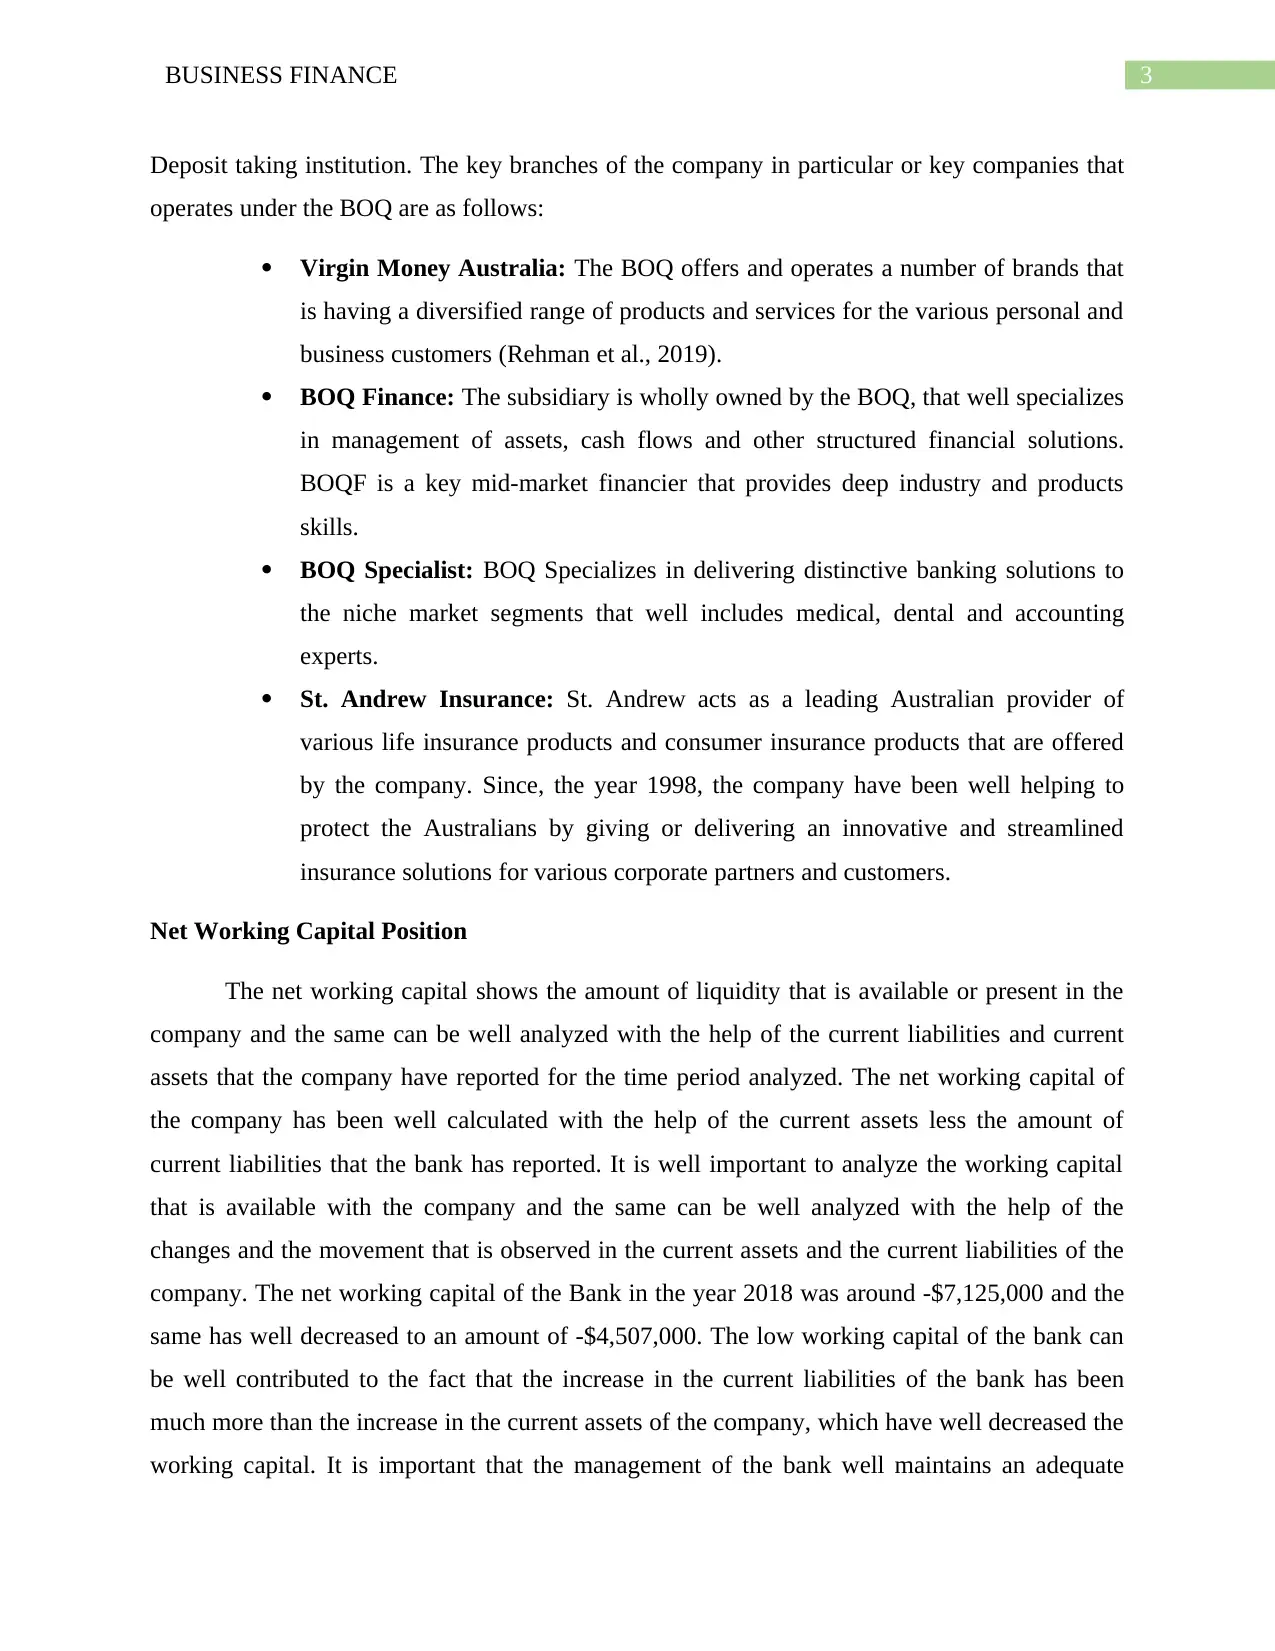
Net Working Capital Position
The net working capital shows the amount of liquidity that is available or present in the
company and the same can be well analyzed with the help of the current liabilities and current
assets that the company have reported for the time period analyzed. The net working capital of
the company has been well calculated with the help of the current assets less the amount of
current liabilities that the bank has reported. It is well important to analyze the working capital
that is available with the company and the same can be well analyzed with the help of the
changes and the movement that is observed in the current assets and the current liabilities of the
company. The net working capital of the Bank in the year 2018 was around -$7,125,000 and the
same has well decreased to an amount of -$4,507,000. The low working capital of the bank can
be well contributed to the fact that the increase in the current liabilities of the bank has been
much more than the increase in the current assets of the company, which have well decreased the
working capital. It is important that the management of the bank well maintains an adequate
Deposit taking institution. The key branches of the company in particular or key companies that
operates under the BOQ are as follows:
Virgin Money Australia: The BOQ offers and operates a number of brands that
is having a diversified range of products and services for the various personal and
business customers (Rehman et al., 2019).
BOQ Finance: The subsidiary is wholly owned by the BOQ, that well specializes
in management of assets, cash flows and other structured financial solutions.
BOQF is a key mid-market financier that provides deep industry and products
skills.
BOQ Specialist: BOQ Specializes in delivering distinctive banking solutions to
the niche market segments that well includes medical, dental and accounting
experts.
St. Andrew Insurance: St. Andrew acts as a leading Australian provider of
various life insurance products and consumer insurance products that are offered
by the company. Since, the year 1998, the company have been well helping to
protect the Australians by giving or delivering an innovative and streamlined
insurance solutions for various corporate partners and customers.
Net Working Capital Position
The net working capital shows the amount of liquidity that is available or present in the
company and the same can be well analyzed with the help of the current liabilities and current
assets that the company have reported for the time period analyzed. The net working capital of
the company has been well calculated with the help of the current assets less the amount of
current liabilities that the bank has reported. It is well important to analyze the working capital
that is available with the company and the same can be well analyzed with the help of the
changes and the movement that is observed in the current assets and the current liabilities of the
company. The net working capital of the Bank in the year 2018 was around -$7,125,000 and the
same has well decreased to an amount of -$4,507,000. The low working capital of the bank can
be well contributed to the fact that the increase in the current liabilities of the bank has been
much more than the increase in the current assets of the company, which have well decreased the
working capital. It is important that the management of the bank well maintains an adequate
Paraphrase This Document
Need a fresh take? Get an instant paraphrase of this document with our AI Paraphraser
4BUSINESS FINANCE
amount of working capital in the business so that the various business operations of the company
are well meet and the current obligations of the company are well paid in the due course of time
period. The current obligations or the current liabilities are in the form of accrued expenses or
the amount attributable to the accounts payables of the bank. It is important to note that since, the
bank are having a low amount of working capital they might have to and would be using long
term sources of finance for the purpose of meeting the current obligations of the company. The
better the management of the working capital the better is the operations and activities carried
out by the company for the purpose of handling the operations of the company.
Cost of Equity
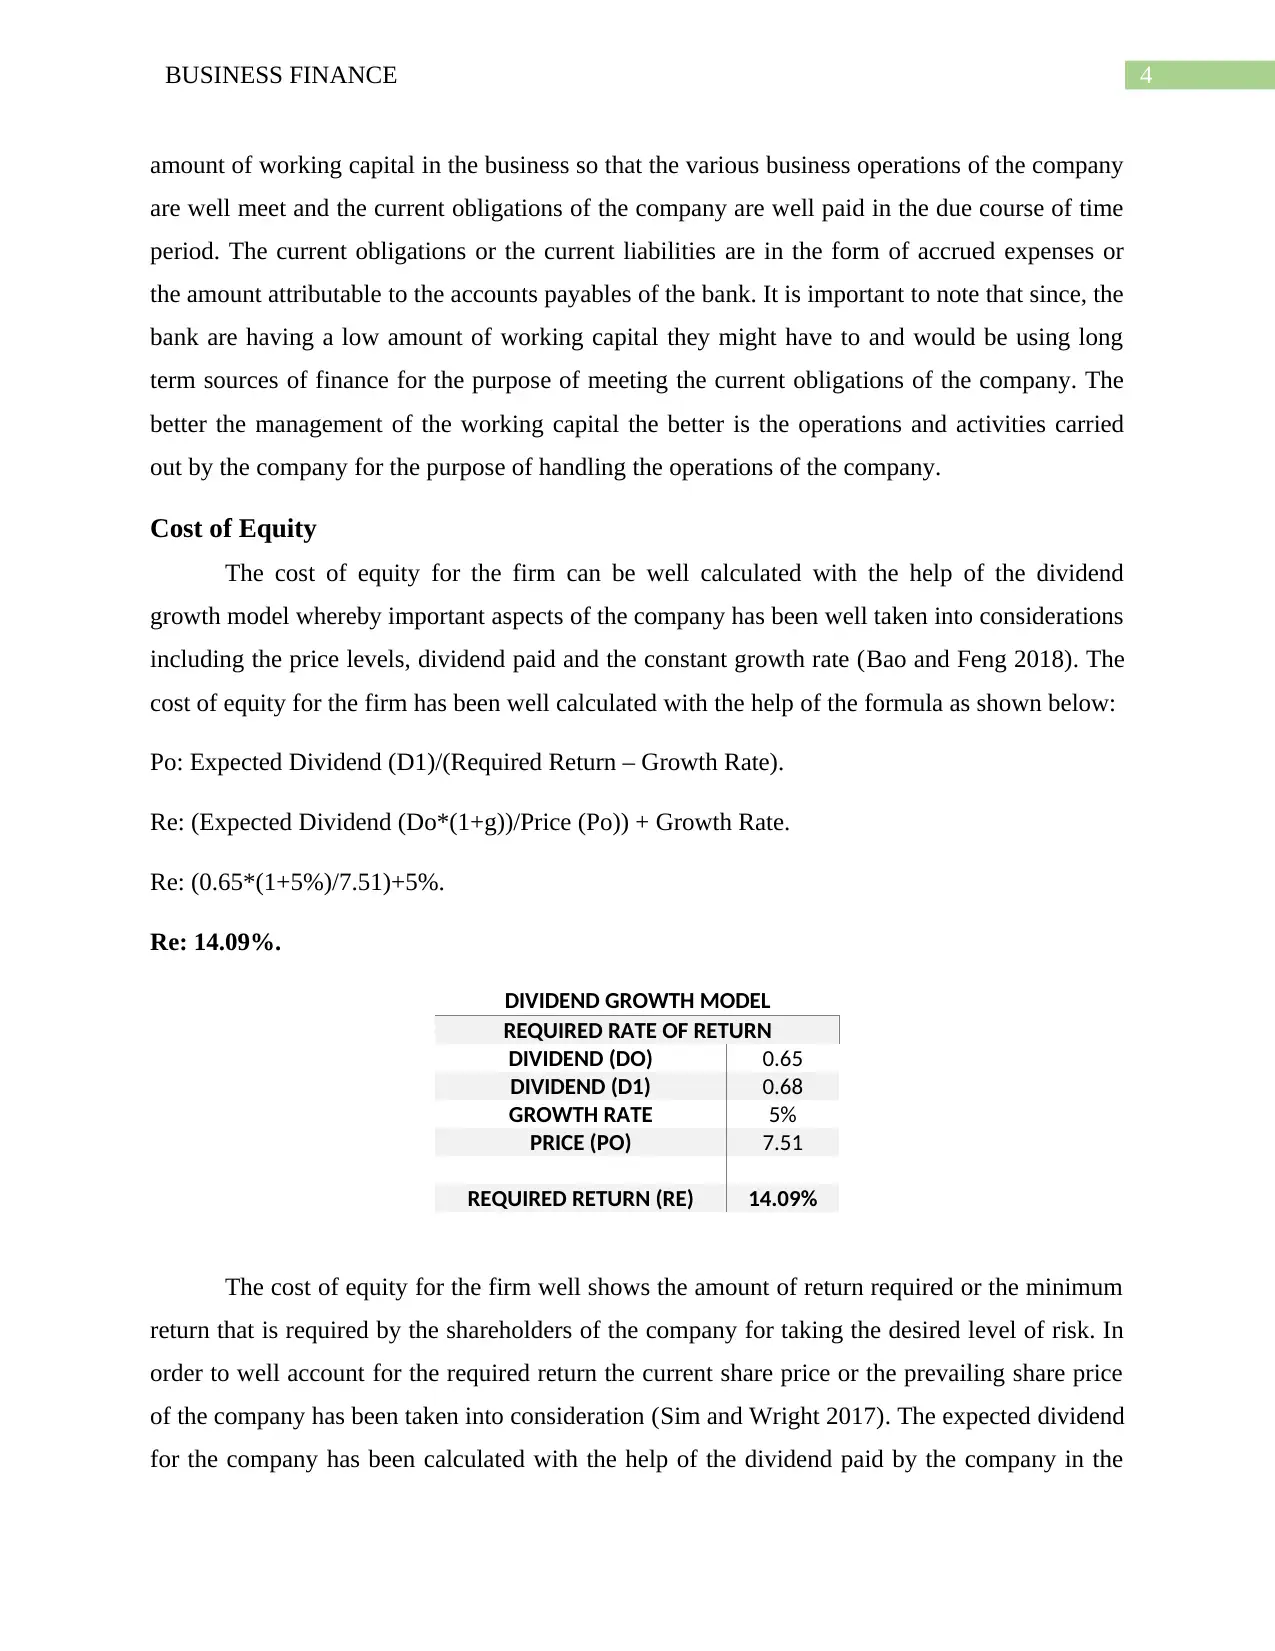
The cost of equity for the firm can be well calculated with the help of the dividend
growth model whereby important aspects of the company has been well taken into considerations
including the price levels, dividend paid and the constant growth rate (Bao and Feng 2018). The
cost of equity for the firm has been well calculated with the help of the formula as shown below:
Po: Expected Dividend (D1)/(Required Return – Growth Rate).
Re: (Expected Dividend (Do*(1+g))/Price (Po)) + Growth Rate.
Re: (0.65*(1+5%)/7.51)+5%.
Re: 14.09%.
DIVIDEND GROWTH MODEL
REQUIRED RATE OF RETURN
DIVIDEND (DO) 0.65
DIVIDEND (D1) 0.68
GROWTH RATE 5%
PRICE (PO) 7.51
REQUIRED RETURN (RE) 14.09%
The cost of equity for the firm well shows the amount of return required or the minimum
return that is required by the shareholders of the company for taking the desired level of risk. In
order to well account for the required return the current share price or the prevailing share price
of the company has been taken into consideration (Sim and Wright 2017). The expected dividend
for the company has been calculated with the help of the dividend paid by the company in the
amount of working capital in the business so that the various business operations of the company
are well meet and the current obligations of the company are well paid in the due course of time
period. The current obligations or the current liabilities are in the form of accrued expenses or
the amount attributable to the accounts payables of the bank. It is important to note that since, the
bank are having a low amount of working capital they might have to and would be using long
term sources of finance for the purpose of meeting the current obligations of the company. The
better the management of the working capital the better is the operations and activities carried
out by the company for the purpose of handling the operations of the company.
Cost of Equity
The cost of equity for the firm can be well calculated with the help of the dividend
growth model whereby important aspects of the company has been well taken into considerations
including the price levels, dividend paid and the constant growth rate (Bao and Feng 2018). The
cost of equity for the firm has been well calculated with the help of the formula as shown below:
Po: Expected Dividend (D1)/(Required Return – Growth Rate).
Re: (Expected Dividend (Do*(1+g))/Price (Po)) + Growth Rate.
Re: (0.65*(1+5%)/7.51)+5%.
Re: 14.09%.
DIVIDEND GROWTH MODEL
REQUIRED RATE OF RETURN
DIVIDEND (DO) 0.65
DIVIDEND (D1) 0.68
GROWTH RATE 5%
PRICE (PO) 7.51
REQUIRED RETURN (RE) 14.09%
The cost of equity for the firm well shows the amount of return required or the minimum
return that is required by the shareholders of the company for taking the desired level of risk. In
order to well account for the required return the current share price or the prevailing share price
of the company has been taken into consideration (Sim and Wright 2017). The expected dividend
for the company has been calculated with the help of the dividend paid by the company in the
5BUSINESS FINANCE
last year multiplied by the constant growth model which was around 5%. The cost of equity for
the firm was calculated to be around 14.09% for the Bank of Queensland, which well reflects the
required rate of return that is derived or expected from the bank in the given set of time frame.
The cost of equity for the firm can be also calculated with the help of other key models like with
the help of the Capital Asset pricing model which well takes into account various market related
factors for determining the appropriate level of required return that is required by the
shareholders of the company for taking the level of risk that is undertaken. In this case since we
have incorporate the dividend discount model all the factors that are in well relation to the
company including the share price, dividend and the given set of information for the growth rate
the required rate of return for the stock has been calculated for current tine period.
Liquidity and Capital Structure
The liquidity and the capital structure of the company can be well analyzed by analyzing
the current assets and current liabilities that the company have reported in the financials for the
time period analyzed. On the other hand, the capital structure of the bank can be well analyzed
with the help and analyzing the application of debt that the company has done in correspondence
to the total assets and total capital that has been deployed for the year. The time period over
which the analysis has been well carried out for the firm has been for the period 2016-2019 and
the relevant changes that have been observed in the financials of the company for the stated time
period has been well taken into consideration (Mursalini, Husni and Hamidi 2017).
Liquidity Factor: The liquidity factor states how well the bank or the company is in managing
the current obligations of the company and the same can be well analyzed with the help of the
current ratio (Bouwman 2019). The metric states the amount of current assets that is primarily in
the form of cash & cash equivalents, accounts receivables and other short term investments that
the company well has in the stated time period for well tackling or for well paying off the current
obligations of the company. It is important that the company well manages there liquidity in a
crucial manner so that the current obligations of the company does not affect the business
operations or the various banking activities that is usually carried out by the bank
(Au.finance.yahoo.com 2019).
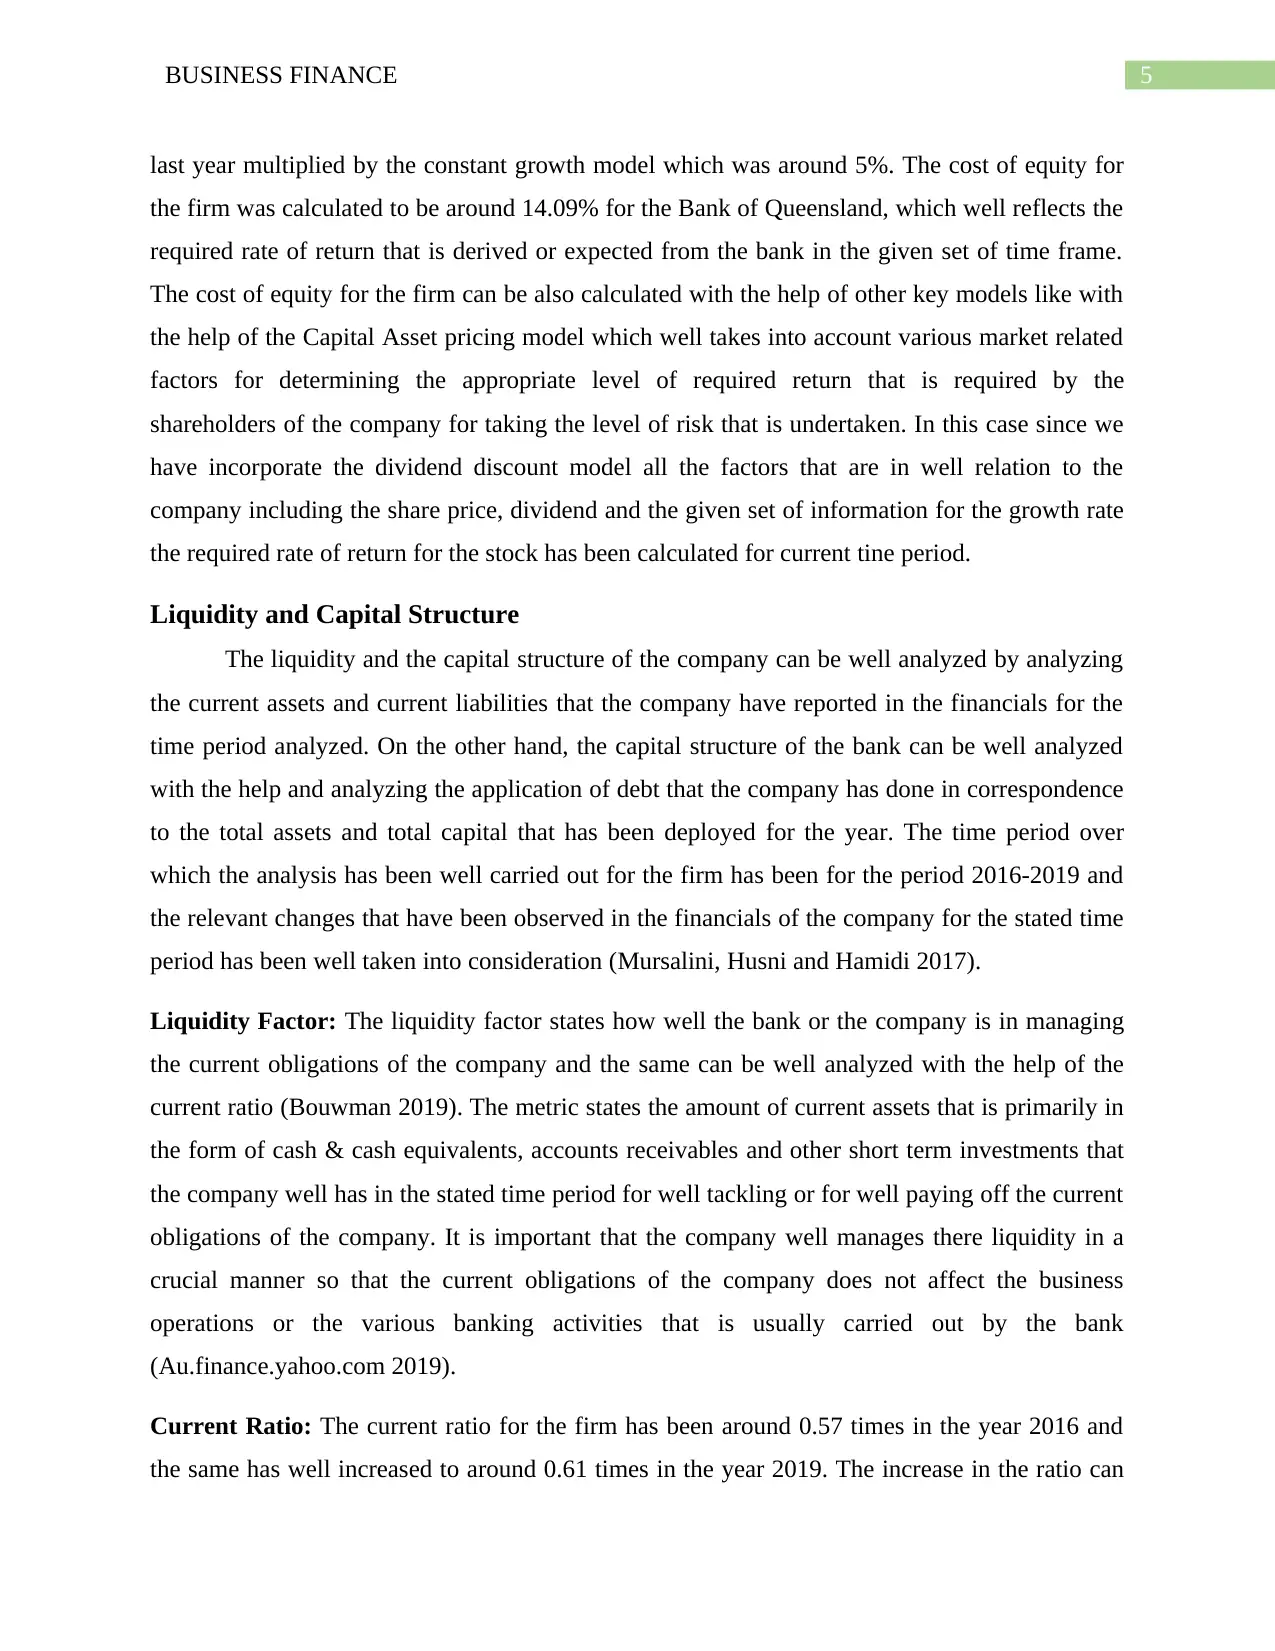
Current Ratio: The current ratio for the firm has been around 0.57 times in the year 2016 and
the same has well increased to around 0.61 times in the year 2019. The increase in the ratio can
last year multiplied by the constant growth model which was around 5%. The cost of equity for
the firm was calculated to be around 14.09% for the Bank of Queensland, which well reflects the
required rate of return that is derived or expected from the bank in the given set of time frame.
The cost of equity for the firm can be also calculated with the help of other key models like with
the help of the Capital Asset pricing model which well takes into account various market related
factors for determining the appropriate level of required return that is required by the
shareholders of the company for taking the level of risk that is undertaken. In this case since we
have incorporate the dividend discount model all the factors that are in well relation to the
company including the share price, dividend and the given set of information for the growth rate
the required rate of return for the stock has been calculated for current tine period.
Liquidity and Capital Structure
The liquidity and the capital structure of the company can be well analyzed by analyzing
the current assets and current liabilities that the company have reported in the financials for the
time period analyzed. On the other hand, the capital structure of the bank can be well analyzed
with the help and analyzing the application of debt that the company has done in correspondence
to the total assets and total capital that has been deployed for the year. The time period over
which the analysis has been well carried out for the firm has been for the period 2016-2019 and
the relevant changes that have been observed in the financials of the company for the stated time
period has been well taken into consideration (Mursalini, Husni and Hamidi 2017).
Liquidity Factor: The liquidity factor states how well the bank or the company is in managing
the current obligations of the company and the same can be well analyzed with the help of the
current ratio (Bouwman 2019). The metric states the amount of current assets that is primarily in
the form of cash & cash equivalents, accounts receivables and other short term investments that
the company well has in the stated time period for well tackling or for well paying off the current
obligations of the company. It is important that the company well manages there liquidity in a
crucial manner so that the current obligations of the company does not affect the business
operations or the various banking activities that is usually carried out by the bank
(Au.finance.yahoo.com 2019).
Current Ratio: The current ratio for the firm has been around 0.57 times in the year 2016 and
the same has well increased to around 0.61 times in the year 2019. The increase in the ratio can
⊘ This is a preview!⊘
Do you want full access?
Subscribe today to unlock all pages.
Trusted by 1+ million students worldwide
6BUSINESS FINANCE
be well analyzed with the help of the marginal increase in the current asset. However, it is
important to note that the ratio currently is low stating the bank just have around 50%-60% of the
amount locked in current assets for meeting their current obligations and the same can be well
explained with the help of the stated graph below:
2016 2017 2018 2019
0.00
0.10
0.20
0.30
0.40
0.50
0.60
0.70
0.57
0.31 0.27
0.61
Current Ratio
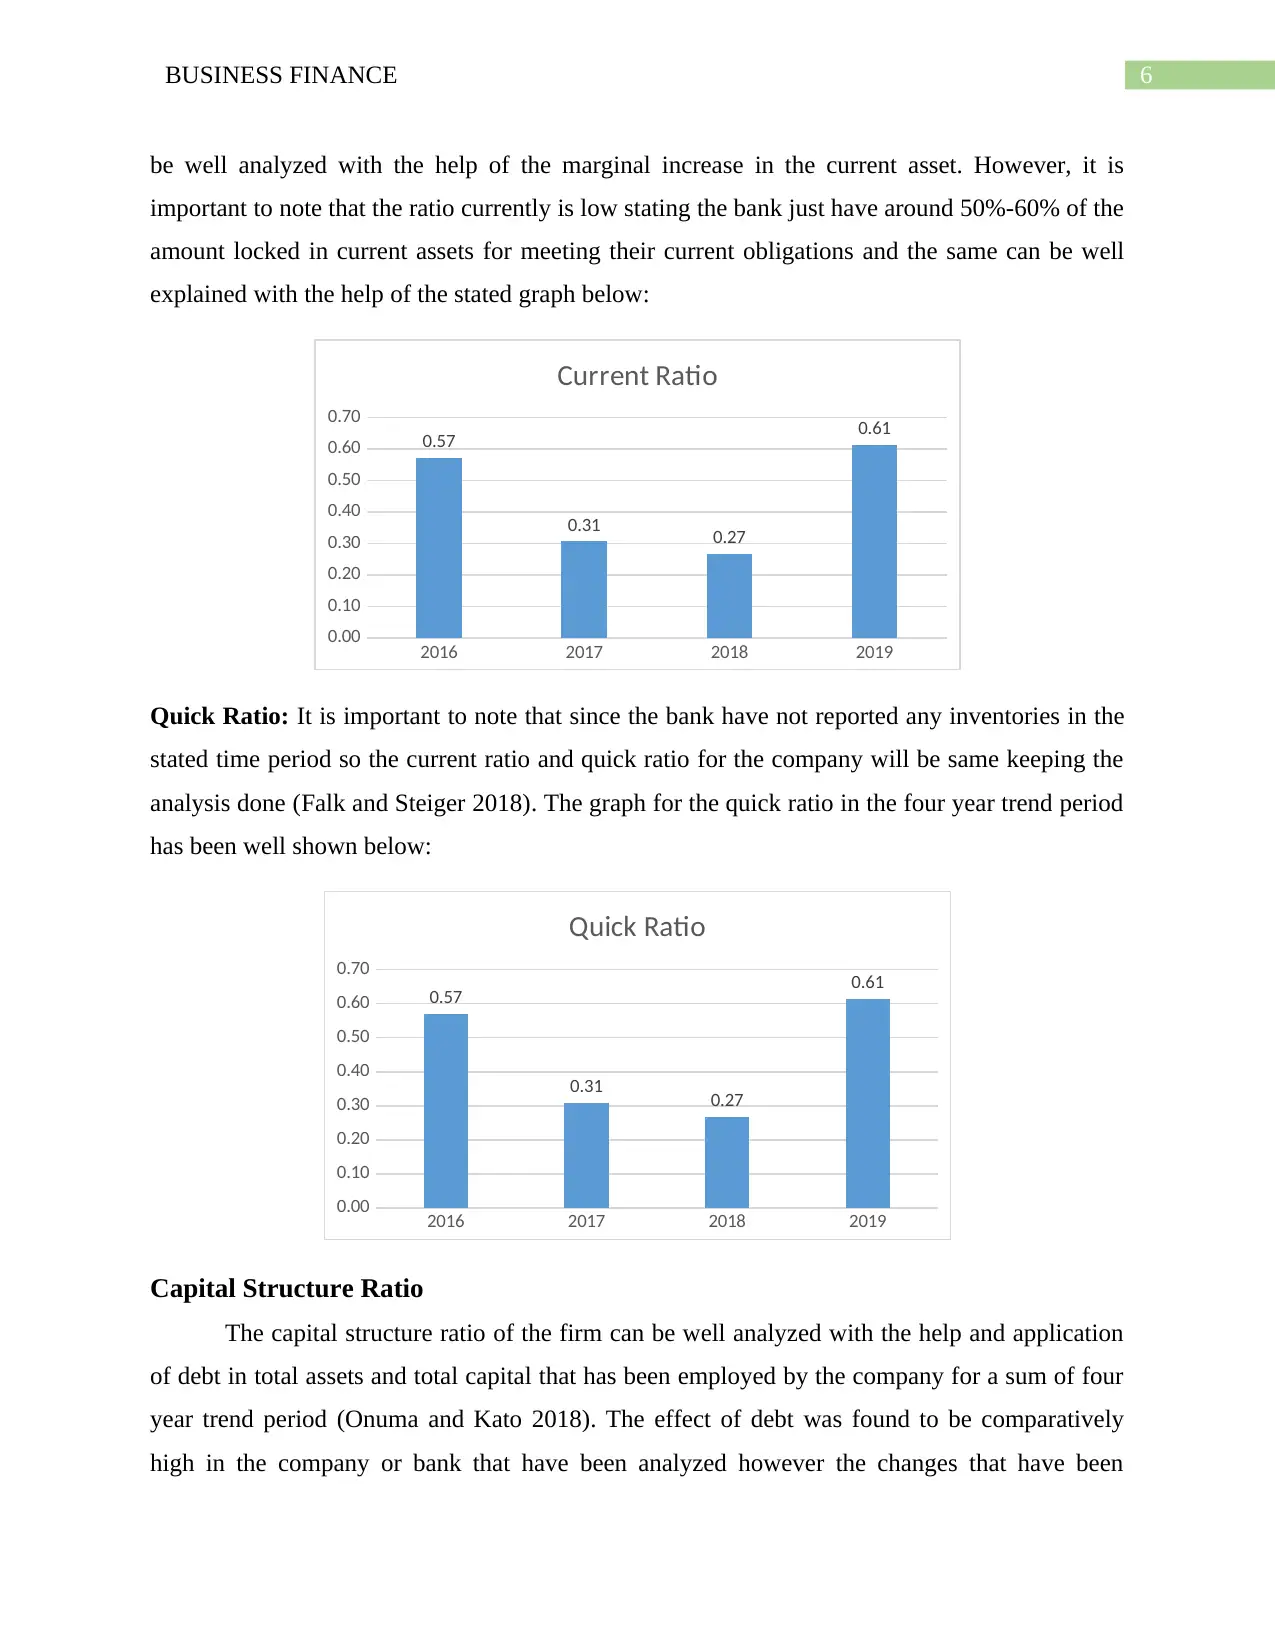
Quick Ratio: It is important to note that since the bank have not reported any inventories in the
stated time period so the current ratio and quick ratio for the company will be same keeping the
analysis done (Falk and Steiger 2018). The graph for the quick ratio in the four year trend period
has been well shown below:
2016 2017 2018 2019
0.00
0.10
0.20
0.30
0.40
0.50
0.60
0.70
0.57
0.31 0.27
0.61
Quick Ratio
Capital Structure Ratio
The capital structure ratio of the firm can be well analyzed with the help and application
of debt in total assets and total capital that has been employed by the company for a sum of four
year trend period (Onuma and Kato 2018). The effect of debt was found to be comparatively
high in the company or bank that have been analyzed however the changes that have been
be well analyzed with the help of the marginal increase in the current asset. However, it is
important to note that the ratio currently is low stating the bank just have around 50%-60% of the
amount locked in current assets for meeting their current obligations and the same can be well
explained with the help of the stated graph below:
2016 2017 2018 2019
0.00
0.10
0.20
0.30
0.40
0.50
0.60
0.70
0.57
0.31 0.27
0.61
Current Ratio
Quick Ratio: It is important to note that since the bank have not reported any inventories in the
stated time period so the current ratio and quick ratio for the company will be same keeping the
analysis done (Falk and Steiger 2018). The graph for the quick ratio in the four year trend period
has been well shown below:
2016 2017 2018 2019
0.00
0.10
0.20
0.30
0.40
0.50
0.60
0.70
0.57
0.31 0.27
0.61
Quick Ratio
Capital Structure Ratio
The capital structure ratio of the firm can be well analyzed with the help and application
of debt in total assets and total capital that has been employed by the company for a sum of four
year trend period (Onuma and Kato 2018). The effect of debt was found to be comparatively
high in the company or bank that have been analyzed however the changes that have been
Paraphrase This Document
Need a fresh take? Get an instant paraphrase of this document with our AI Paraphraser
7BUSINESS FINANCE
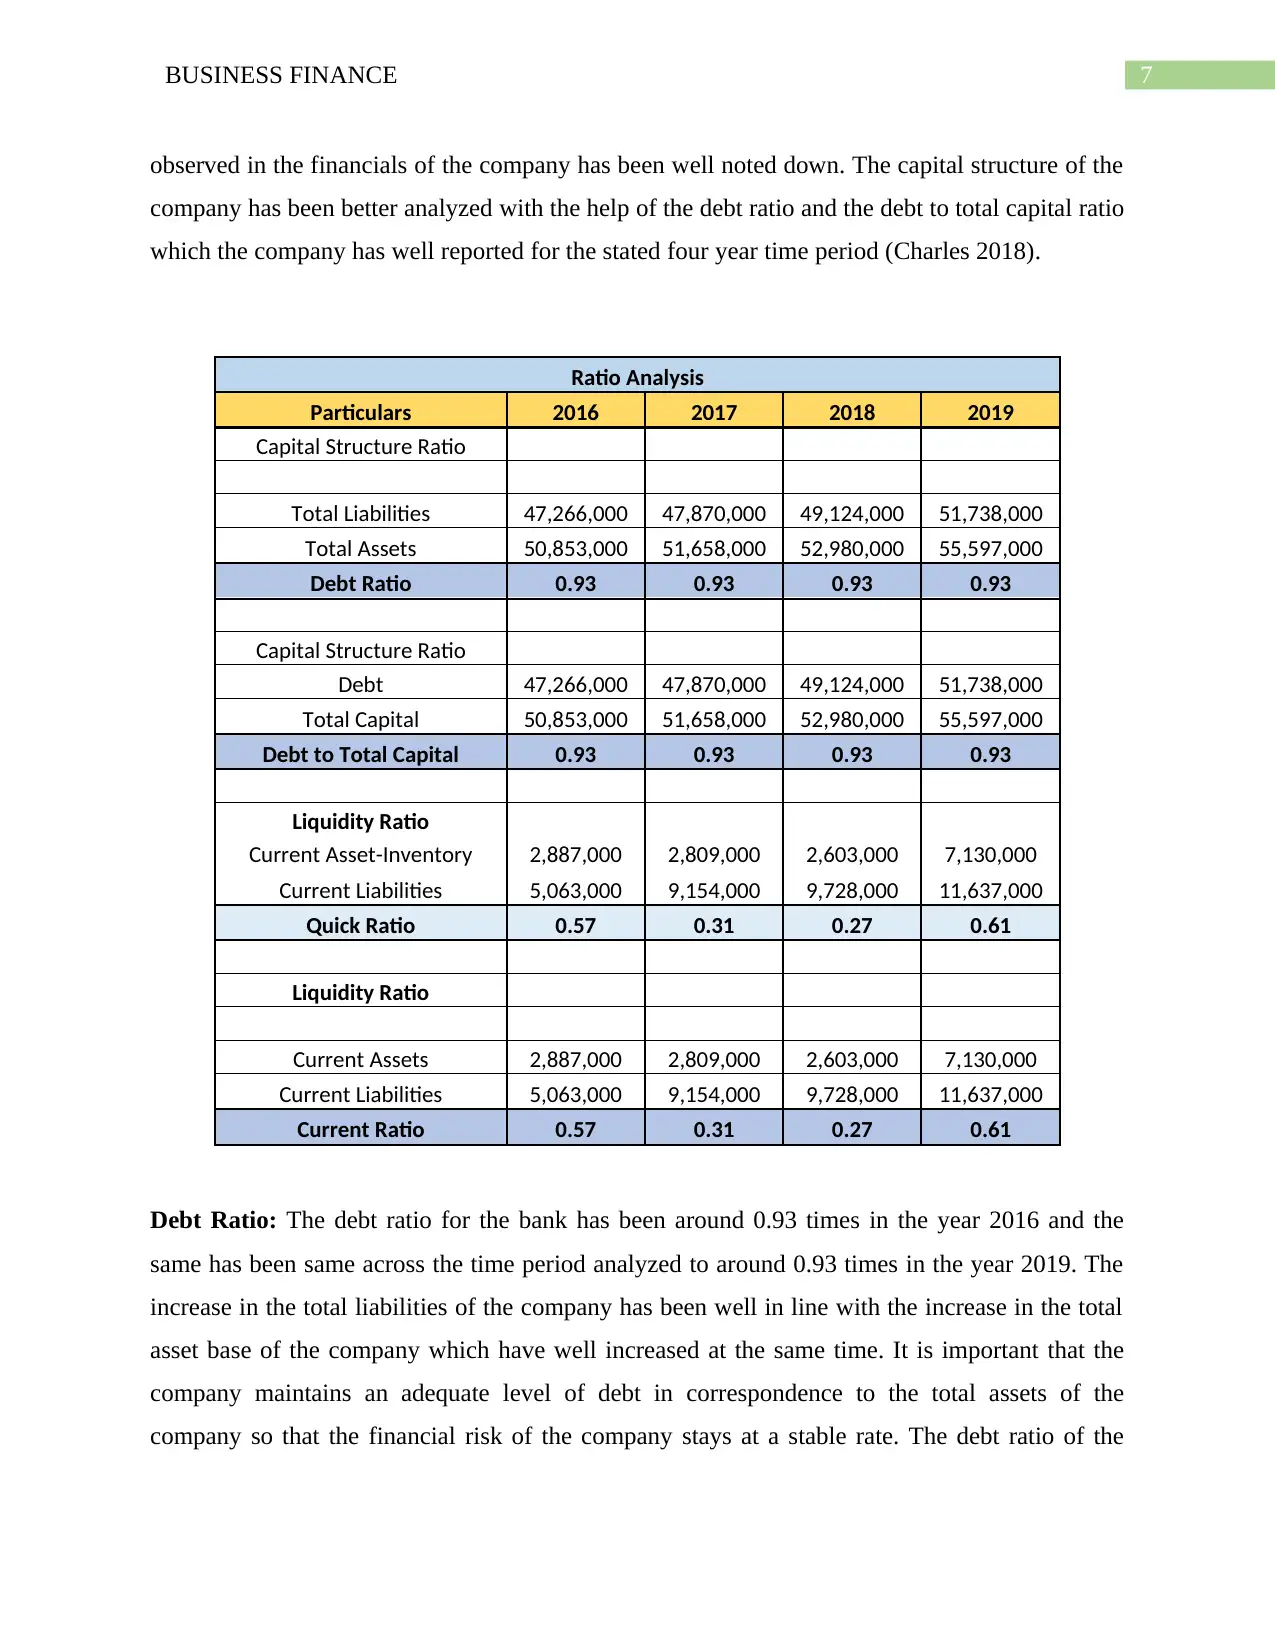
observed in the financials of the company has been well noted down. The capital structure of the
company has been better analyzed with the help of the debt ratio and the debt to total capital ratio
which the company has well reported for the stated four year time period (Charles 2018).
Ratio Analysis
Particulars 2016 2017 2018 2019
Capital Structure Ratio
Total Liabilities 47,266,000 47,870,000 49,124,000 51,738,000
Total Assets 50,853,000 51,658,000 52,980,000 55,597,000
Debt Ratio 0.93 0.93 0.93 0.93
Capital Structure Ratio
Debt 47,266,000 47,870,000 49,124,000 51,738,000
Total Capital 50,853,000 51,658,000 52,980,000 55,597,000
Debt to Total Capital 0.93 0.93 0.93 0.93
Liquidity Ratio
Current Asset-Inventory 2,887,000 2,809,000 2,603,000 7,130,000
Current Liabilities 5,063,000 9,154,000 9,728,000 11,637,000
Quick Ratio 0.57 0.31 0.27 0.61
Liquidity Ratio
Current Assets 2,887,000 2,809,000 2,603,000 7,130,000
Current Liabilities 5,063,000 9,154,000 9,728,000 11,637,000
Current Ratio 0.57 0.31 0.27 0.61
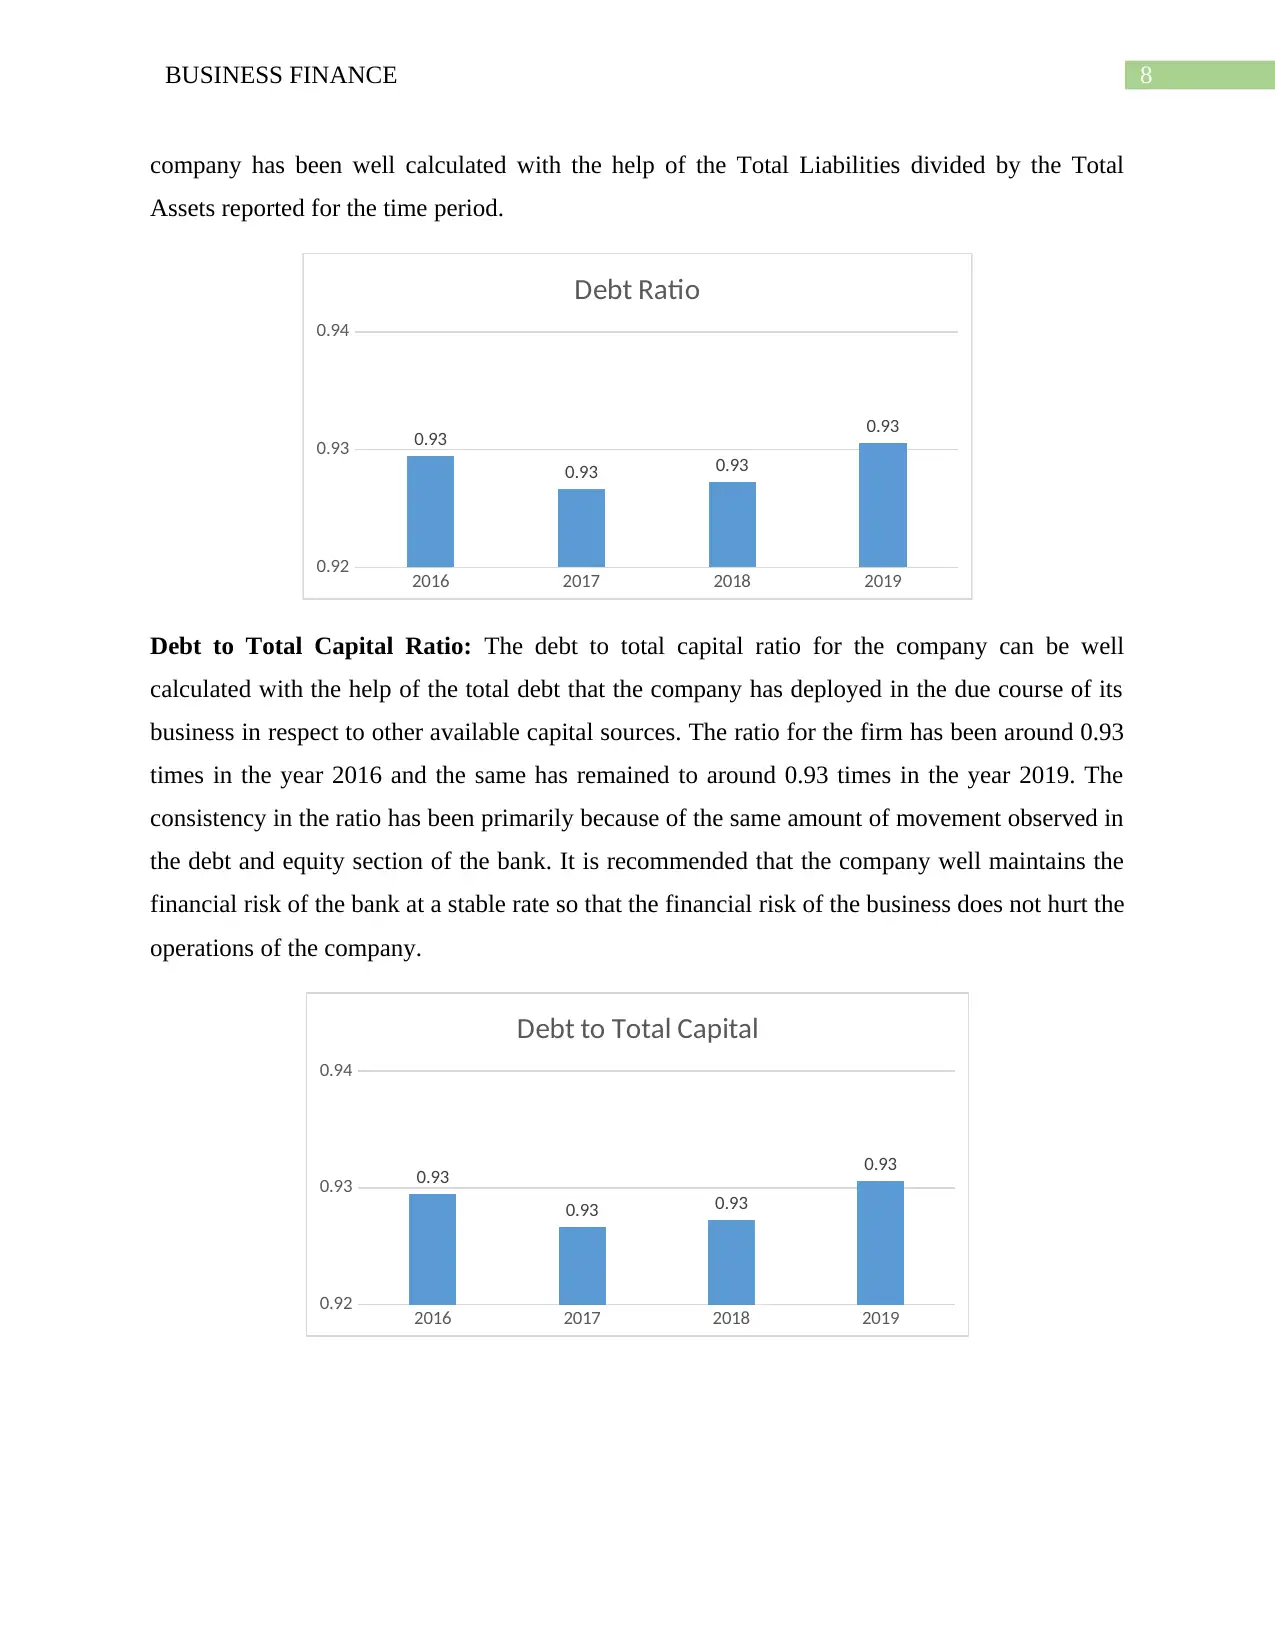
Debt Ratio: The debt ratio for the bank has been around 0.93 times in the year 2016 and the
same has been same across the time period analyzed to around 0.93 times in the year 2019. The
increase in the total liabilities of the company has been well in line with the increase in the total
asset base of the company which have well increased at the same time. It is important that the
company maintains an adequate level of debt in correspondence to the total assets of the
company so that the financial risk of the company stays at a stable rate. The debt ratio of the
observed in the financials of the company has been well noted down. The capital structure of the
company has been better analyzed with the help of the debt ratio and the debt to total capital ratio
which the company has well reported for the stated four year time period (Charles 2018).
Ratio Analysis
Particulars 2016 2017 2018 2019
Capital Structure Ratio
Total Liabilities 47,266,000 47,870,000 49,124,000 51,738,000
Total Assets 50,853,000 51,658,000 52,980,000 55,597,000
Debt Ratio 0.93 0.93 0.93 0.93
Capital Structure Ratio
Debt 47,266,000 47,870,000 49,124,000 51,738,000
Total Capital 50,853,000 51,658,000 52,980,000 55,597,000
Debt to Total Capital 0.93 0.93 0.93 0.93
Liquidity Ratio
Current Asset-Inventory 2,887,000 2,809,000 2,603,000 7,130,000
Current Liabilities 5,063,000 9,154,000 9,728,000 11,637,000
Quick Ratio 0.57 0.31 0.27 0.61
Liquidity Ratio
Current Assets 2,887,000 2,809,000 2,603,000 7,130,000
Current Liabilities 5,063,000 9,154,000 9,728,000 11,637,000
Current Ratio 0.57 0.31 0.27 0.61
Debt Ratio: The debt ratio for the bank has been around 0.93 times in the year 2016 and the
same has been same across the time period analyzed to around 0.93 times in the year 2019. The
increase in the total liabilities of the company has been well in line with the increase in the total
asset base of the company which have well increased at the same time. It is important that the
company maintains an adequate level of debt in correspondence to the total assets of the
company so that the financial risk of the company stays at a stable rate. The debt ratio of the
8BUSINESS FINANCE
company has been well calculated with the help of the Total Liabilities divided by the Total
Assets reported for the time period.
2016 2017 2018 2019
0.92
0.93
0.94
0.93
0.93 0.93
0.93
Debt Ratio
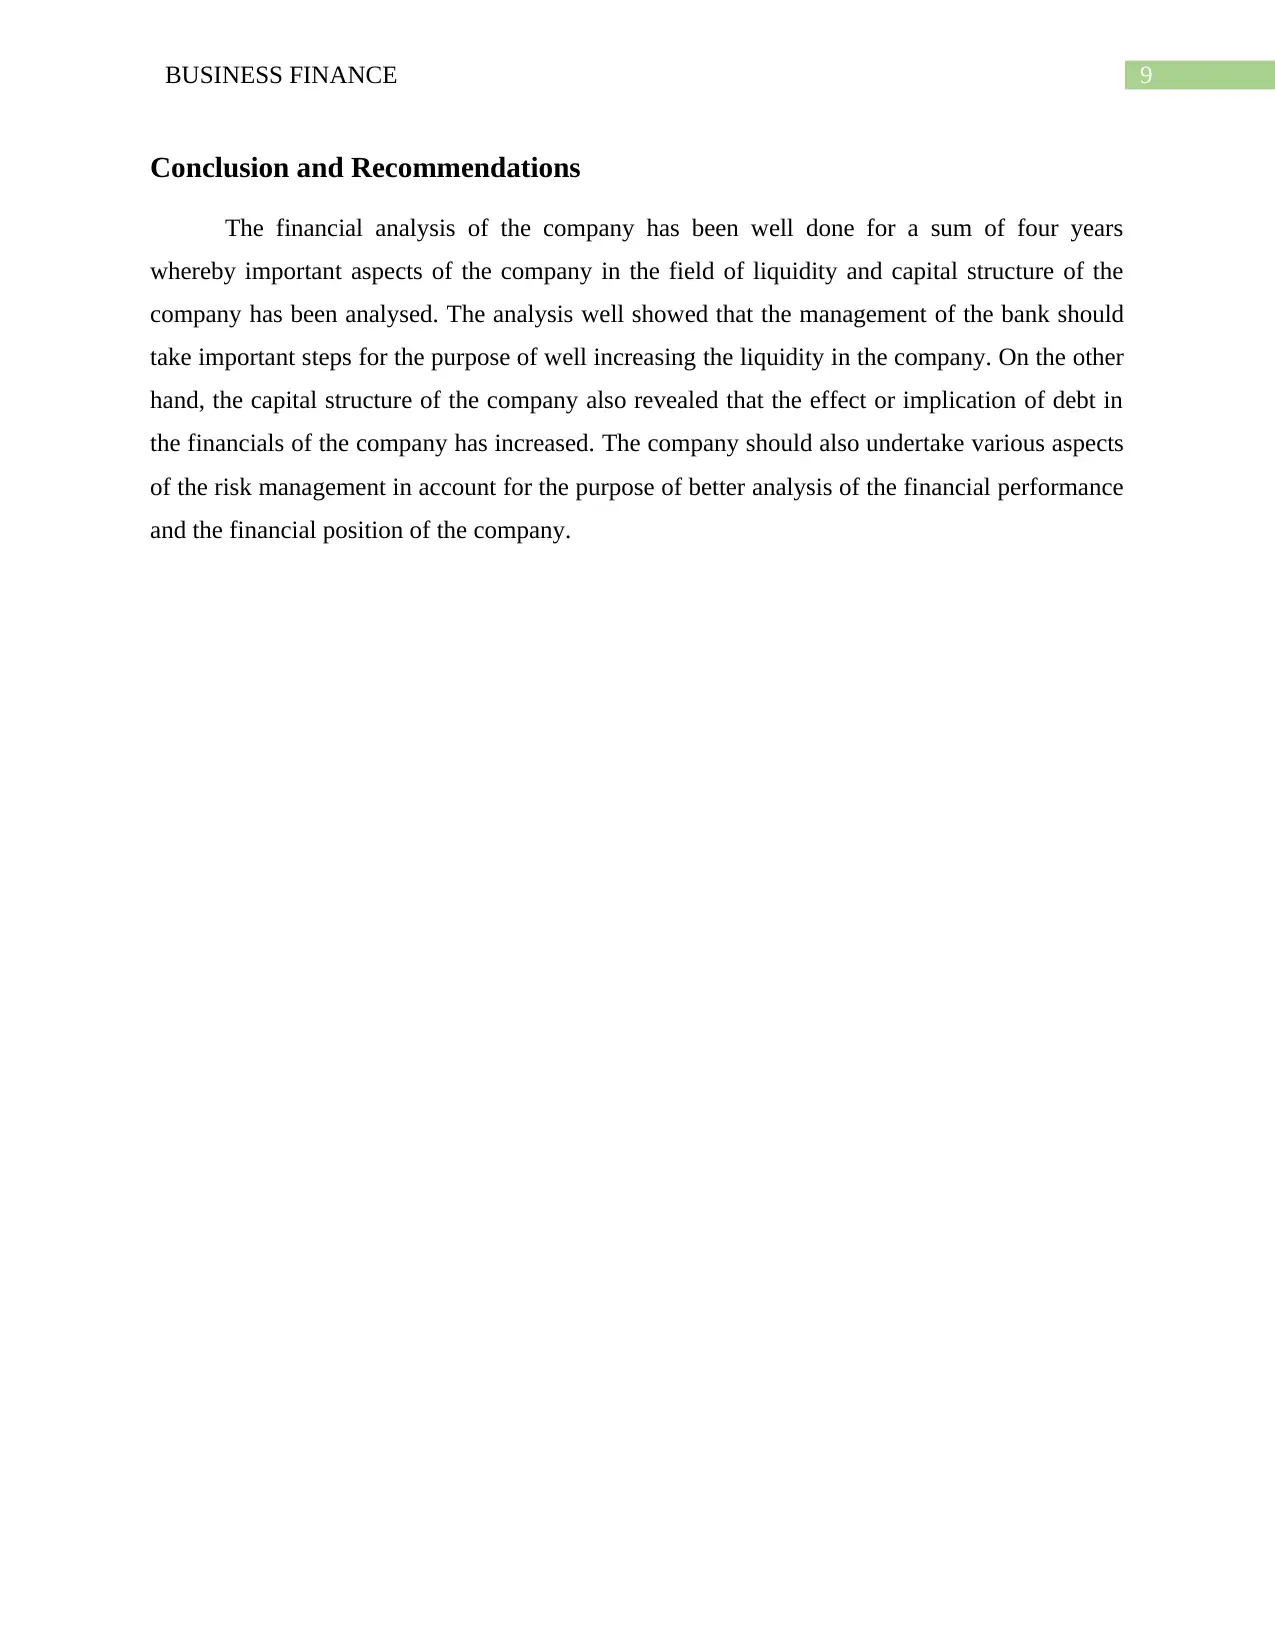
Debt to Total Capital Ratio: The debt to total capital ratio for the company can be well
calculated with the help of the total debt that the company has deployed in the due course of its
business in respect to other available capital sources. The ratio for the firm has been around 0.93
times in the year 2016 and the same has remained to around 0.93 times in the year 2019. The
consistency in the ratio has been primarily because of the same amount of movement observed in
the debt and equity section of the bank. It is recommended that the company well maintains the
financial risk of the bank at a stable rate so that the financial risk of the business does not hurt the
operations of the company.
2016 2017 2018 2019
0.92
0.93
0.94
0.93
0.93 0.93
0.93
Debt to Total Capital
company has been well calculated with the help of the Total Liabilities divided by the Total
Assets reported for the time period.
2016 2017 2018 2019
0.92
0.93
0.94
0.93
0.93 0.93
0.93
Debt Ratio
Debt to Total Capital Ratio: The debt to total capital ratio for the company can be well
calculated with the help of the total debt that the company has deployed in the due course of its
business in respect to other available capital sources. The ratio for the firm has been around 0.93
times in the year 2016 and the same has remained to around 0.93 times in the year 2019. The
consistency in the ratio has been primarily because of the same amount of movement observed in
the debt and equity section of the bank. It is recommended that the company well maintains the
financial risk of the bank at a stable rate so that the financial risk of the business does not hurt the
operations of the company.
2016 2017 2018 2019
0.92
0.93
0.94
0.93
0.93 0.93
0.93
Debt to Total Capital
⊘ This is a preview!⊘
Do you want full access?
Subscribe today to unlock all pages.
Trusted by 1+ million students worldwide
9BUSINESS FINANCE
Conclusion and Recommendations
The financial analysis of the company has been well done for a sum of four years
whereby important aspects of the company in the field of liquidity and capital structure of the
company has been analysed. The analysis well showed that the management of the bank should
take important steps for the purpose of well increasing the liquidity in the company. On the other
hand, the capital structure of the company also revealed that the effect or implication of debt in
the financials of the company has increased. The company should also undertake various aspects
of the risk management in account for the purpose of better analysis of the financial performance
and the financial position of the company.
Paraphrase This Document
Need a fresh take? Get an instant paraphrase of this document with our AI Paraphraser
10BUSINESS FINANCE
References
Au.finance.yahoo.com. 2019. Yahoo Finance. [online] Available at:
https://au.finance.yahoo.com/quote/BOQ.AX/balance-sheet?p=BOQ.AX [Accessed 28 Jan.
2020].
Bao, G. and Feng, G., 2018. Testing the Dividend Discount Model in Housing Markets: the Role
of Risk. The Journal of Real Estate Finance and Economics, 57(4), pp.677-701.
Boq.com.au. 2020. Company Overview | Bank of Queensland. [online] Available at:
https://www.boq.com.au/About-us/company-overview [Accessed 28 Jan. 2020].
Bouwman, C.H., 2019. Capital, Liquidity and Prudential Regulation (Presentation
Slides). Available at SSRN 3518858.
Carletti, E., Goldstein, I. and Leonello, A., 2020. The interdependence of bank capital and
liquidity. BAFFI CAREFIN Centre Research Paper, (2020-128).
Charles, C., 2018. Nonprofit arts organizations: Debt ratio does not influence donations—
Interest expense ratio does. The American Review of Public Administration, 48(7), pp.659-667.
D'Mello, R., Gruskin, M. and Kulchania, M., 2018. Shareholders valuation of long-term debt and
decline in firms' leverage ratio. Journal of Corporate Finance, 48, pp.352-374.
Falk, M. and Steiger, R., 2018. An exploration of the debt ratio of ski lift
operators. Sustainability, 10(9), p.2985.
Hatemi-J, A. and El-Khatib, Y., 2018. The Dividend Discount Model with Multiple Growth
Rates of Any Order for Stock Evaluation. arXiv preprint arXiv:1802.08987.
Mursalini, W.I., Husni, T. and Hamidi, M., 2017. Analysis of Funding, Working Capital
Turnover, Liquidity and Sales Growth to Profitability. Advanced Science Letters, 23(9), pp.8341-
8346.
Onuma, H. and Kato, K., 2018. Corporate Tax Avoidance, Debt Ratio, and Corporate
Governance: Evidence from Japan. Debt Ratio, and Corporate Governance: Evidence from
Japan (April 11, 2018).
11BUSINESS FINANCE
Rehman, A., Raza, Z., Rehman, H.U., Rehman, S.U. and Farooq, M., 2019. CAPITAL
STRUCTURE, LIQUIDITY AND FINANCIAL PERFORMANCE OF THE FIRMS IN
CEMENT AND SUGAR INDUSTRIES OF PAKISTAN. Journal Of Social Sciences &
Humanities, 3(1 & 2), pp.41-54.
Sim, T. and Wright, R., 2017. Stock valuation using the dividend discount model: An internal
rate of return Approach. Research in Finance, 33, pp.19-32.
⊘ This is a preview!⊘
Do you want full access?
Subscribe today to unlock all pages.
Trusted by 1+ million students worldwide
1 out of 12
Related Documents


Your All-in-One AI-Powered Toolkit for Academic Success.
+13062052269
info@desklib.com
Available 24*7 on WhatsApp / Email
![[object Object]](/_next/static/media/star-bottom.7253800d.svg)
Unlock your academic potential
Copyright © 2020–2026 A2Z Services. All Rights Reserved. Developed and managed by ZUCOL.