National Australia Bank and Zurich Insurance Group Report
VerifiedAdded on 2022/09/27
|21
|5216
|21
Report
AI Summary
This report provides a comprehensive analysis of the balance sheets of National Australia Bank (NAB) and Zurich Insurance Group, comparing their asset and liability structures to highlight the differences arising from their contrasting business models. The report delves into NAB's lending activities, emphasizing the significance of loans and advances, trading instruments, and deposits, while also detailing the major liabilities. In contrast, it examines Zurich Insurance Group's investment strategies, focusing on debt securities, investments, and insurance liabilities. Furthermore, the report investigates the capital adequacy of NAB, justifying the use of the Capital Adequacy Ratio (CAR) and Tier 1 Leverage Ratio as key metrics. It then compares and contrasts NAB's capital adequacy over a five-year period, discussing the limitations of each ratio and providing a detailed overview of the financial performance and risk management strategies of the bank. The report utilizes financial data from the companies' annual reports and presents the findings to provide insights into the banking and financial markets.
Running head: BANKING AND FINANCIAL MARKETS
Banking and Financial Markets
Name of the Student
Name of the University
Author Note
Banking and Financial Markets
Name of the Student
Name of the University
Author Note
Paraphrase This Document
Need a fresh take? Get an instant paraphrase of this document with our AI Paraphraser
1BANKING AND FINANCIAL MARKETS
Table of Contents
Assignment One...............................................................................................................................2
Part a............................................................................................................................................2
Part b............................................................................................................................................5
Part c............................................................................................................................................8
Assignment Two........................................................................................................................10
Part b..........................................................................................................................................12
2BANKING AND FINANCIAL MARKETS
Assignment One
Part a
Comparison of balance sheet structures
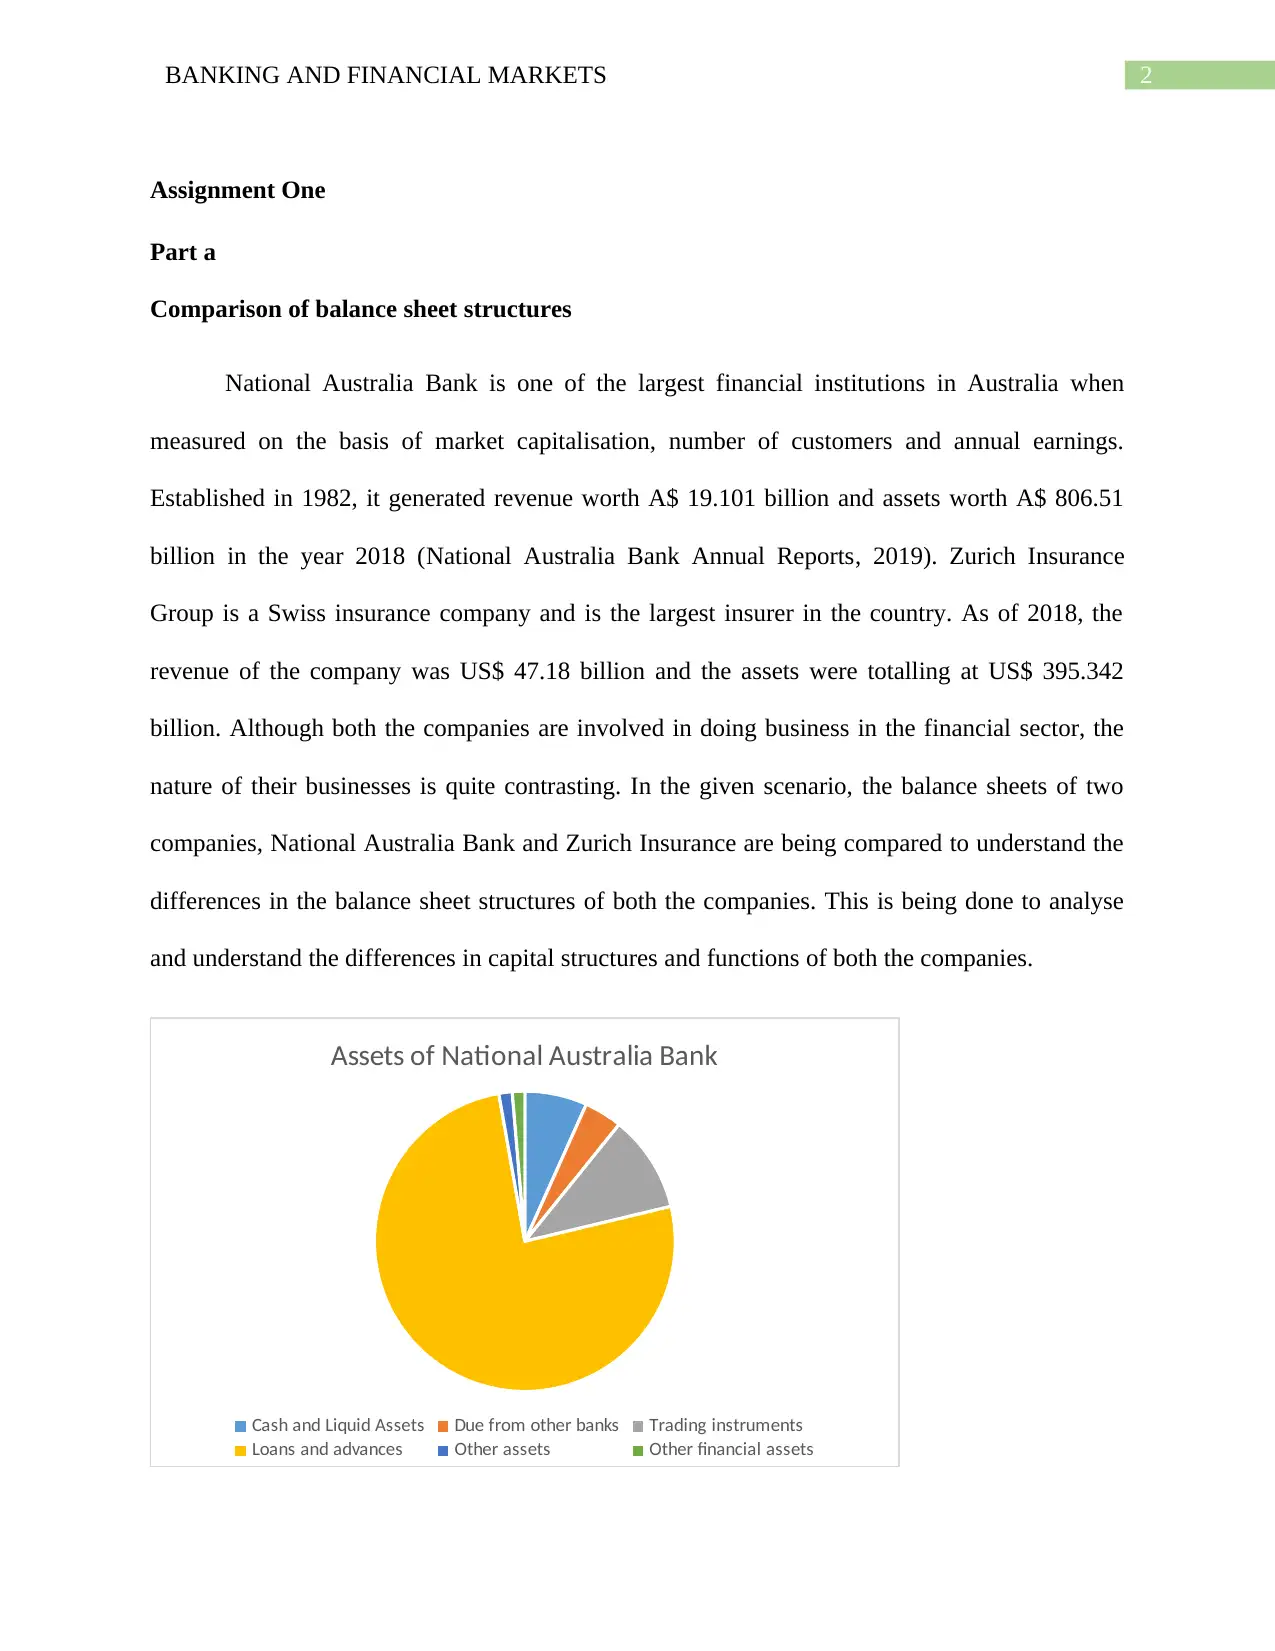
National Australia Bank is one of the largest financial institutions in Australia when
measured on the basis of market capitalisation, number of customers and annual earnings.
Established in 1982, it generated revenue worth A$ 19.101 billion and assets worth A$ 806.51
billion in the year 2018 (National Australia Bank Annual Reports, 2019). Zurich Insurance
Group is a Swiss insurance company and is the largest insurer in the country. As of 2018, the
revenue of the company was US$ 47.18 billion and the assets were totalling at US$ 395.342
billion. Although both the companies are involved in doing business in the financial sector, the
nature of their businesses is quite contrasting. In the given scenario, the balance sheets of two
companies, National Australia Bank and Zurich Insurance are being compared to understand the
differences in the balance sheet structures of both the companies. This is being done to analyse
and understand the differences in capital structures and functions of both the companies.
Assets of National Australia Bank
Cash and Liquid Assets Due from other banks Trading instruments
Loans and advances Other assets Other financial assets
Assignment One
Part a
Comparison of balance sheet structures
National Australia Bank is one of the largest financial institutions in Australia when
measured on the basis of market capitalisation, number of customers and annual earnings.
Established in 1982, it generated revenue worth A$ 19.101 billion and assets worth A$ 806.51
billion in the year 2018 (National Australia Bank Annual Reports, 2019). Zurich Insurance
Group is a Swiss insurance company and is the largest insurer in the country. As of 2018, the
revenue of the company was US$ 47.18 billion and the assets were totalling at US$ 395.342
billion. Although both the companies are involved in doing business in the financial sector, the
nature of their businesses is quite contrasting. In the given scenario, the balance sheets of two
companies, National Australia Bank and Zurich Insurance are being compared to understand the
differences in the balance sheet structures of both the companies. This is being done to analyse
and understand the differences in capital structures and functions of both the companies.
Assets of National Australia Bank
Cash and Liquid Assets Due from other banks Trading instruments
Loans and advances Other assets Other financial assets
⊘ This is a preview!⊘
Do you want full access?
Subscribe today to unlock all pages.
Trusted by 1+ million students worldwide
3BANKING AND FINANCIAL MARKETS
The major assets held by National Australia Bank are as follows:
Cash and Liquid
Assets
50188
Due from other
banks
30568
Trading instruments 78228
Loans and advances 567981
Other assets 10723
Other financial
assets
10041
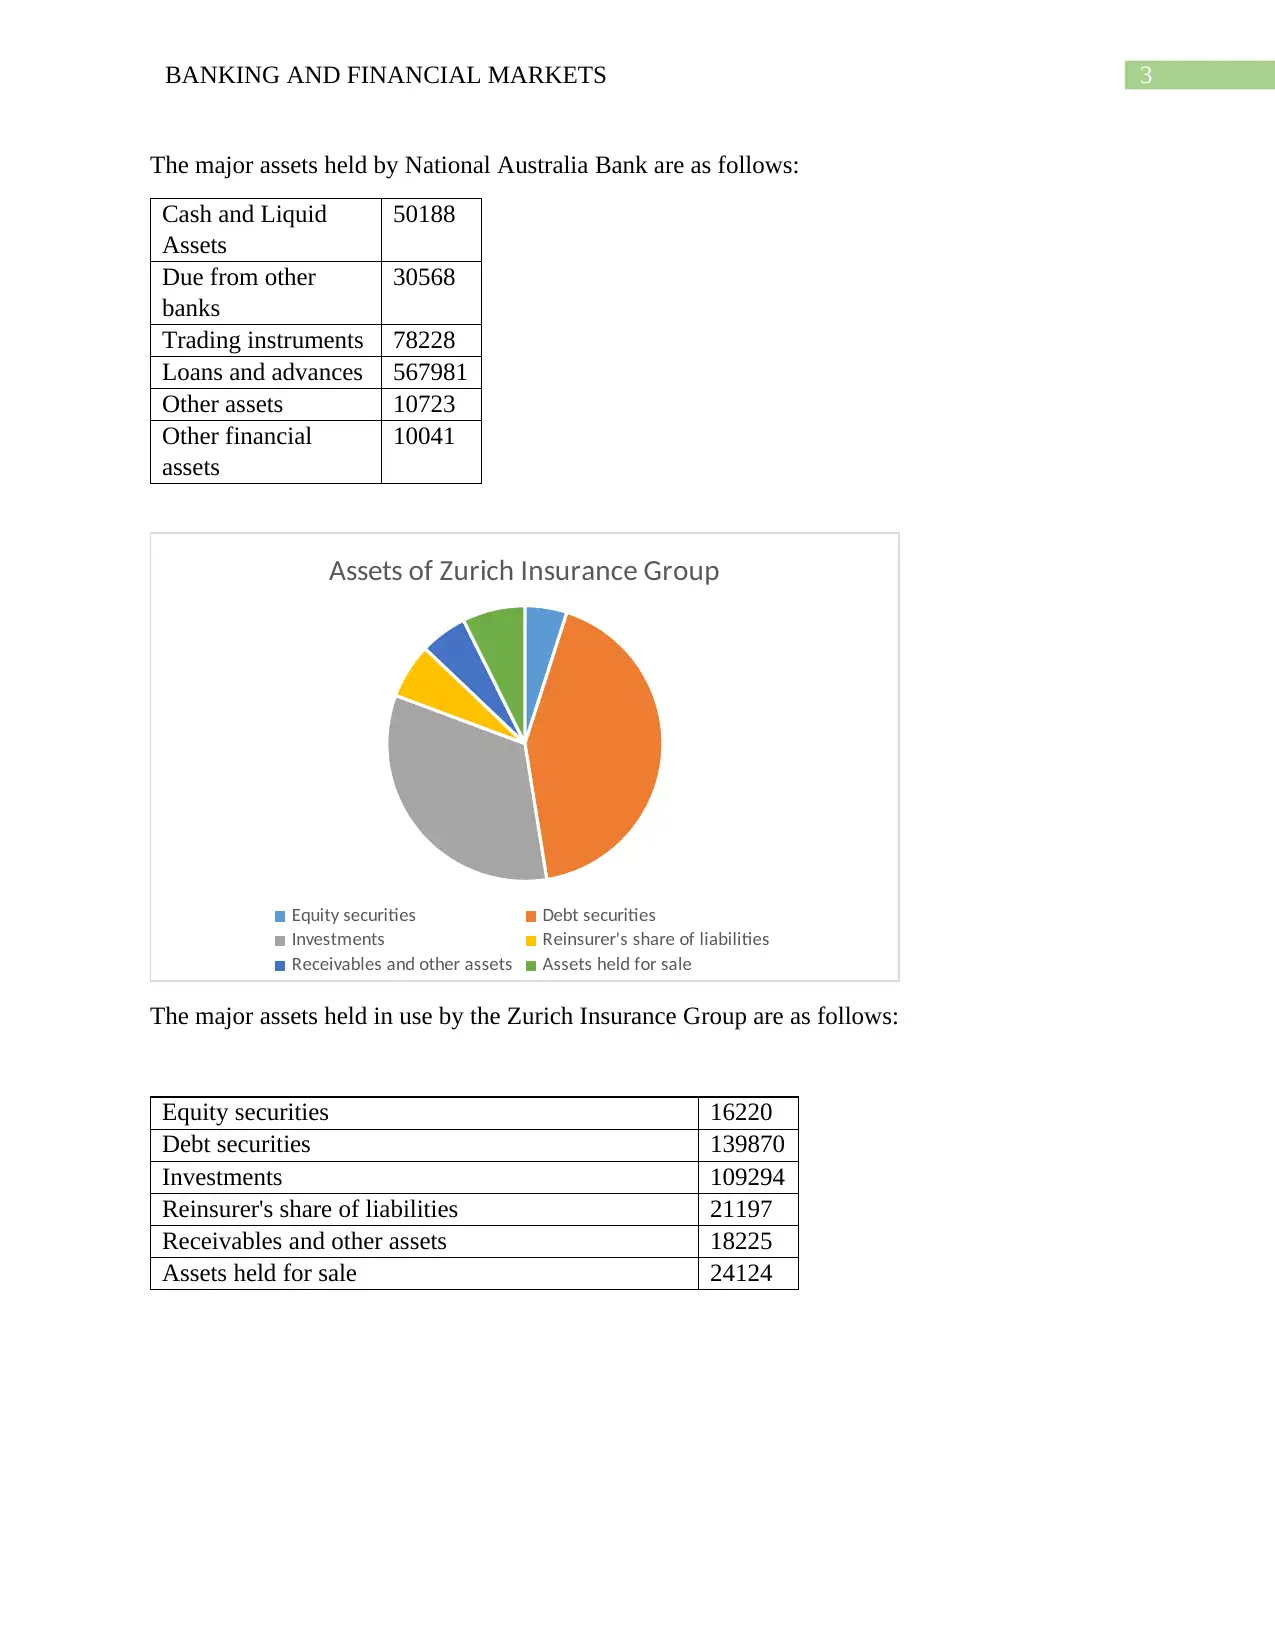
Assets of Zurich Insurance Group
Equity securities Debt securities
Investments Reinsurer's share of liabilities
Receivables and other assets Assets held for sale
The major assets held in use by the Zurich Insurance Group are as follows:
Equity securities 16220
Debt securities 139870
Investments 109294
Reinsurer's share of liabilities 21197
Receivables and other assets 18225
Assets held for sale 24124
The major assets held by National Australia Bank are as follows:
Cash and Liquid
Assets
50188
Due from other
banks
30568
Trading instruments 78228
Loans and advances 567981
Other assets 10723
Other financial
assets
10041
Assets of Zurich Insurance Group
Equity securities Debt securities
Investments Reinsurer's share of liabilities
Receivables and other assets Assets held for sale
The major assets held in use by the Zurich Insurance Group are as follows:
Equity securities 16220
Debt securities 139870
Investments 109294
Reinsurer's share of liabilities 21197
Receivables and other assets 18225
Assets held for sale 24124
Paraphrase This Document
Need a fresh take? Get an instant paraphrase of this document with our AI Paraphraser
4BANKING AND FINANCIAL MARKETS
Liabilities of National Australia Bank
Deposits and other borrowings Bonds, notes and subordinated debt
Due to other banks Other financial liabilities
Trading Instruments Other liabilities
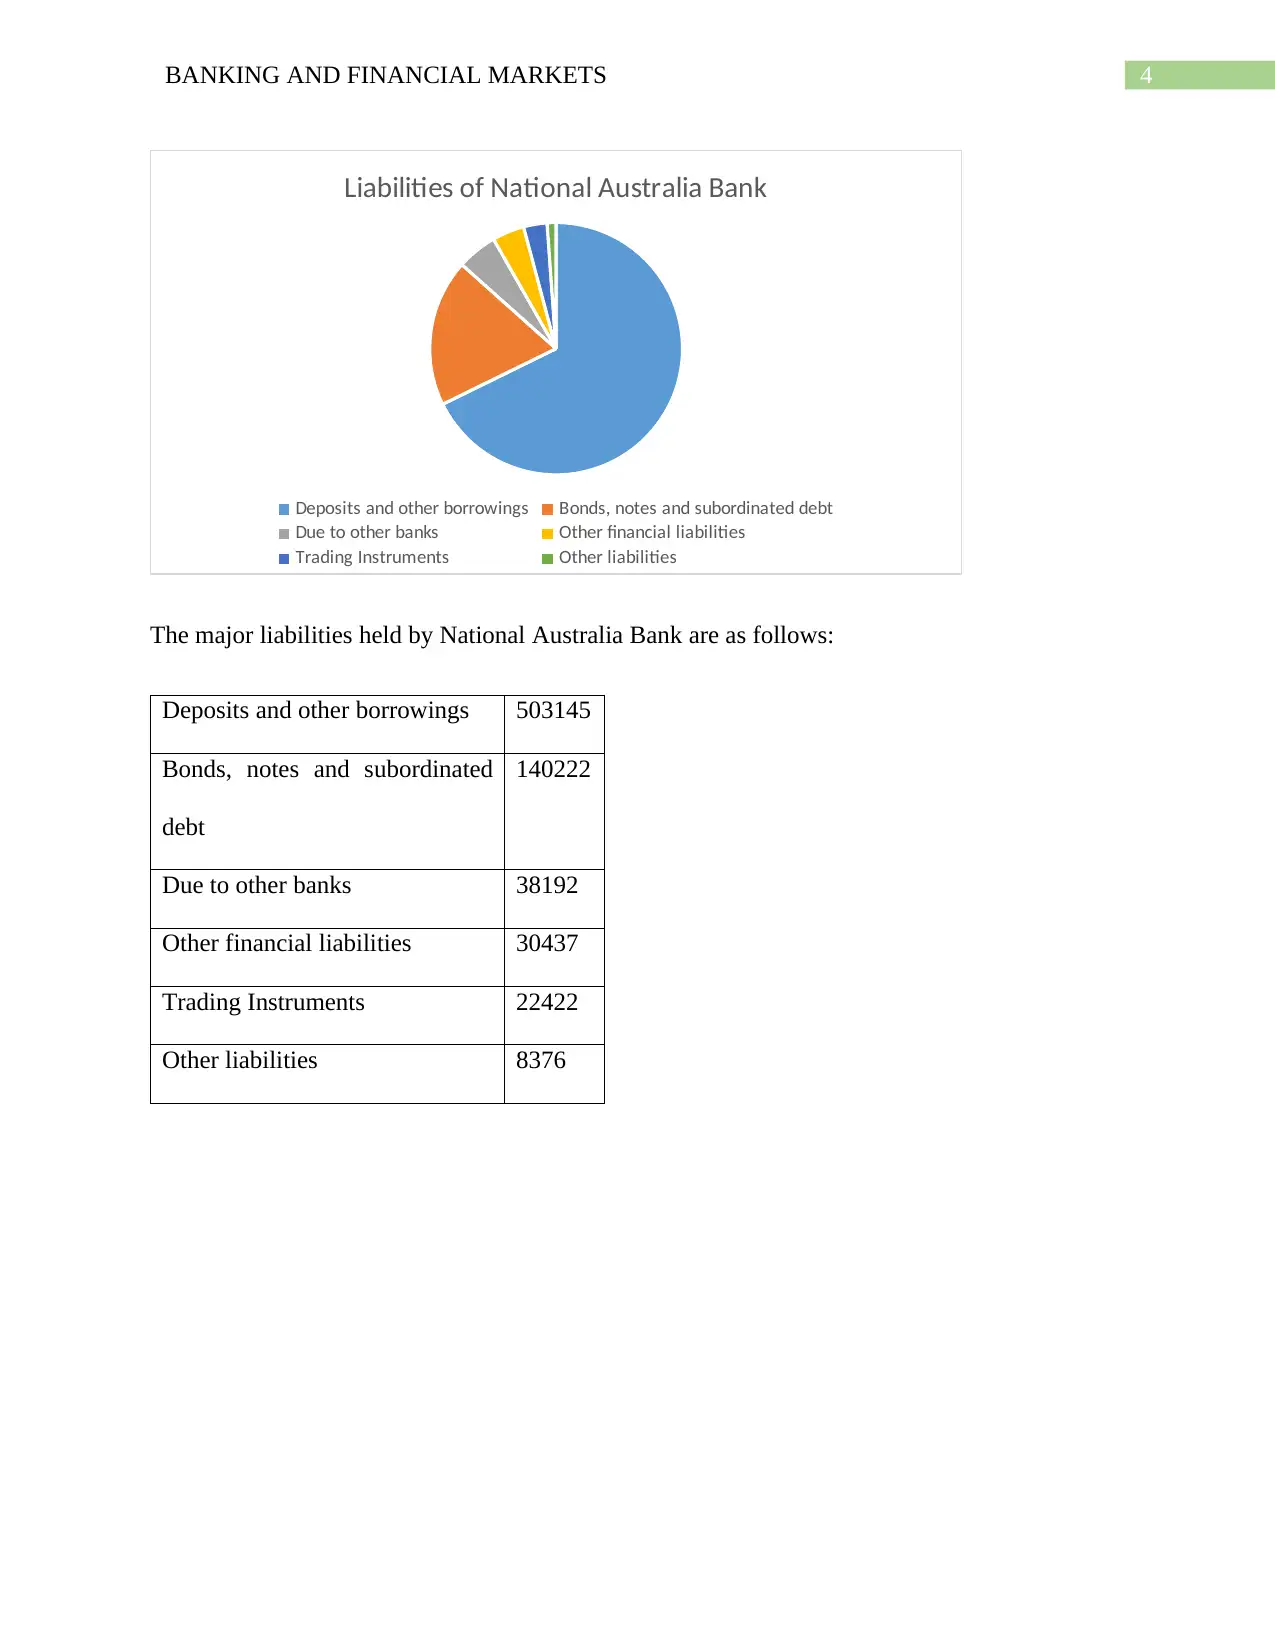
The major liabilities held by National Australia Bank are as follows:
Deposits and other borrowings 503145
Bonds, notes and subordinated
debt
140222
Due to other banks 38192
Other financial liabilities 30437
Trading Instruments 22422
Other liabilities 8376
Liabilities of National Australia Bank
Deposits and other borrowings Bonds, notes and subordinated debt
Due to other banks Other financial liabilities
Trading Instruments Other liabilities
The major liabilities held by National Australia Bank are as follows:
Deposits and other borrowings 503145
Bonds, notes and subordinated
debt
140222
Due to other banks 38192
Other financial liabilities 30437
Trading Instruments 22422
Other liabilities 8376
5BANKING AND FINANCIAL MARKETS
Liabilities of Zurich Insurance Group
Liabilities for insurance contracts Liabilities for investment contracts
Liabilities held for sale Other liabilities
subordinated debt senior debt
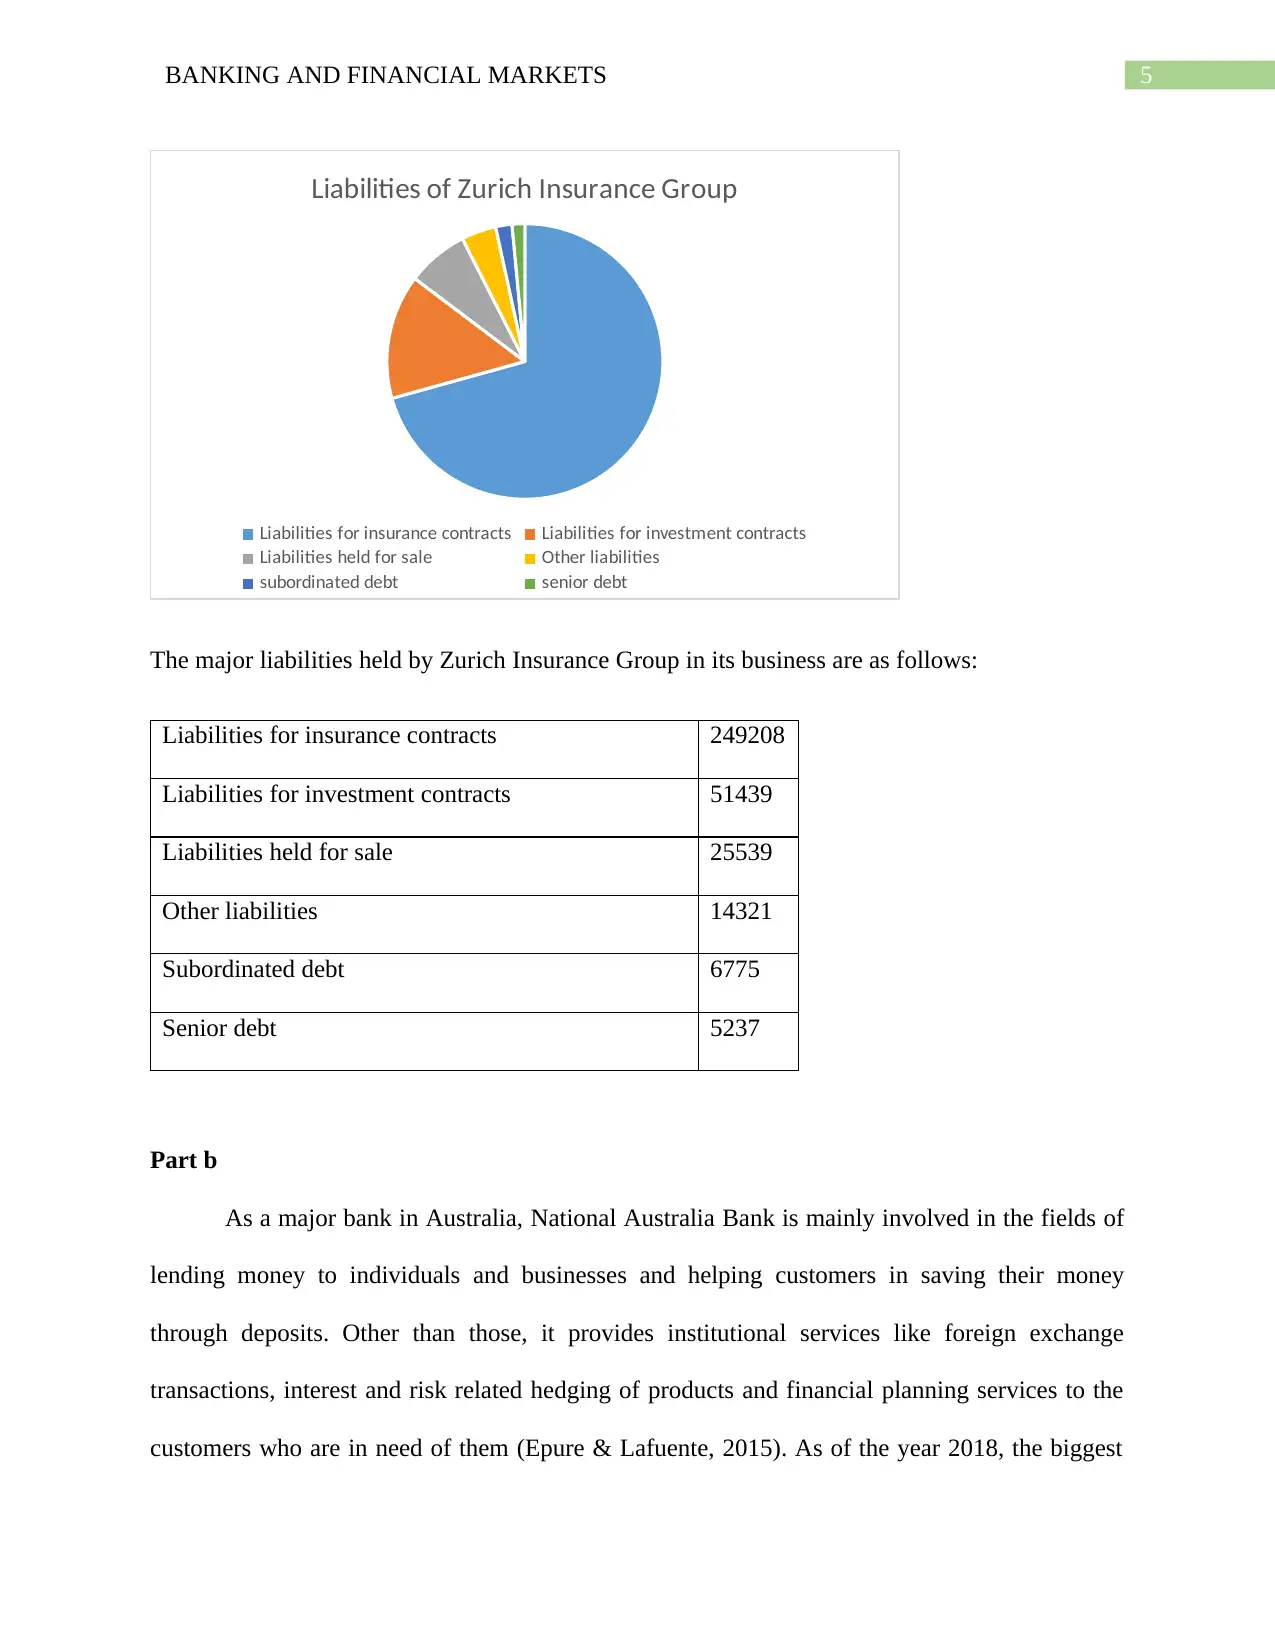
The major liabilities held by Zurich Insurance Group in its business are as follows:
Liabilities for insurance contracts 249208
Liabilities for investment contracts 51439
Liabilities held for sale 25539
Other liabilities 14321
Subordinated debt 6775
Senior debt 5237
Part b
As a major bank in Australia, National Australia Bank is mainly involved in the fields of
lending money to individuals and businesses and helping customers in saving their money
through deposits. Other than those, it provides institutional services like foreign exchange
transactions, interest and risk related hedging of products and financial planning services to the
customers who are in need of them (Epure & Lafuente, 2015). As of the year 2018, the biggest
Liabilities of Zurich Insurance Group
Liabilities for insurance contracts Liabilities for investment contracts
Liabilities held for sale Other liabilities
subordinated debt senior debt
The major liabilities held by Zurich Insurance Group in its business are as follows:
Liabilities for insurance contracts 249208
Liabilities for investment contracts 51439
Liabilities held for sale 25539
Other liabilities 14321
Subordinated debt 6775
Senior debt 5237
Part b
As a major bank in Australia, National Australia Bank is mainly involved in the fields of
lending money to individuals and businesses and helping customers in saving their money
through deposits. Other than those, it provides institutional services like foreign exchange
transactions, interest and risk related hedging of products and financial planning services to the
customers who are in need of them (Epure & Lafuente, 2015). As of the year 2018, the biggest
⊘ This is a preview!⊘
Do you want full access?
Subscribe today to unlock all pages.
Trusted by 1+ million students worldwide
6BANKING AND FINANCIAL MARKETS
asset held by the company was in the form of loans and advances provided by it its customers.
This totalled at A$ 567981. This forms around 71 percent of the assets held by the company. The
reason for such a high percentage is the nature of the business of the company. As a banking
company, National Australia Bank provides loans to both individuals and financial institutions
and hence the majority of the business depends on the recovery of these loans (NADB, 2013).
The next major asset held by the company is the trading instruments which are totalled at
$78228. These trading instruments consist of items that do not qualify under a hedging
relationship and instruments that have been classified as held for trading because they are being
held by the business to sell them in the short-term future and the intention of the company is to
earn short term profits on them. The cash and liquid assets of the company are maintained at A$
50188. This includes the short term borrowings receivable from other banks within three months
and are not prone to the risk of change in value in the short run (Martin, Skeie & Von Thadden,
2014). These assets do not form a major part of the total assets of the company because the
business usually does not provide loans of short term nature in huge amounts. It is also difficult
for the bank to accurately determine the period in which a loan will be recovered. Hence, the
short term assets cannot always be measured accurately. The amount of assets of National
Australia Bank then consist of amounts due from other banks and other assets including the
financial assets. As required by organisations involved in the banking business, inter-bank
transactions are very common and amounts are owed by banks to each other (Bargigli et al.,
2015). They form a significant part of the balance sheet in case of most of the companies. The
major liabilities shown in National Bank of Australia’s balance sheet are related to the deposits
and other borrowings. These are valued at fair value reduced by transaction costs and
consequently measured using the amortised cost. Of the several roles of a bank, acceptance of
Paraphrase This Document
Need a fresh take? Get an instant paraphrase of this document with our AI Paraphraser
7BANKING AND FINANCIAL MARKETS
term deposits and on-demand deposits is a significant one. This is because apart from providing
loans and advances, the other vital function performed by a bank is to help people in saving their
money through accepting deposits (Allen, Carletti & Marquez, 2015). These can be withdrawn
by the customers according to the terms of their deposit. Hence, the bank is liable to repay them
and they are noted as liabilities in the balance sheet. These form around 66 percent of the
liabilities of the company. The Bank is also responsible for the issuance of bonds and
subordinated debt on the behalf of other companies. These are repayable at the end of their life
period. These are another major source of earning income for a banking company. Hence, these
bonds and subordinated debts form around 18 percent of the liabilities of the company. The main
function of any insurance company is to protect its customers against any risks that they may
face in the future due to unexpected circumstances (AlNemer, 2013). In case of Zurich Insurance
Group, the major functions performed by the company are underwriting, providing claims to
eligible clients, actuarial services and providing finance related plans to the business of the
clients who need them. The major securities held by the Zurich Insurance Group are the debt
securities, which are totalled at US $249208. These securities provide the insurance with a
significant amount of interest and the risk on them is also lower. Hence, on the date of maturity,
the insurance company receives the payment on them. As the major function of an insurance
company is to insure its customers against risks, the company protects its customers against any
default in the payment of the debt securities issued by them. In the given case, these securities
form around 35 percent of the assets of the company. The other major asset held by the company
is the investment for unit-linked contracts, whose value stands at US $51439. In this type of
contracts, the amount invested by the insured party is invested in an asset like stocks, mutual
funds or bonds (Melnikov & Tong, 2014). A minimum amount is guaranteed to return to the
8BANKING AND FINANCIAL MARKETS
investment company on the maturity of the asset. Hence, this is another important tool for the
survival of an insurance company. The major liabilities of the company are the liabilities held for
sale by the company and the liabilities for insurance contracts. As a company is liable to pay the
amount on an insurance contract on its maturity, the company has allocated various reserves for
loss adjusted expenses, unearned premiums and for the benefits of future life policy holders.
These liabilities exist for any unforeseen circumstances that a company may have to face in the
future. The other major liability held by the company is the liabilities held for sale by the
company (Duchin et al., 2017). These liabilities are valued at US $25539. The amount consists
of an agreement entered by the company with Catalina Holdings (Bermuda) Ltd. for selling its
shares. This agreement is yet to be closed by the company.
Part c
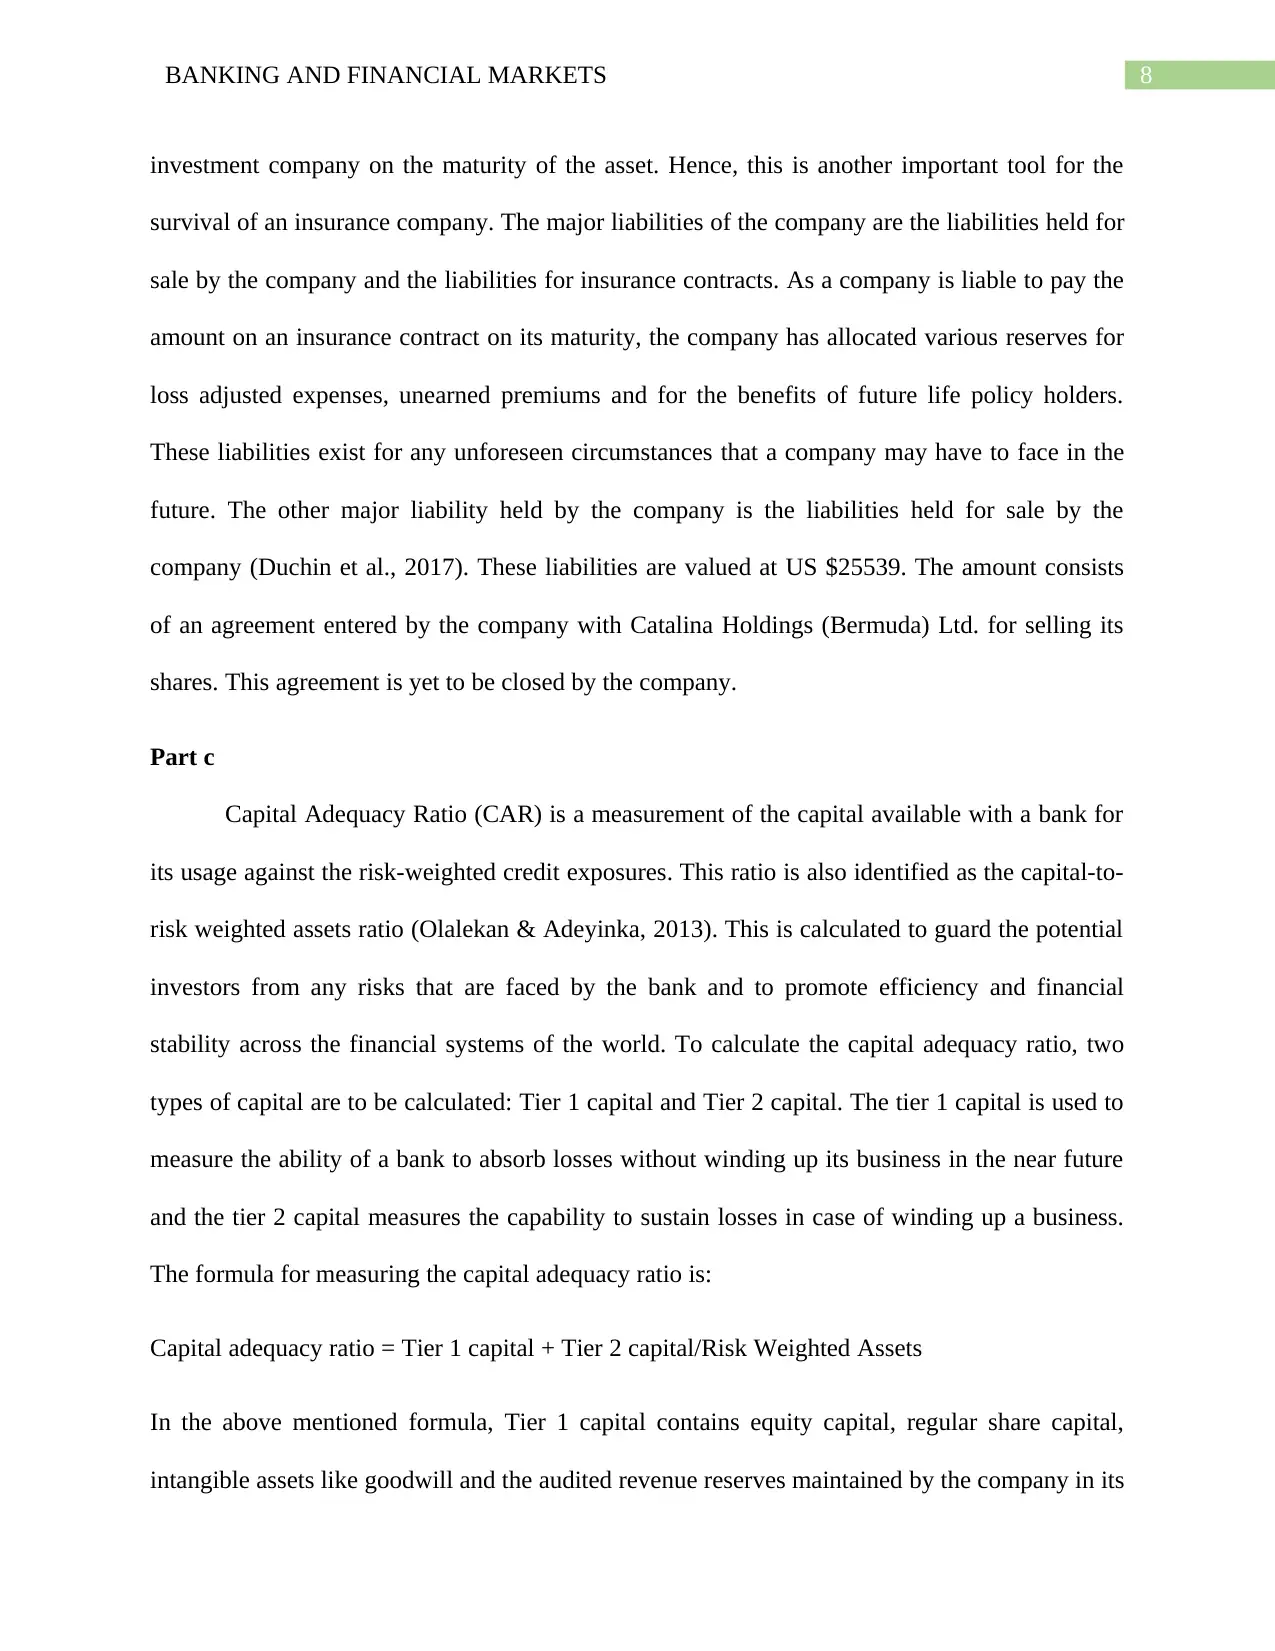
Capital Adequacy Ratio (CAR) is a measurement of the capital available with a bank for
its usage against the risk-weighted credit exposures. This ratio is also identified as the capital-to-
risk weighted assets ratio (Olalekan & Adeyinka, 2013). This is calculated to guard the potential
investors from any risks that are faced by the bank and to promote efficiency and financial
stability across the financial systems of the world. To calculate the capital adequacy ratio, two
types of capital are to be calculated: Tier 1 capital and Tier 2 capital. The tier 1 capital is used to
measure the ability of a bank to absorb losses without winding up its business in the near future
and the tier 2 capital measures the capability to sustain losses in case of winding up a business.
The formula for measuring the capital adequacy ratio is:
Capital adequacy ratio = Tier 1 capital + Tier 2 capital/Risk Weighted Assets
In the above mentioned formula, Tier 1 capital contains equity capital, regular share capital,
intangible assets like goodwill and the audited revenue reserves maintained by the company in its
investment company on the maturity of the asset. Hence, this is another important tool for the
survival of an insurance company. The major liabilities of the company are the liabilities held for
sale by the company and the liabilities for insurance contracts. As a company is liable to pay the
amount on an insurance contract on its maturity, the company has allocated various reserves for
loss adjusted expenses, unearned premiums and for the benefits of future life policy holders.
These liabilities exist for any unforeseen circumstances that a company may have to face in the
future. The other major liability held by the company is the liabilities held for sale by the
company (Duchin et al., 2017). These liabilities are valued at US $25539. The amount consists
of an agreement entered by the company with Catalina Holdings (Bermuda) Ltd. for selling its
shares. This agreement is yet to be closed by the company.
Part c
Capital Adequacy Ratio (CAR) is a measurement of the capital available with a bank for
its usage against the risk-weighted credit exposures. This ratio is also identified as the capital-to-
risk weighted assets ratio (Olalekan & Adeyinka, 2013). This is calculated to guard the potential
investors from any risks that are faced by the bank and to promote efficiency and financial
stability across the financial systems of the world. To calculate the capital adequacy ratio, two
types of capital are to be calculated: Tier 1 capital and Tier 2 capital. The tier 1 capital is used to
measure the ability of a bank to absorb losses without winding up its business in the near future
and the tier 2 capital measures the capability to sustain losses in case of winding up a business.
The formula for measuring the capital adequacy ratio is:
Capital adequacy ratio = Tier 1 capital + Tier 2 capital/Risk Weighted Assets
In the above mentioned formula, Tier 1 capital contains equity capital, regular share capital,
intangible assets like goodwill and the audited revenue reserves maintained by the company in its
⊘ This is a preview!⊘
Do you want full access?
Subscribe today to unlock all pages.
Trusted by 1+ million students worldwide
9BANKING AND FINANCIAL MARKETS
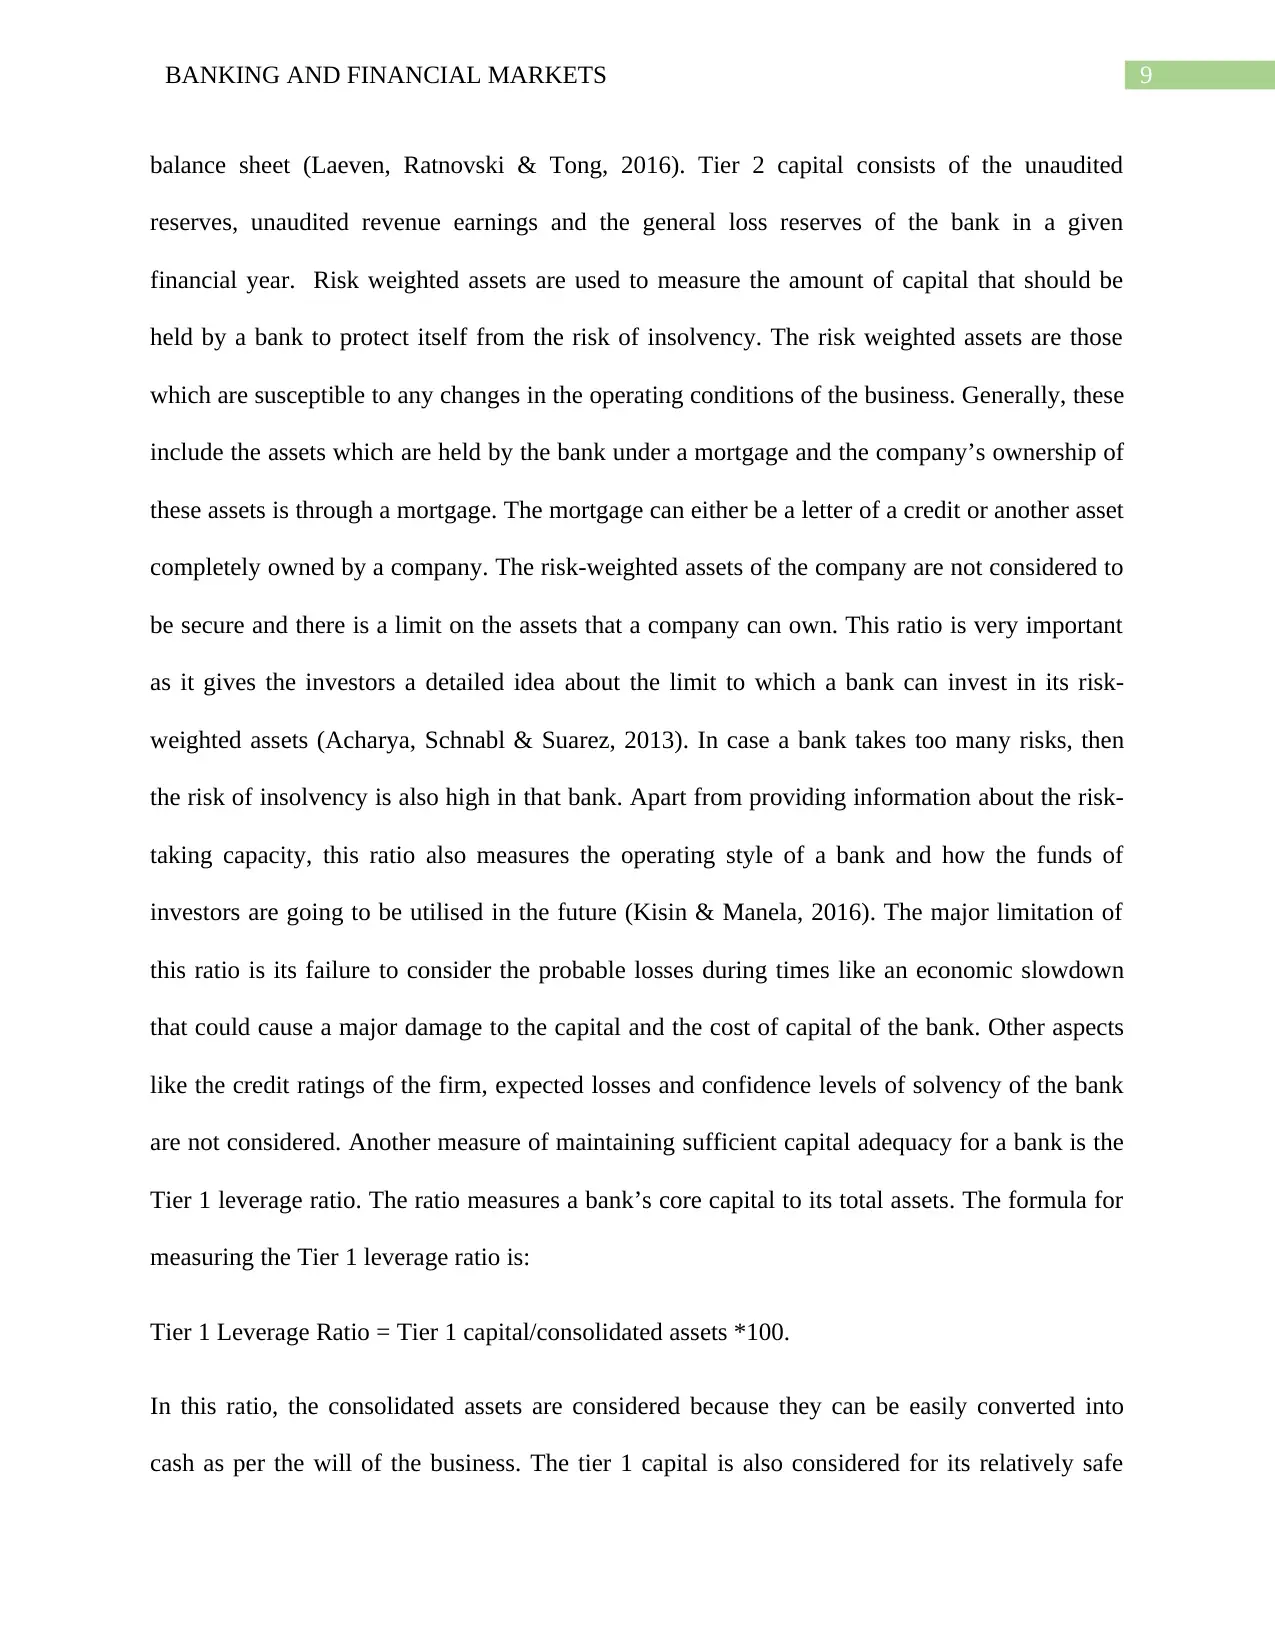
balance sheet (Laeven, Ratnovski & Tong, 2016). Tier 2 capital consists of the unaudited
reserves, unaudited revenue earnings and the general loss reserves of the bank in a given
financial year. Risk weighted assets are used to measure the amount of capital that should be
held by a bank to protect itself from the risk of insolvency. The risk weighted assets are those
which are susceptible to any changes in the operating conditions of the business. Generally, these
include the assets which are held by the bank under a mortgage and the company’s ownership of
these assets is through a mortgage. The mortgage can either be a letter of a credit or another asset
completely owned by a company. The risk-weighted assets of the company are not considered to
be secure and there is a limit on the assets that a company can own. This ratio is very important
as it gives the investors a detailed idea about the limit to which a bank can invest in its risk-
weighted assets (Acharya, Schnabl & Suarez, 2013). In case a bank takes too many risks, then
the risk of insolvency is also high in that bank. Apart from providing information about the risk-
taking capacity, this ratio also measures the operating style of a bank and how the funds of
investors are going to be utilised in the future (Kisin & Manela, 2016). The major limitation of
this ratio is its failure to consider the probable losses during times like an economic slowdown
that could cause a major damage to the capital and the cost of capital of the bank. Other aspects
like the credit ratings of the firm, expected losses and confidence levels of solvency of the bank
are not considered. Another measure of maintaining sufficient capital adequacy for a bank is the
Tier 1 leverage ratio. The ratio measures a bank’s core capital to its total assets. The formula for
measuring the Tier 1 leverage ratio is:
Tier 1 Leverage Ratio = Tier 1 capital/consolidated assets *100.
In this ratio, the consolidated assets are considered because they can be easily converted into
cash as per the will of the business. The tier 1 capital is also considered for its relatively safe
Paraphrase This Document
Need a fresh take? Get an instant paraphrase of this document with our AI Paraphraser
10BANKING AND FINANCIAL MARKETS
nature in comparison to other forms of capital owned by the business (Brei & Gambacorta,
2014). This ratio is generally used by the monetary authorities to determine the extent of the
leveraging of the capital base of a bank. One of the limitations of using the Tier 1 leverage ratio
is the trust of the customers on the bank to calculate this ratio properly. Any miscalculation on
their part is likely to mislead the consumers about the performance of the bank until the
happening of a financial crisis.
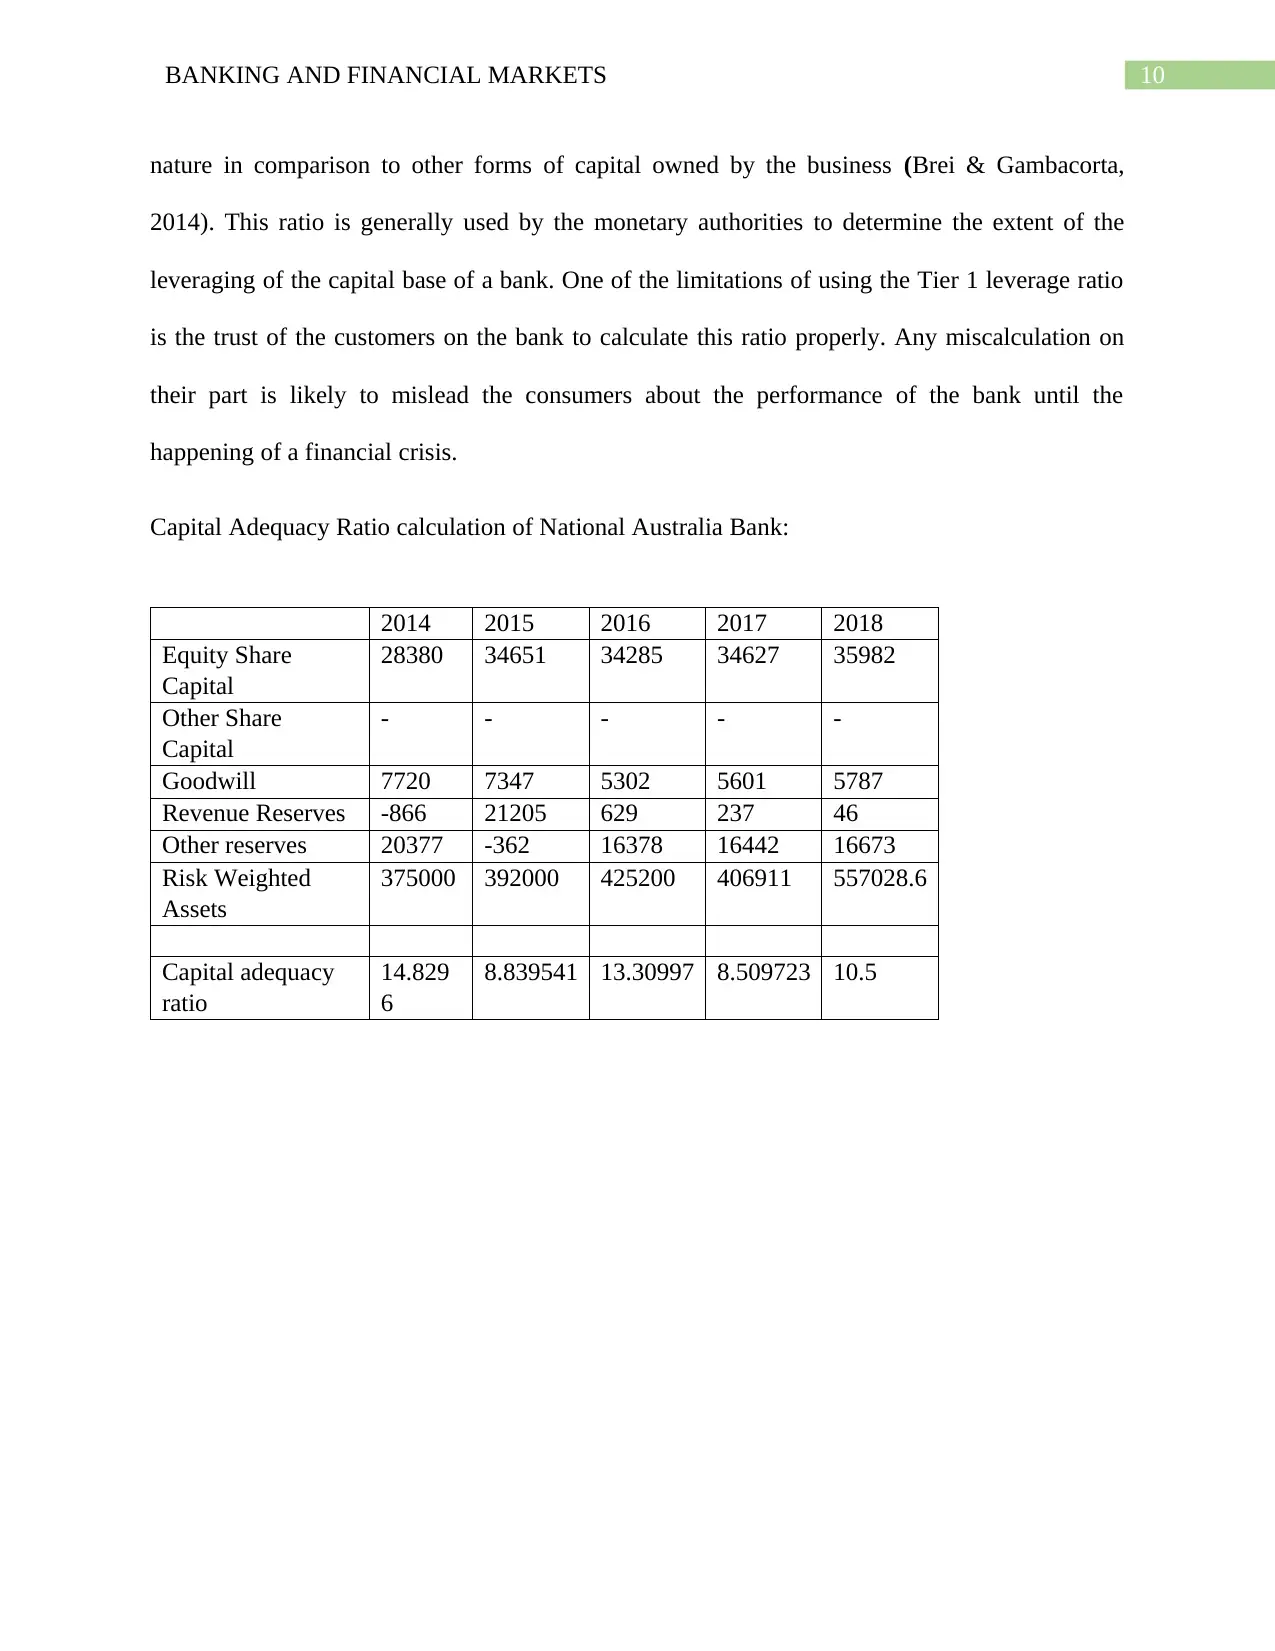
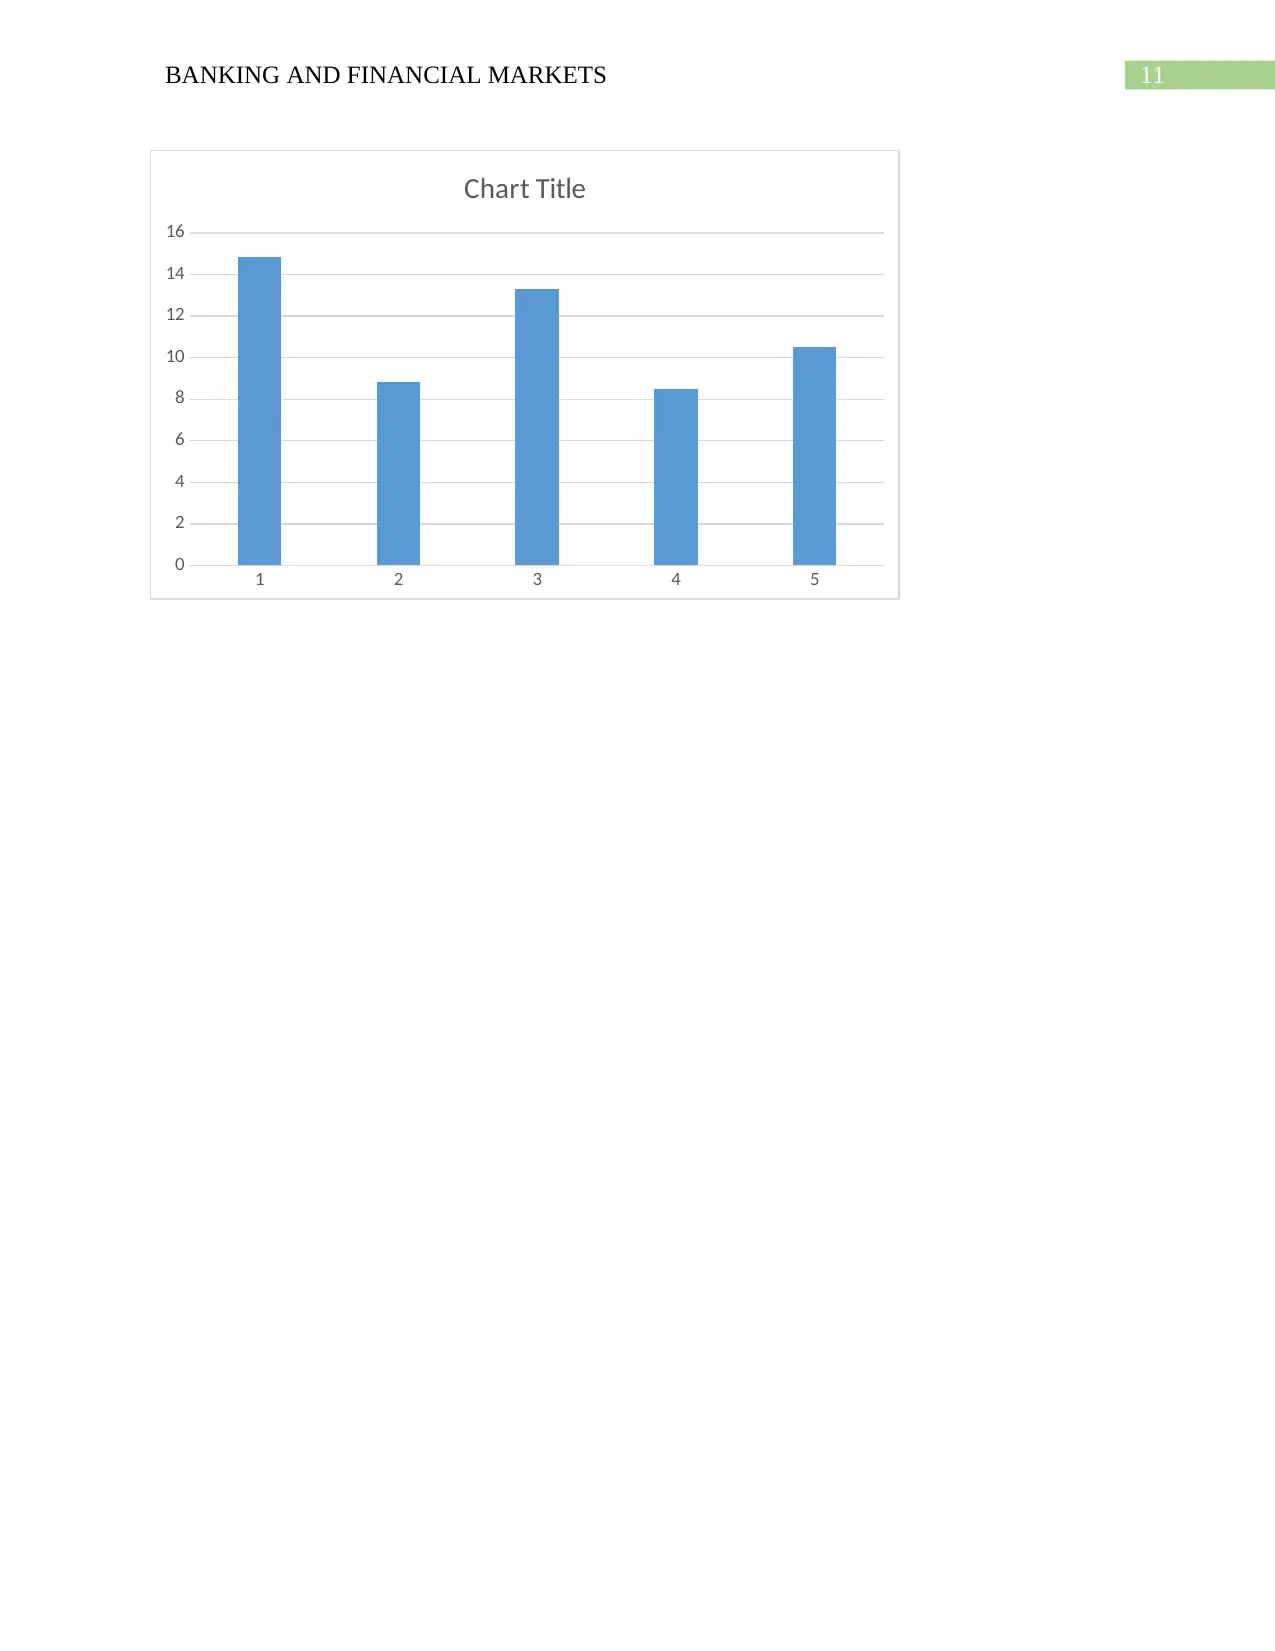
Capital Adequacy Ratio calculation of National Australia Bank:
2014 2015 2016 2017 2018
Equity Share
Capital
28380 34651 34285 34627 35982
Other Share
Capital
- - - - -
Goodwill 7720 7347 5302 5601 5787
Revenue Reserves -866 21205 629 237 46
Other reserves 20377 -362 16378 16442 16673
Risk Weighted
Assets
375000 392000 425200 406911 557028.6
Capital adequacy
ratio
14.829
6
8.839541 13.30997 8.509723 10.5
nature in comparison to other forms of capital owned by the business (Brei & Gambacorta,
2014). This ratio is generally used by the monetary authorities to determine the extent of the
leveraging of the capital base of a bank. One of the limitations of using the Tier 1 leverage ratio
is the trust of the customers on the bank to calculate this ratio properly. Any miscalculation on
their part is likely to mislead the consumers about the performance of the bank until the
happening of a financial crisis.
Capital Adequacy Ratio calculation of National Australia Bank:
2014 2015 2016 2017 2018
Equity Share
Capital
28380 34651 34285 34627 35982
Other Share
Capital
- - - - -
Goodwill 7720 7347 5302 5601 5787
Revenue Reserves -866 21205 629 237 46
Other reserves 20377 -362 16378 16442 16673
Risk Weighted
Assets
375000 392000 425200 406911 557028.6
Capital adequacy
ratio
14.829
6
8.839541 13.30997 8.509723 10.5
11BANKING AND FINANCIAL MARKETS
1 2 3 4 5
0
2
4
6
8
10
12
14
16
Chart Title
1 2 3 4 5
0
2
4
6
8
10
12
14
16
Chart Title
⊘ This is a preview!⊘
Do you want full access?
Subscribe today to unlock all pages.
Trusted by 1+ million students worldwide
1 out of 21
Related Documents


Your All-in-One AI-Powered Toolkit for Academic Success.
+13062052269
info@desklib.com
Available 24*7 on WhatsApp / Email
![[object Object]](/_next/static/media/star-bottom.7253800d.svg)
Unlock your academic potential
Copyright © 2020–2026 A2Z Services. All Rights Reserved. Developed and managed by ZUCOL.