Banking and Financial System Project Report: Citi Group Credit Rating
VerifiedAdded on 2023/06/03
|18
|3778
|344
Project
AI Summary
This project report presents a comprehensive credit rating analysis of Citi Group, a major player in the financial services industry. The analysis employs the CAMEL framework, a critical method for evaluating a bank's financial health, focusing on Capital adequacy, Asset quality, Management, Earnings, and Liquidity. The report compares Citi Group's performance with that of its competitor, JP Morgan Chase & Co., using financial data and ratios to assess key aspects of the bank's operations. The analysis includes evaluations of capital ratios, asset efficiency, management effectiveness, earnings performance (including return on assets and net interest margin), and liquidity. The report concludes with an overall assessment of Citi Group's financial strength and the associated risks, providing a detailed view of the bank's standing in the financial market.
Running Head: Banking and Financial System
1
Project Report: Banking and Financial System
1
Project Report: Banking and Financial System
Paraphrase This Document
Need a fresh take? Get an instant paraphrase of this document with our AI Paraphraser
Banking and Financial System
2
Executive summary:
This report represents about the credit rating analysis on the Citi group. In order to
evaluate the performance at better level, the position has been compared with the main
competitors of the business “J P Morgan limited”. In order to offer the credit rating, CAMEL
analysis has been performed on the company. the report concludes that the average rating of
Citi Group is 3.08 which explains that the company is financially strong and the associated
risk with the bank is average.
Banking and Financial System
3
Contents
Introduction.......................................................................................................................4
Citi group..........................................................................................................................4
JP Morgan chase limited...................................................................................................4
CAMEL analysis..............................................................................................................5
Capital adequacy...........................................................................................................5
Asset quality.................................................................................................................6
Management.................................................................................................................8
Earnings......................................................................................................................10
Liquidity.....................................................................................................................12
Rating analysis................................................................................................................14
Conclusion......................................................................................................................15
References.......................................................................................................................16
Appendix.........................................................................................................................17
⊘ This is a preview!⊘
Do you want full access?
Subscribe today to unlock all pages.
Trusted by 1+ million students worldwide
Banking and Financial System
4
Introduction:
“CAMEL” refers to an analysis method which is applied on the banks to measure
their financial and non financial performance. This method is used in terms of providing the
rating to the bank. The word “CAMEL” stands for capital adequacy, asset quality,
management, earnings and liquidity. Ratings are assigned to the bank for each of the
component in order to measure the financial condition of the bank.
The ratings are given to the bank on the scale of 1 to 5. If a bank has 1 or 2 credit
rating than it depicts about the normal financial condition of the banks whereas in case of 3, 4
and 5 credit rating, the banks are moderate to extreme degree of supervisory vision. In order
to evaluate and CAMEL analysis, the below two banks have been taken into concern:
Citi group
JP Morgan limited
Citi group:
Citi group has been founded in the year of 1812 at New York. The bank is the
consumer division of “Financial services multinational Citi group”. The main products of the
bank include saving accounts, credit cards, term deposit, cash management accounts, wealth
management and loans. The main eservices of the bank are financial services. The parent
company “Citi Bank” is running various subsidiary companies in order to manage the
activities and operations of the bank. Currently, around 2649 branches are operated by the
bank in 19 countries which includes 1494 branches in Mexico and 723 branches in the US
market (Home, 2018). In order to compare the performance of Citi Bank with industry peer,
JP Morgan limited has been chosen because of the leadership state in the industry.
JP Morgan chase limited:
JP Morgan chase and co is investment banking and commercial institutions which has
been founded in the year of 1799 by JP Morgan. Headquarter of the bank is in New York,
United states. It is the largest bank in the US market. And it has been ranked as 6th largest
bank at global level in terms of the total assets. The company is serving its products and
services at international level. According to the current report, around 2,50,000 people are
working with the company in order to improve the operations and run the activities efficiently
Paraphrase This Document
Need a fresh take? Get an instant paraphrase of this document with our AI Paraphraser
Banking and Financial System
5
(Home, 2018). The main subsidiary companies of the bank are Chase bank, J P Morgan & co,
J P Morgan Cazenove and one equity partners.
CAMEL analysis:
CAMEL analysis is a rating system which is used in the banks to regulate and
examine the financial position. It evaluates the overall position and performance of the bank
in order to determine all the associated strength and weakness. The profit and loss account,
balance sheet and other financial notes are important in order to identify the performance and
offer the rating to the bank. The CAMEL analysis study has been performed on Citi bank
along with the J P Morgan to identify the rating of the bank.
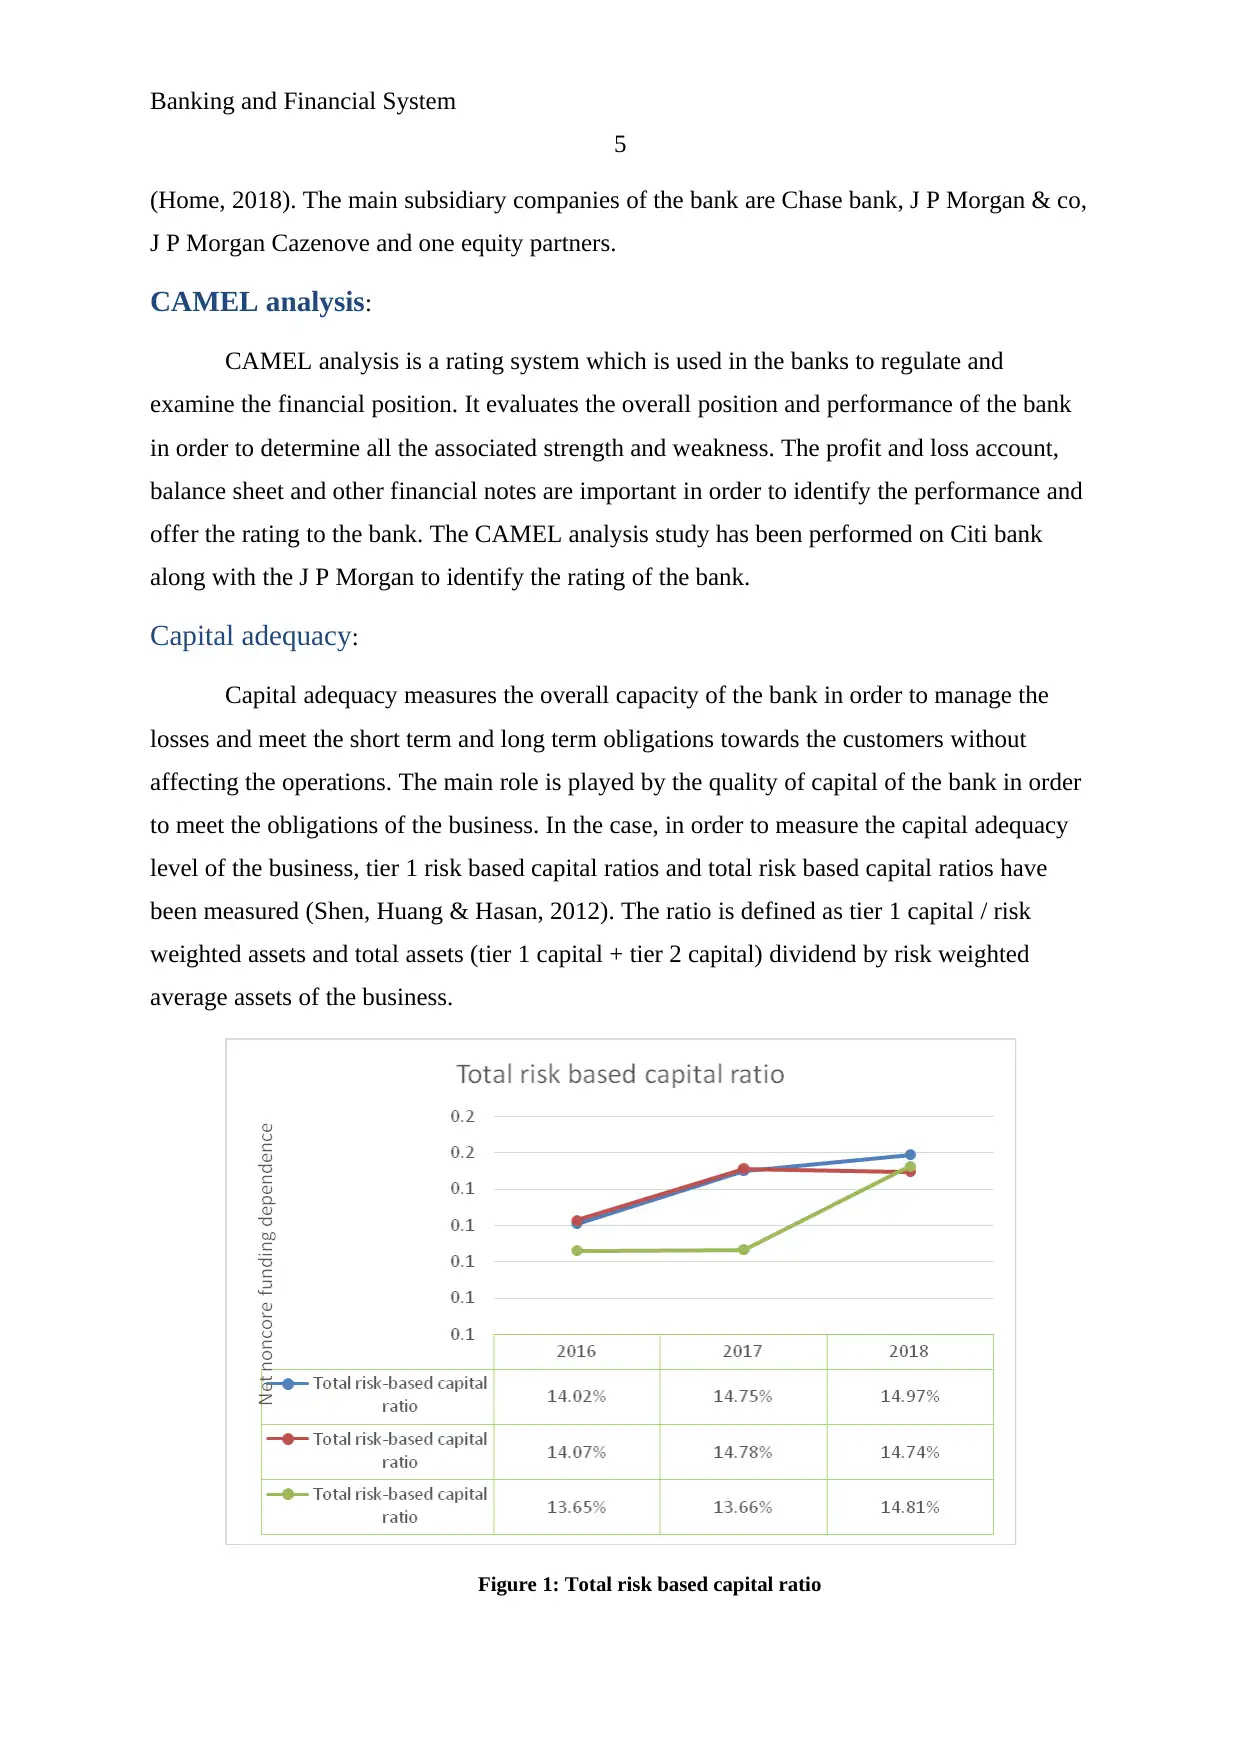
Capital adequacy:
Capital adequacy measures the overall capacity of the bank in order to manage the
losses and meet the short term and long term obligations towards the customers without
affecting the operations. The main role is played by the quality of capital of the bank in order
to meet the obligations of the business. In the case, in order to measure the capital adequacy
level of the business, tier 1 risk based capital ratios and total risk based capital ratios have
been measured (Shen, Huang & Hasan, 2012). The ratio is defined as tier 1 capital / risk
weighted assets and total assets (tier 1 capital + tier 2 capital) dividend by risk weighted
average assets of the business.
Figure 1: Total risk based capital ratio
5
(Home, 2018). The main subsidiary companies of the bank are Chase bank, J P Morgan & co,
J P Morgan Cazenove and one equity partners.
CAMEL analysis:
CAMEL analysis is a rating system which is used in the banks to regulate and
examine the financial position. It evaluates the overall position and performance of the bank
in order to determine all the associated strength and weakness. The profit and loss account,
balance sheet and other financial notes are important in order to identify the performance and
offer the rating to the bank. The CAMEL analysis study has been performed on Citi bank
along with the J P Morgan to identify the rating of the bank.
Capital adequacy:
Capital adequacy measures the overall capacity of the bank in order to manage the
losses and meet the short term and long term obligations towards the customers without
affecting the operations. The main role is played by the quality of capital of the bank in order
to meet the obligations of the business. In the case, in order to measure the capital adequacy
level of the business, tier 1 risk based capital ratios and total risk based capital ratios have
been measured (Shen, Huang & Hasan, 2012). The ratio is defined as tier 1 capital / risk
weighted assets and total assets (tier 1 capital + tier 2 capital) dividend by risk weighted
average assets of the business.
Figure 1: Total risk based capital ratio
Banking and Financial System
6
(Annual report, 2018)
The graph explains that both the banks have sufficient capital adequacy in order to
handle the solvency pressure on the basis through available assets. Among the banks and
comm. Bank assets, the total risk based capital ratio of Citi group bank is highest (Annual
report, 2018). It has been found that few changes have occurred into the capital adequacy
position of all the three banks in last 3 years because of the various internal and external
changes.
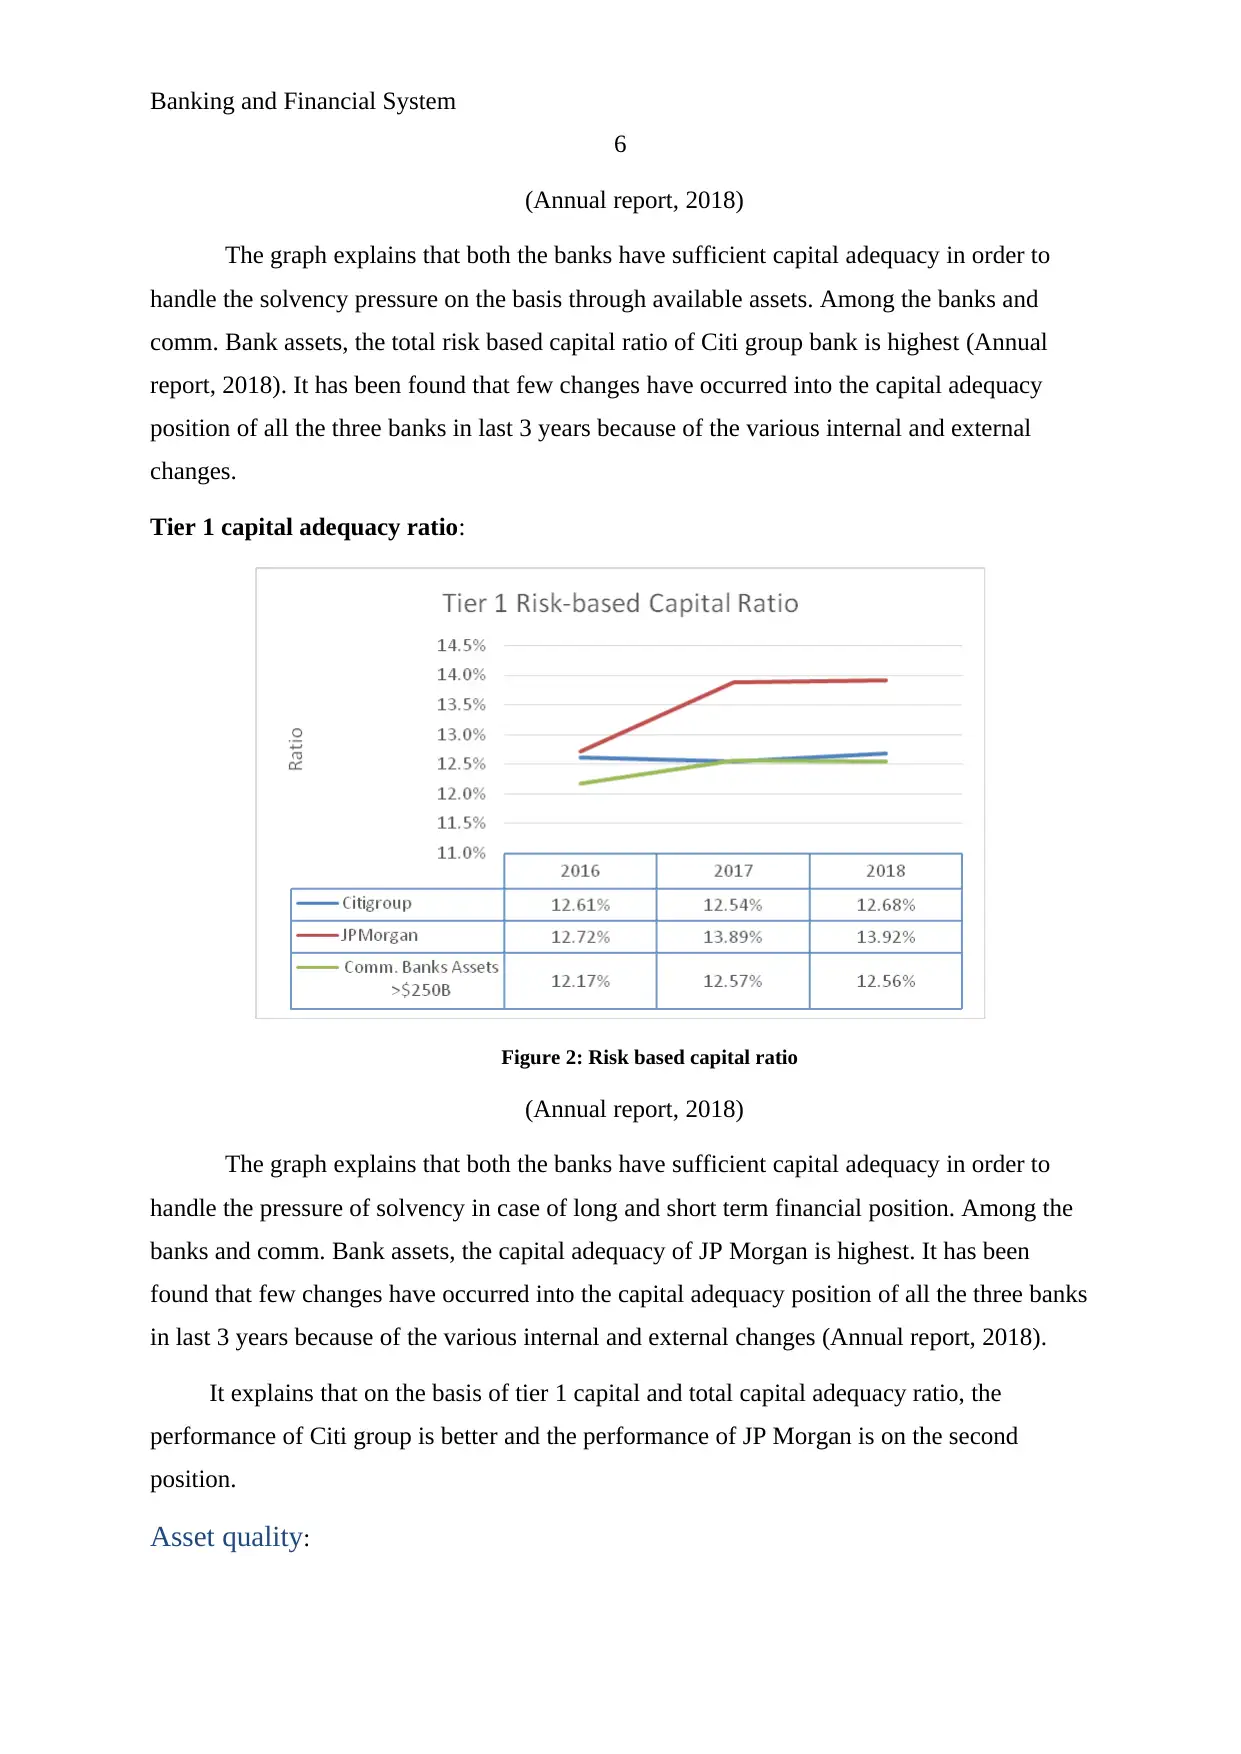
Tier 1 capital adequacy ratio:
Figure 2: Risk based capital ratio
(Annual report, 2018)
The graph explains that both the banks have sufficient capital adequacy in order to
handle the pressure of solvency in case of long and short term financial position. Among the
banks and comm. Bank assets, the capital adequacy of JP Morgan is highest. It has been
found that few changes have occurred into the capital adequacy position of all the three banks
in last 3 years because of the various internal and external changes (Annual report, 2018).
It explains that on the basis of tier 1 capital and total capital adequacy ratio, the
performance of Citi group is better and the performance of JP Morgan is on the second
position.
Asset quality:
6
(Annual report, 2018)
The graph explains that both the banks have sufficient capital adequacy in order to
handle the solvency pressure on the basis through available assets. Among the banks and
comm. Bank assets, the total risk based capital ratio of Citi group bank is highest (Annual
report, 2018). It has been found that few changes have occurred into the capital adequacy
position of all the three banks in last 3 years because of the various internal and external
changes.
Tier 1 capital adequacy ratio:
Figure 2: Risk based capital ratio
(Annual report, 2018)
The graph explains that both the banks have sufficient capital adequacy in order to
handle the pressure of solvency in case of long and short term financial position. Among the
banks and comm. Bank assets, the capital adequacy of JP Morgan is highest. It has been
found that few changes have occurred into the capital adequacy position of all the three banks
in last 3 years because of the various internal and external changes (Annual report, 2018).
It explains that on the basis of tier 1 capital and total capital adequacy ratio, the
performance of Citi group is better and the performance of JP Morgan is on the second
position.
Asset quality:
⊘ This is a preview!⊘
Do you want full access?
Subscribe today to unlock all pages.
Trusted by 1+ million students worldwide
Banking and Financial System
7
Asset represent about all the resources of bank such as current and fixed resources,
loans, real estates, investments and all the transaction of the banks which are off balance
sheet. In order to measure the asset quality of the banks, following ratios have been analyzed:
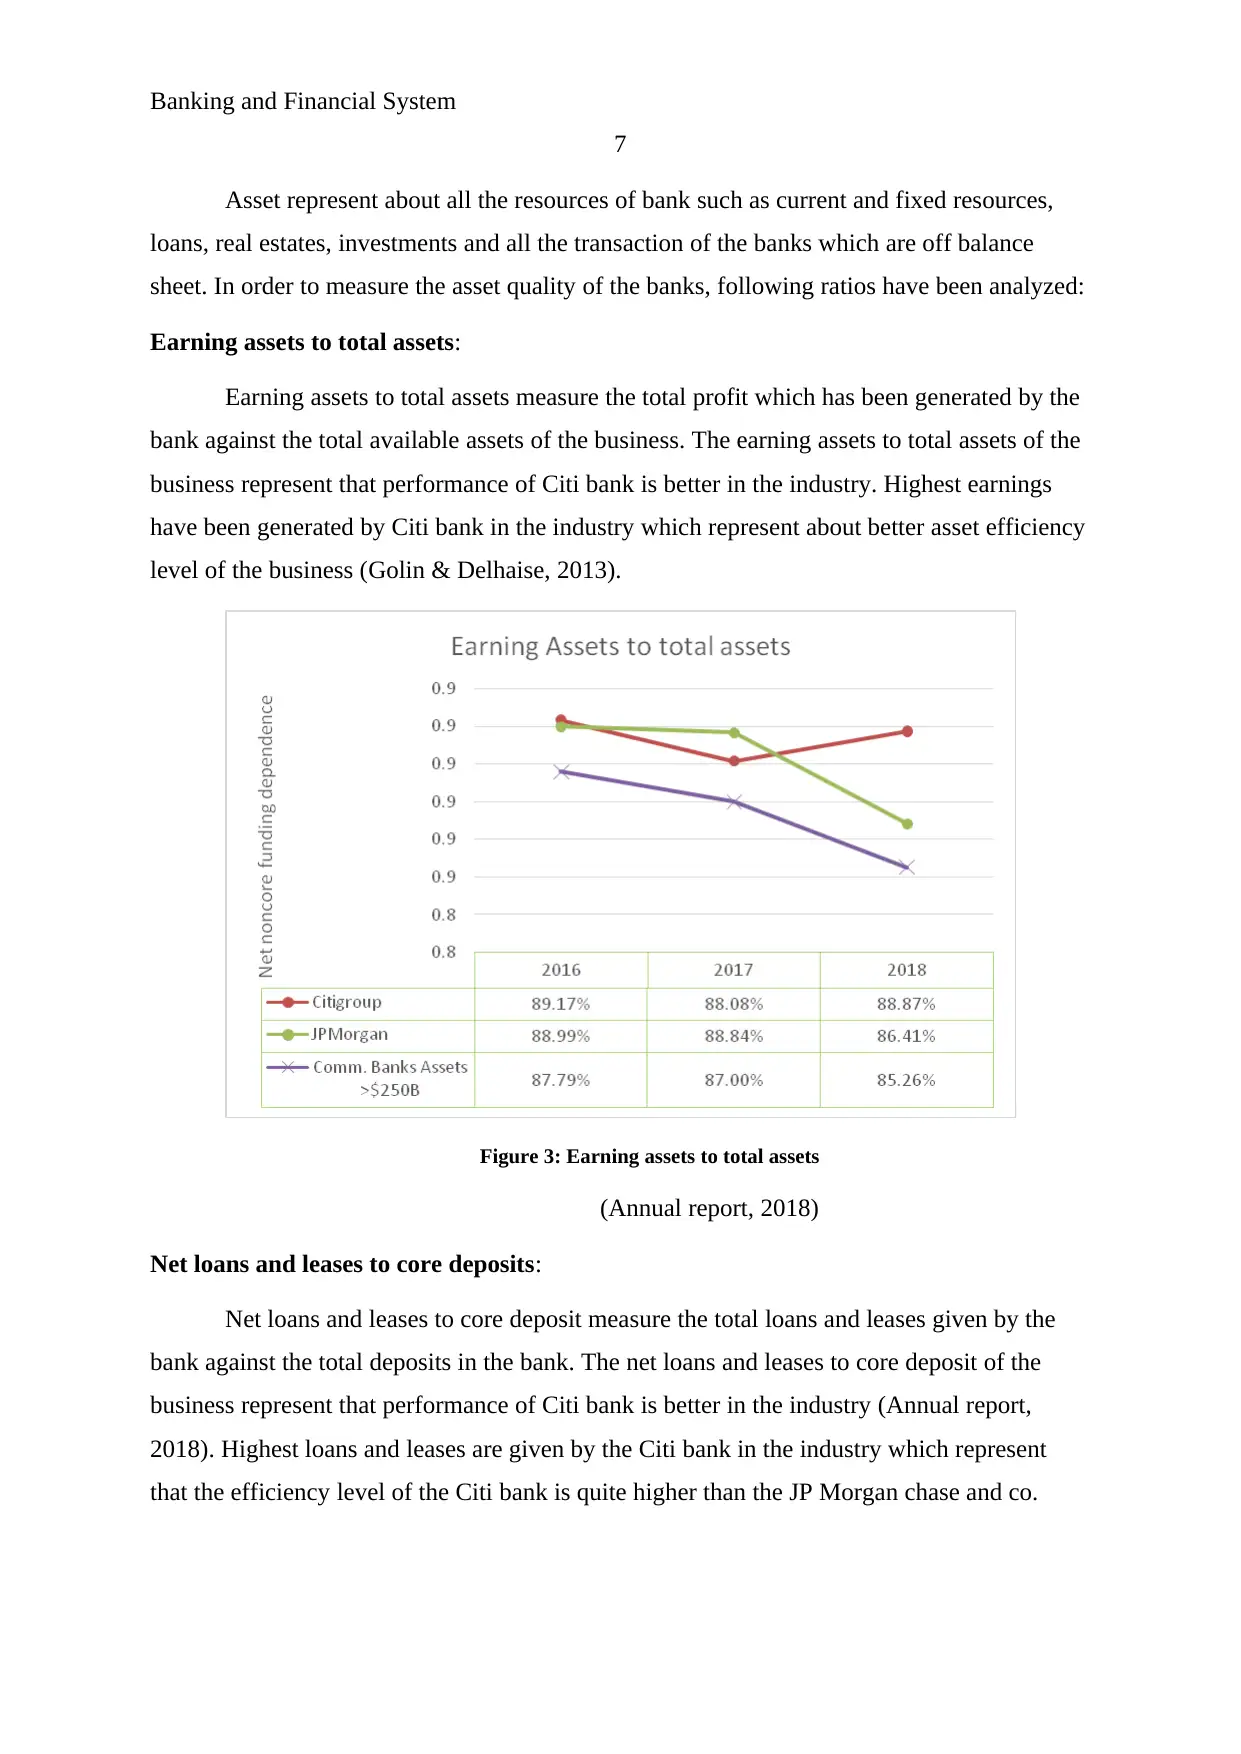
Earning assets to total assets:
Earning assets to total assets measure the total profit which has been generated by the
bank against the total available assets of the business. The earning assets to total assets of the
business represent that performance of Citi bank is better in the industry. Highest earnings
have been generated by Citi bank in the industry which represent about better asset efficiency
level of the business (Golin & Delhaise, 2013).
Figure 3: Earning assets to total assets
(Annual report, 2018)
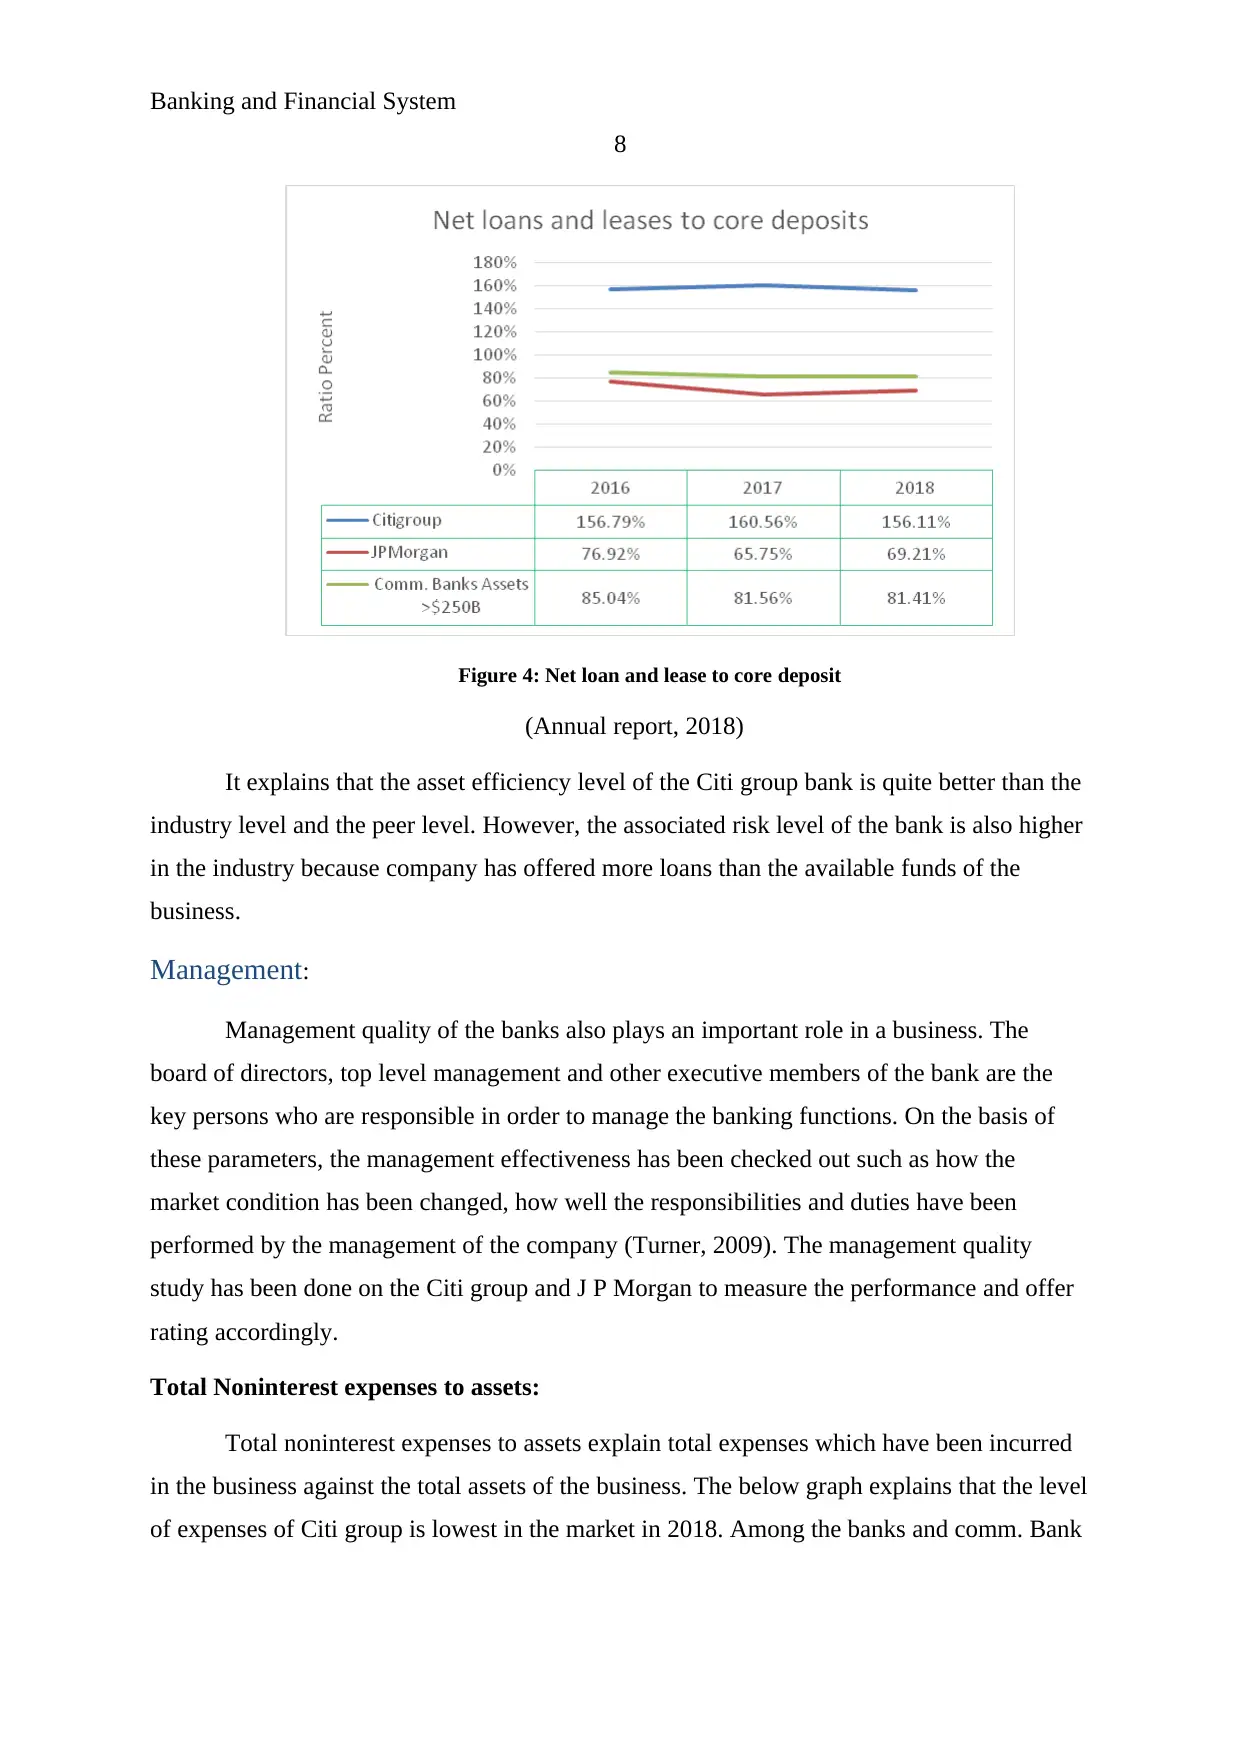
Net loans and leases to core deposits:
Net loans and leases to core deposit measure the total loans and leases given by the
bank against the total deposits in the bank. The net loans and leases to core deposit of the
business represent that performance of Citi bank is better in the industry (Annual report,
2018). Highest loans and leases are given by the Citi bank in the industry which represent
that the efficiency level of the Citi bank is quite higher than the JP Morgan chase and co.
7
Asset represent about all the resources of bank such as current and fixed resources,
loans, real estates, investments and all the transaction of the banks which are off balance
sheet. In order to measure the asset quality of the banks, following ratios have been analyzed:
Earning assets to total assets:
Earning assets to total assets measure the total profit which has been generated by the
bank against the total available assets of the business. The earning assets to total assets of the
business represent that performance of Citi bank is better in the industry. Highest earnings
have been generated by Citi bank in the industry which represent about better asset efficiency
level of the business (Golin & Delhaise, 2013).
Figure 3: Earning assets to total assets
(Annual report, 2018)
Net loans and leases to core deposits:
Net loans and leases to core deposit measure the total loans and leases given by the
bank against the total deposits in the bank. The net loans and leases to core deposit of the
business represent that performance of Citi bank is better in the industry (Annual report,
2018). Highest loans and leases are given by the Citi bank in the industry which represent
that the efficiency level of the Citi bank is quite higher than the JP Morgan chase and co.
Paraphrase This Document
Need a fresh take? Get an instant paraphrase of this document with our AI Paraphraser
Banking and Financial System
8
Figure 4: Net loan and lease to core deposit
(Annual report, 2018)
It explains that the asset efficiency level of the Citi group bank is quite better than the
industry level and the peer level. However, the associated risk level of the bank is also higher
in the industry because company has offered more loans than the available funds of the
business.
Management:
Management quality of the banks also plays an important role in a business. The
board of directors, top level management and other executive members of the bank are the
key persons who are responsible in order to manage the banking functions. On the basis of
these parameters, the management effectiveness has been checked out such as how the
market condition has been changed, how well the responsibilities and duties have been
performed by the management of the company (Turner, 2009). The management quality
study has been done on the Citi group and J P Morgan to measure the performance and offer
rating accordingly.
Total Noninterest expenses to assets:
Total noninterest expenses to assets explain total expenses which have been incurred
in the business against the total assets of the business. The below graph explains that the level
of expenses of Citi group is lowest in the market in 2018. Among the banks and comm. Bank
8
Figure 4: Net loan and lease to core deposit
(Annual report, 2018)
It explains that the asset efficiency level of the Citi group bank is quite better than the
industry level and the peer level. However, the associated risk level of the bank is also higher
in the industry because company has offered more loans than the available funds of the
business.
Management:
Management quality of the banks also plays an important role in a business. The
board of directors, top level management and other executive members of the bank are the
key persons who are responsible in order to manage the banking functions. On the basis of
these parameters, the management effectiveness has been checked out such as how the
market condition has been changed, how well the responsibilities and duties have been
performed by the management of the company (Turner, 2009). The management quality
study has been done on the Citi group and J P Morgan to measure the performance and offer
rating accordingly.
Total Noninterest expenses to assets:
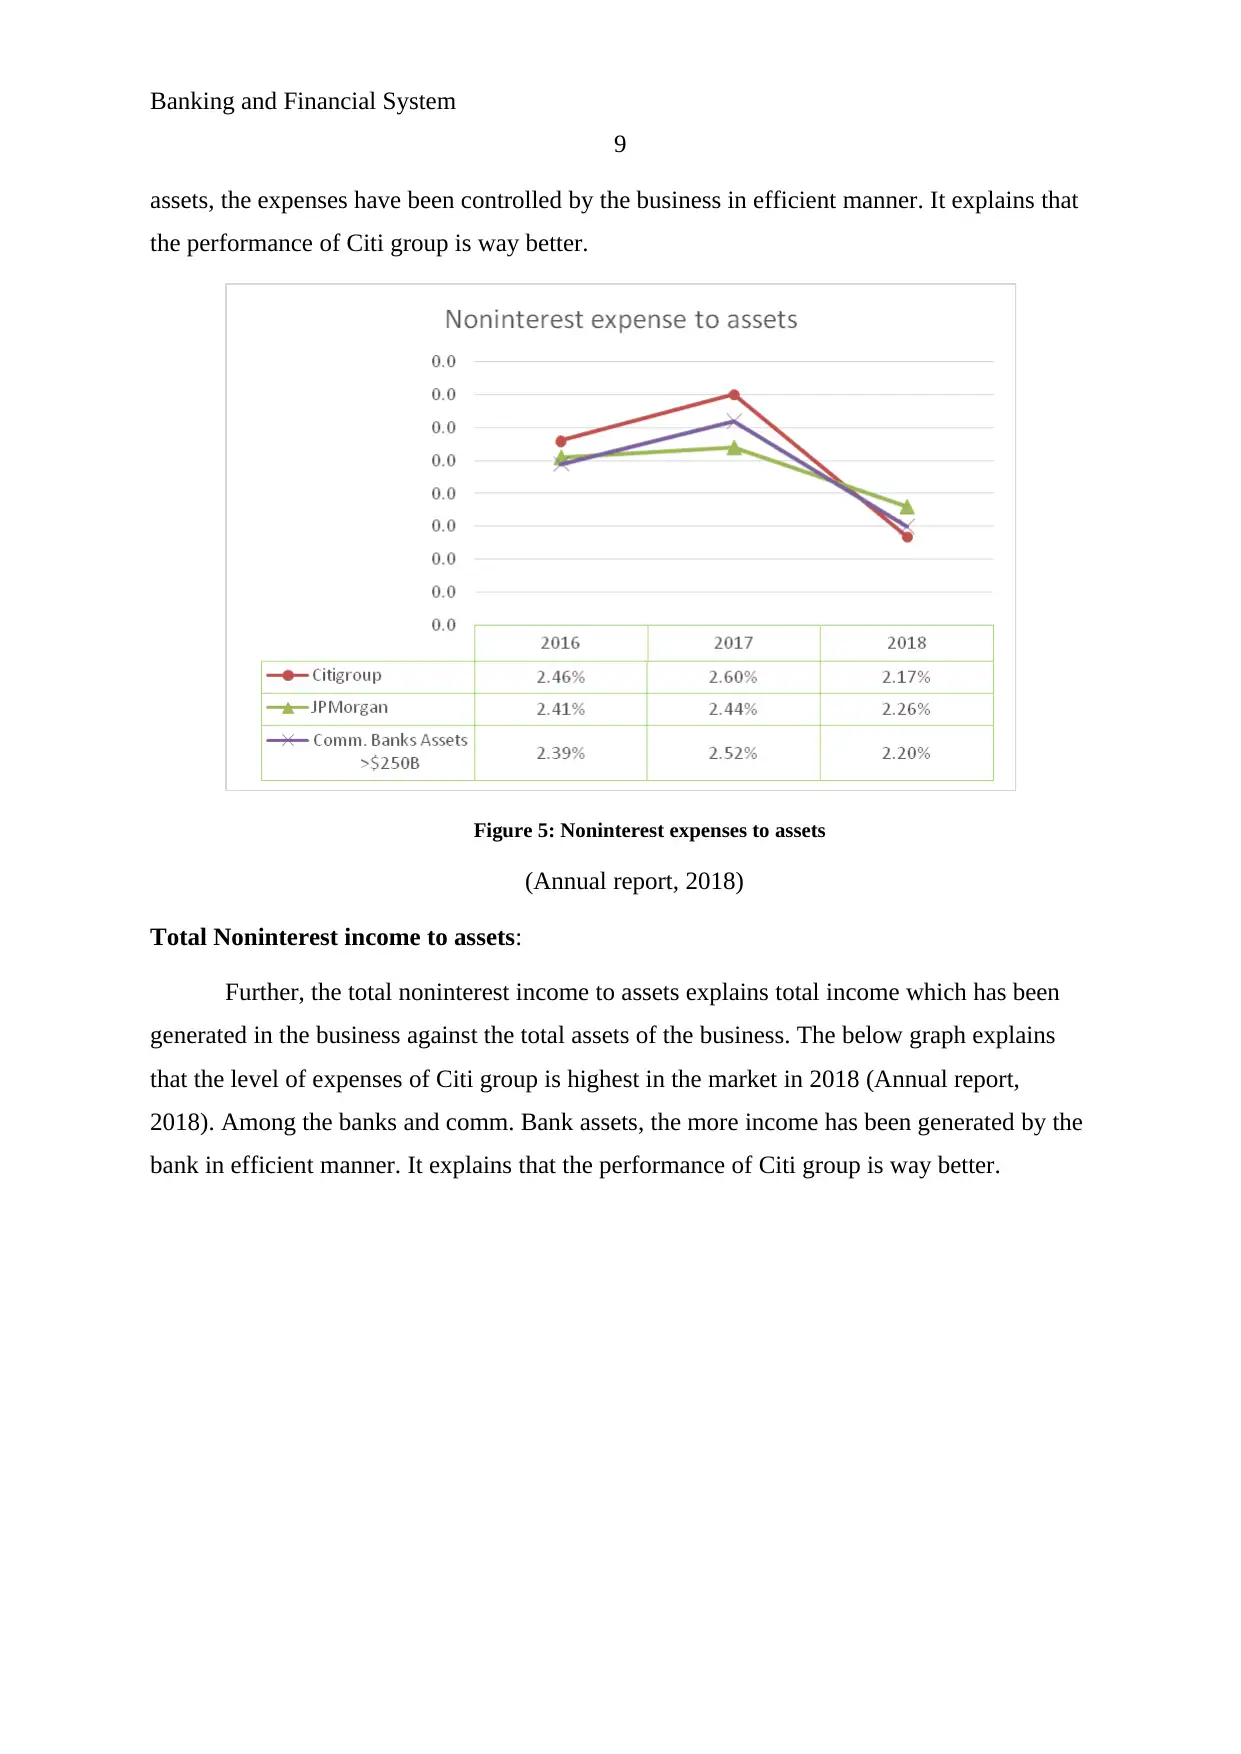
Total noninterest expenses to assets explain total expenses which have been incurred
in the business against the total assets of the business. The below graph explains that the level
of expenses of Citi group is lowest in the market in 2018. Among the banks and comm. Bank
Banking and Financial System
9
assets, the expenses have been controlled by the business in efficient manner. It explains that
the performance of Citi group is way better.
Figure 5: Noninterest expenses to assets
(Annual report, 2018)
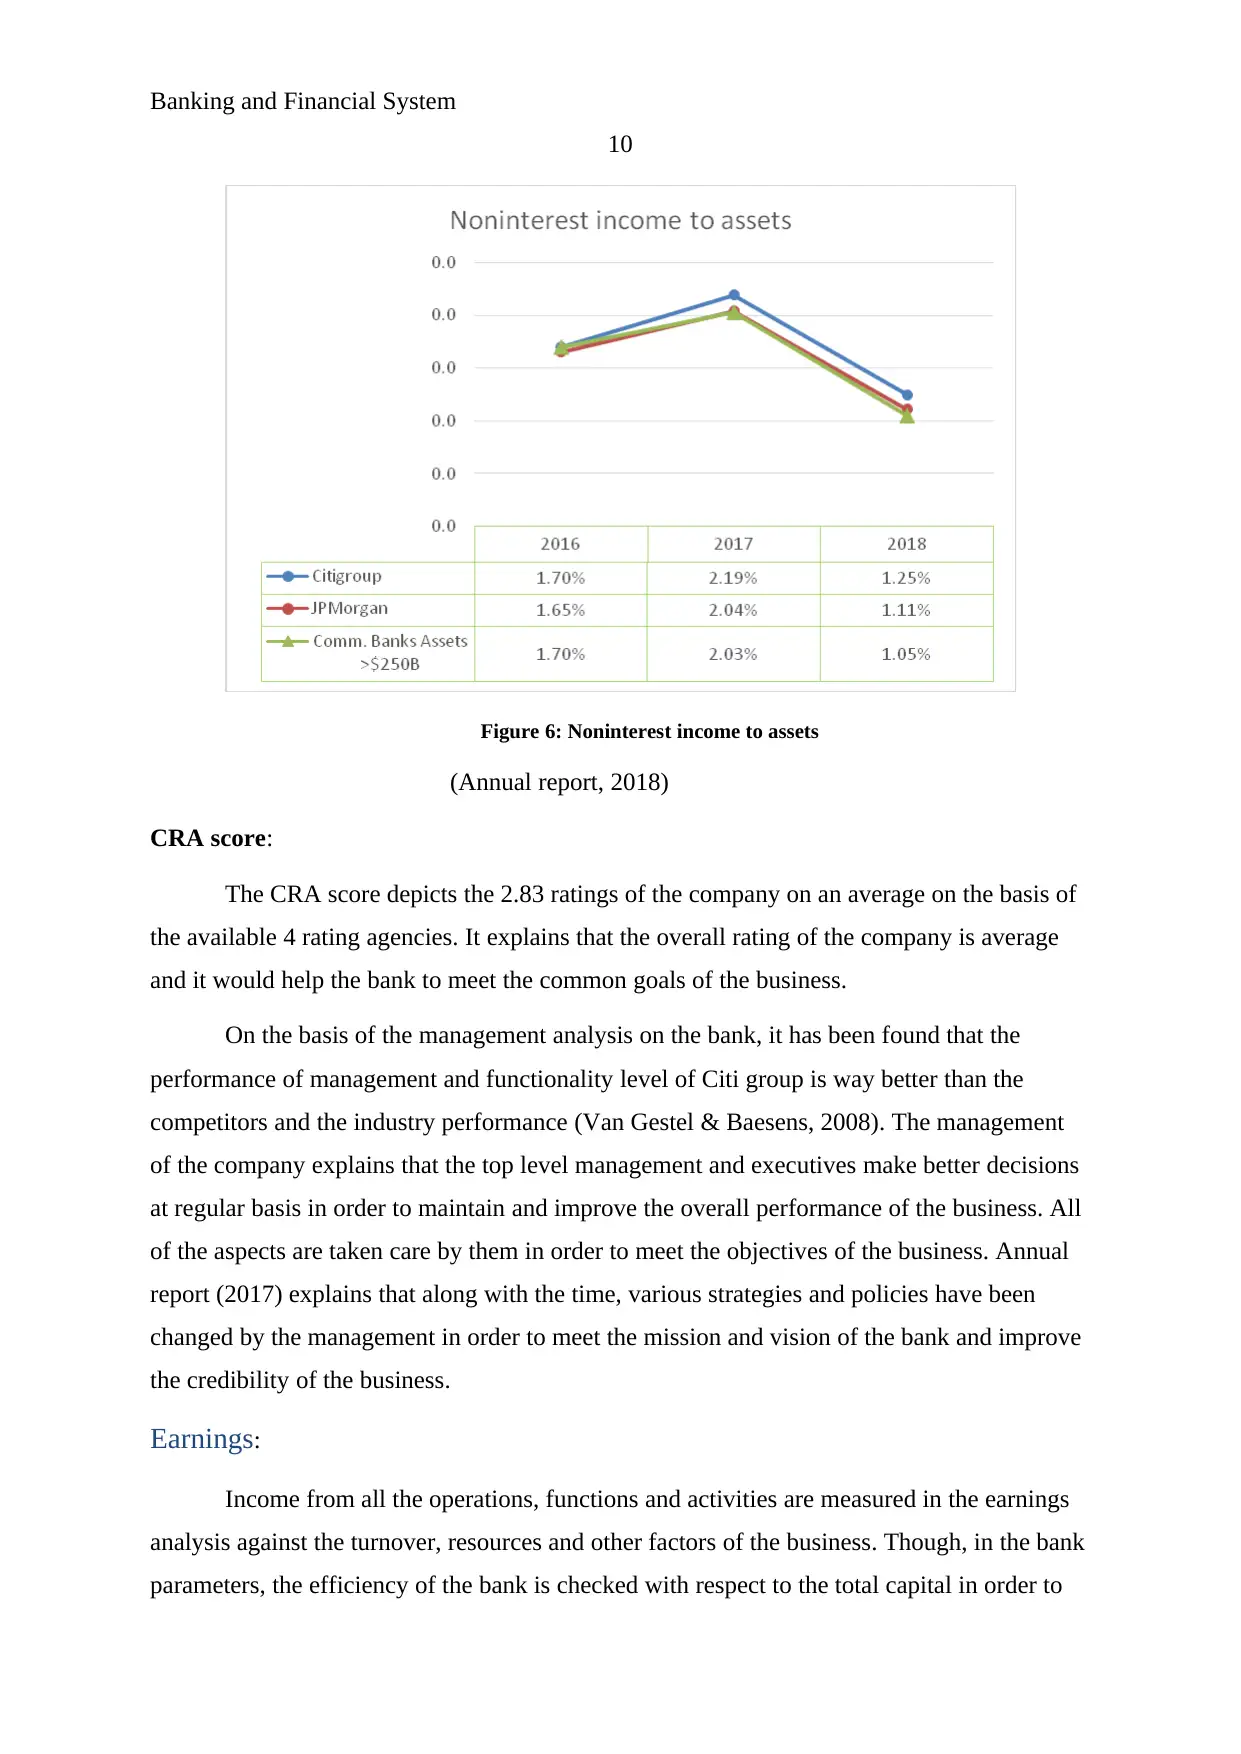
Total Noninterest income to assets:
Further, the total noninterest income to assets explains total income which has been
generated in the business against the total assets of the business. The below graph explains
that the level of expenses of Citi group is highest in the market in 2018 (Annual report,
2018). Among the banks and comm. Bank assets, the more income has been generated by the
bank in efficient manner. It explains that the performance of Citi group is way better.
9
assets, the expenses have been controlled by the business in efficient manner. It explains that
the performance of Citi group is way better.
Figure 5: Noninterest expenses to assets
(Annual report, 2018)
Total Noninterest income to assets:
Further, the total noninterest income to assets explains total income which has been
generated in the business against the total assets of the business. The below graph explains
that the level of expenses of Citi group is highest in the market in 2018 (Annual report,
2018). Among the banks and comm. Bank assets, the more income has been generated by the
bank in efficient manner. It explains that the performance of Citi group is way better.
⊘ This is a preview!⊘
Do you want full access?
Subscribe today to unlock all pages.
Trusted by 1+ million students worldwide
Banking and Financial System
10
Figure 6: Noninterest income to assets
(Annual report, 2018)
CRA score:
The CRA score depicts the 2.83 ratings of the company on an average on the basis of
the available 4 rating agencies. It explains that the overall rating of the company is average
and it would help the bank to meet the common goals of the business.
On the basis of the management analysis on the bank, it has been found that the
performance of management and functionality level of Citi group is way better than the
competitors and the industry performance (Van Gestel & Baesens, 2008). The management
of the company explains that the top level management and executives make better decisions
at regular basis in order to maintain and improve the overall performance of the business. All
of the aspects are taken care by them in order to meet the objectives of the business. Annual
report (2017) explains that along with the time, various strategies and policies have been
changed by the management in order to meet the mission and vision of the bank and improve
the credibility of the business.
Earnings:
Income from all the operations, functions and activities are measured in the earnings
analysis against the turnover, resources and other factors of the business. Though, in the bank
parameters, the efficiency of the bank is checked with respect to the total capital in order to
Paraphrase This Document
Need a fresh take? Get an instant paraphrase of this document with our AI Paraphraser

Banking and Financial System
11
cover all the additional and potential losses and the risk of the business (White, 2010). In
order to measure the efficiency level of the business, below studies and analysis has been
done:
Return on assets:
It represents about the total income against the available resources of the business. It
measures the total profitability level of the business in order to reveal that how much profit
has been generated by the business against the total invested amount of the business.
Figure 7: Return on assets
(Annual report, 2018)
The figure 7 explains that the return on assets of Comm. Banks assets are higher in the
industry and further the level of J P Morgan is better than the Citi group. It explains that the
overall position of the Citi group is not better in terms of the management of the earnings
against the available assets of the business.
Net interest margin:
Net interest margin represents about the difference among the interest income which
has been generated by the bank and the interest amount which has been paid to the lenders. It
measures the total interest amount level of the business in order to reveal that how much
interest has been generated by the business. The below graph explains that the net interest
11
cover all the additional and potential losses and the risk of the business (White, 2010). In
order to measure the efficiency level of the business, below studies and analysis has been
done:
Return on assets:
It represents about the total income against the available resources of the business. It
measures the total profitability level of the business in order to reveal that how much profit
has been generated by the business against the total invested amount of the business.
Figure 7: Return on assets
(Annual report, 2018)
The figure 7 explains that the return on assets of Comm. Banks assets are higher in the
industry and further the level of J P Morgan is better than the Citi group. It explains that the
overall position of the Citi group is not better in terms of the management of the earnings
against the available assets of the business.
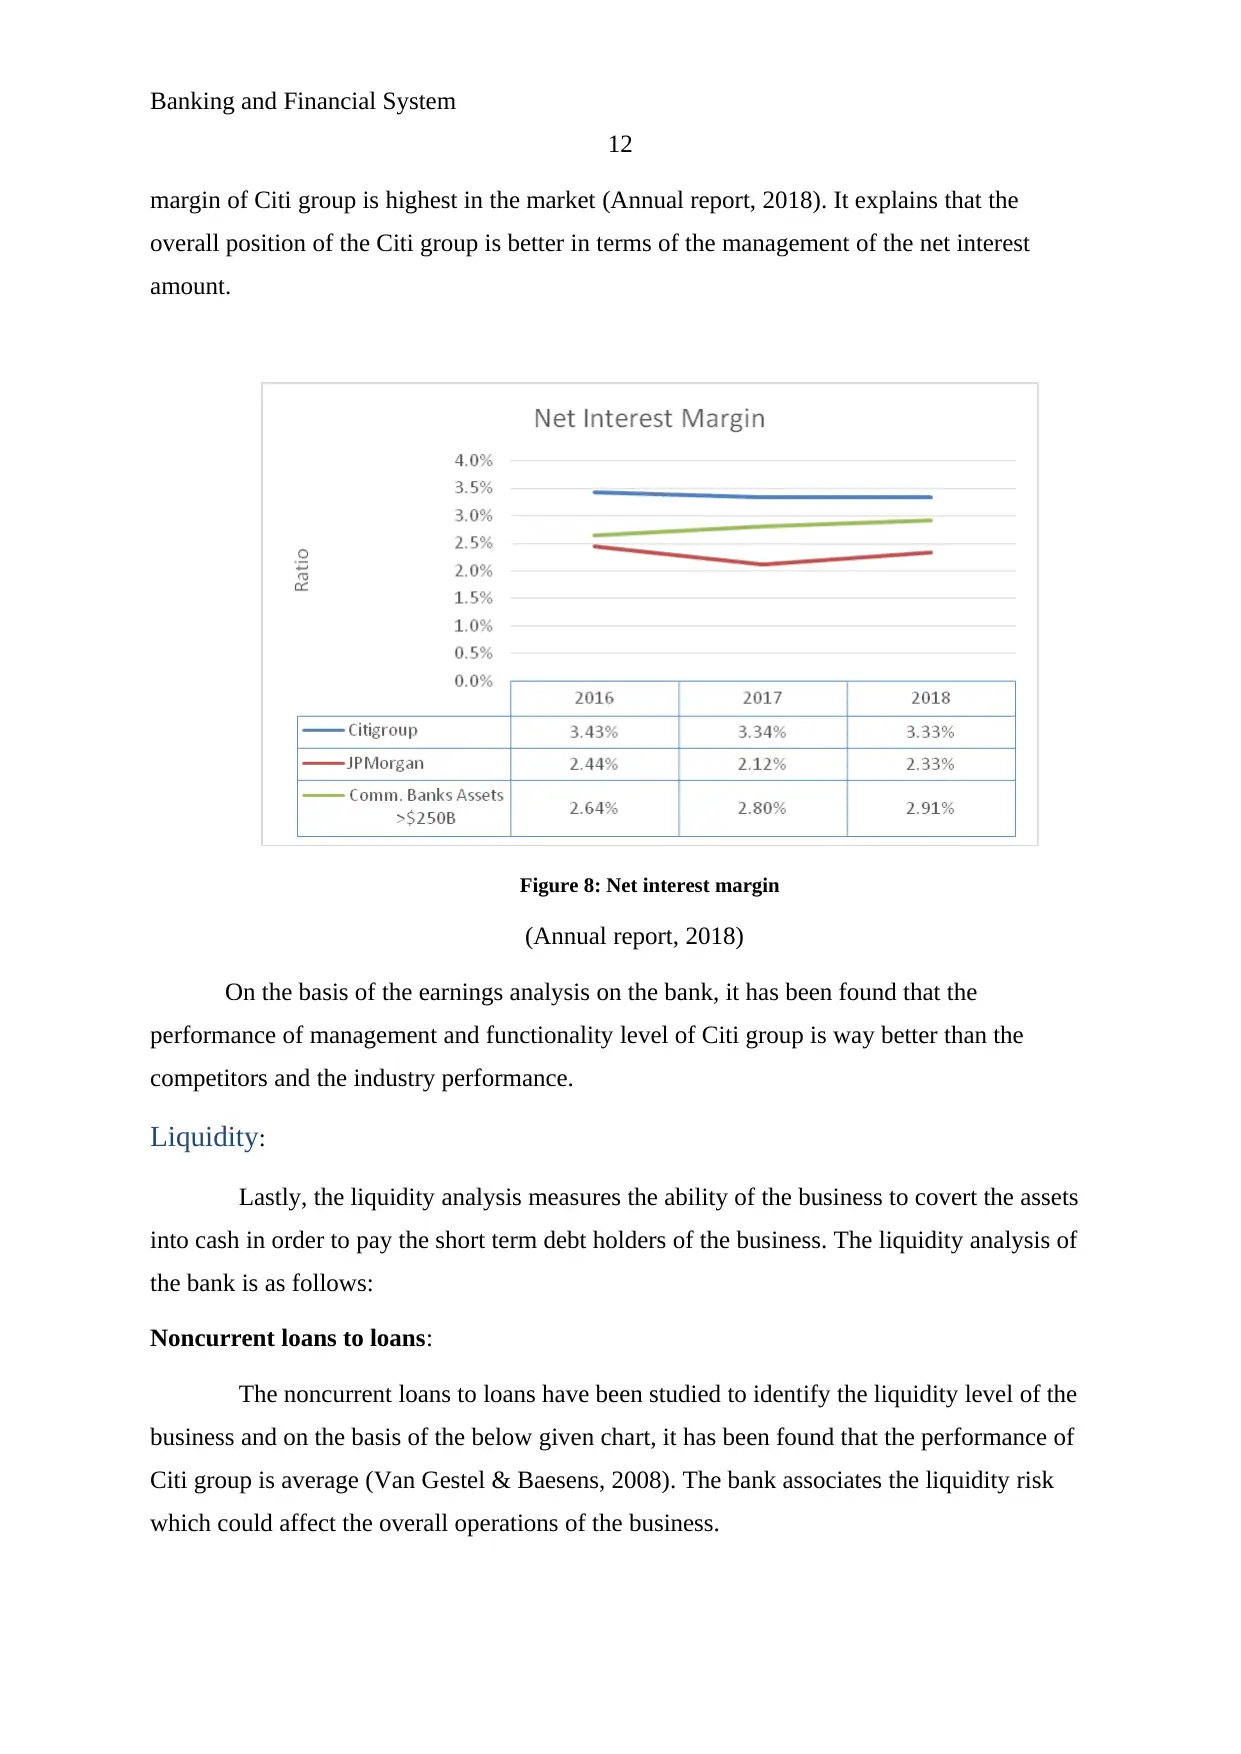
Net interest margin:
Net interest margin represents about the difference among the interest income which
has been generated by the bank and the interest amount which has been paid to the lenders. It
measures the total interest amount level of the business in order to reveal that how much
interest has been generated by the business. The below graph explains that the net interest
Banking and Financial System
12
margin of Citi group is highest in the market (Annual report, 2018). It explains that the
overall position of the Citi group is better in terms of the management of the net interest
amount.
Figure 8: Net interest margin
(Annual report, 2018)
On the basis of the earnings analysis on the bank, it has been found that the
performance of management and functionality level of Citi group is way better than the
competitors and the industry performance.
Liquidity:
Lastly, the liquidity analysis measures the ability of the business to covert the assets
into cash in order to pay the short term debt holders of the business. The liquidity analysis of
the bank is as follows:
Noncurrent loans to loans:
The noncurrent loans to loans have been studied to identify the liquidity level of the
business and on the basis of the below given chart, it has been found that the performance of
Citi group is average (Van Gestel & Baesens, 2008). The bank associates the liquidity risk
which could affect the overall operations of the business.
⊘ This is a preview!⊘
Do you want full access?
Subscribe today to unlock all pages.
Trusted by 1+ million students worldwide
1 out of 18
Related Documents


Your All-in-One AI-Powered Toolkit for Academic Success.
+13062052269
info@desklib.com
Available 24*7 on WhatsApp / Email
![[object Object]](/_next/static/media/star-bottom.7253800d.svg)
Unlock your academic potential
Copyright © 2020–2026 A2Z Services. All Rights Reserved. Developed and managed by ZUCOL.