Corporate Financial Strategy Analysis: Barclay's Performance Report
VerifiedAdded on 2020/01/07
|16
|3941
|210
Report
AI Summary
This report provides a comprehensive analysis of Barclay's corporate financial strategy. It begins with an introduction to corporate finance and its significance, followed by an examination of discount rates and capital structure, calculating the cost of equity, cost of debt, and WACC over a five-year period. The report then assesses Barclay's capital structure. The dividend policy is analyzed, including dividend trends over the last five years, an assessment of the dividend policy, and an analysis of dividend consistency. Various valuation methods, including static and absolute valuation techniques, are applied. The report also explores the corporate life cycle and analyzes shareholder returns, assessing Barclay's performance using value drivers. The conclusion summarizes the key findings and insights derived from the analysis.
Corporate Financial Strategy
Paraphrase This Document
Need a fresh take? Get an instant paraphrase of this document with our AI Paraphraser
Table of Contents
INTRODUCTION...........................................................................................................................3
a) Discount rates and capital structure.............................................................................................3
1. Calculate cost of equity, Cost of debt and WACC for 5 years................................................3
2. Assessment of capital structure................................................................................................7
b) DIVIDEND POLICY..................................................................................................................8
1) Dividend of Barclay in last 5 years.........................................................................................8
2) Assessment of dividend...........................................................................................................9
3) Analyze the consistency of dividends...................................................................................10
c) Valuation....................................................................................................................................10
D) Corporate life cycle...................................................................................................................12
E) Analyzing shareholders return and assessment of Barclay performance with value drivers....13
CONCLUSION..............................................................................................................................14
REFERENCES..............................................................................................................................16
2
INTRODUCTION
Finance is one of the integral aspects of an organization as it accomplishes the primary
goals and the objectives of an entity. The arrangement of finance is essential to fund the financial
requirements of the business. The corporate finance has majorly focuses on the capital structure
that defines various components to be used by an entity including equity and debt components in
the framework. This will help an entity in order to accomplish their financial objectives within a
given time frame. Barclay company has selected for this project report as it all about different
aspects covered in the business such as designing of capital structure and share price analysis.
The efficiency of an entity has been assessed on different criteria by using various valuation
methods to judge the existing abilities of an enterprise. The market perspective will also be
assessed to achieve their desired aims and objectives.
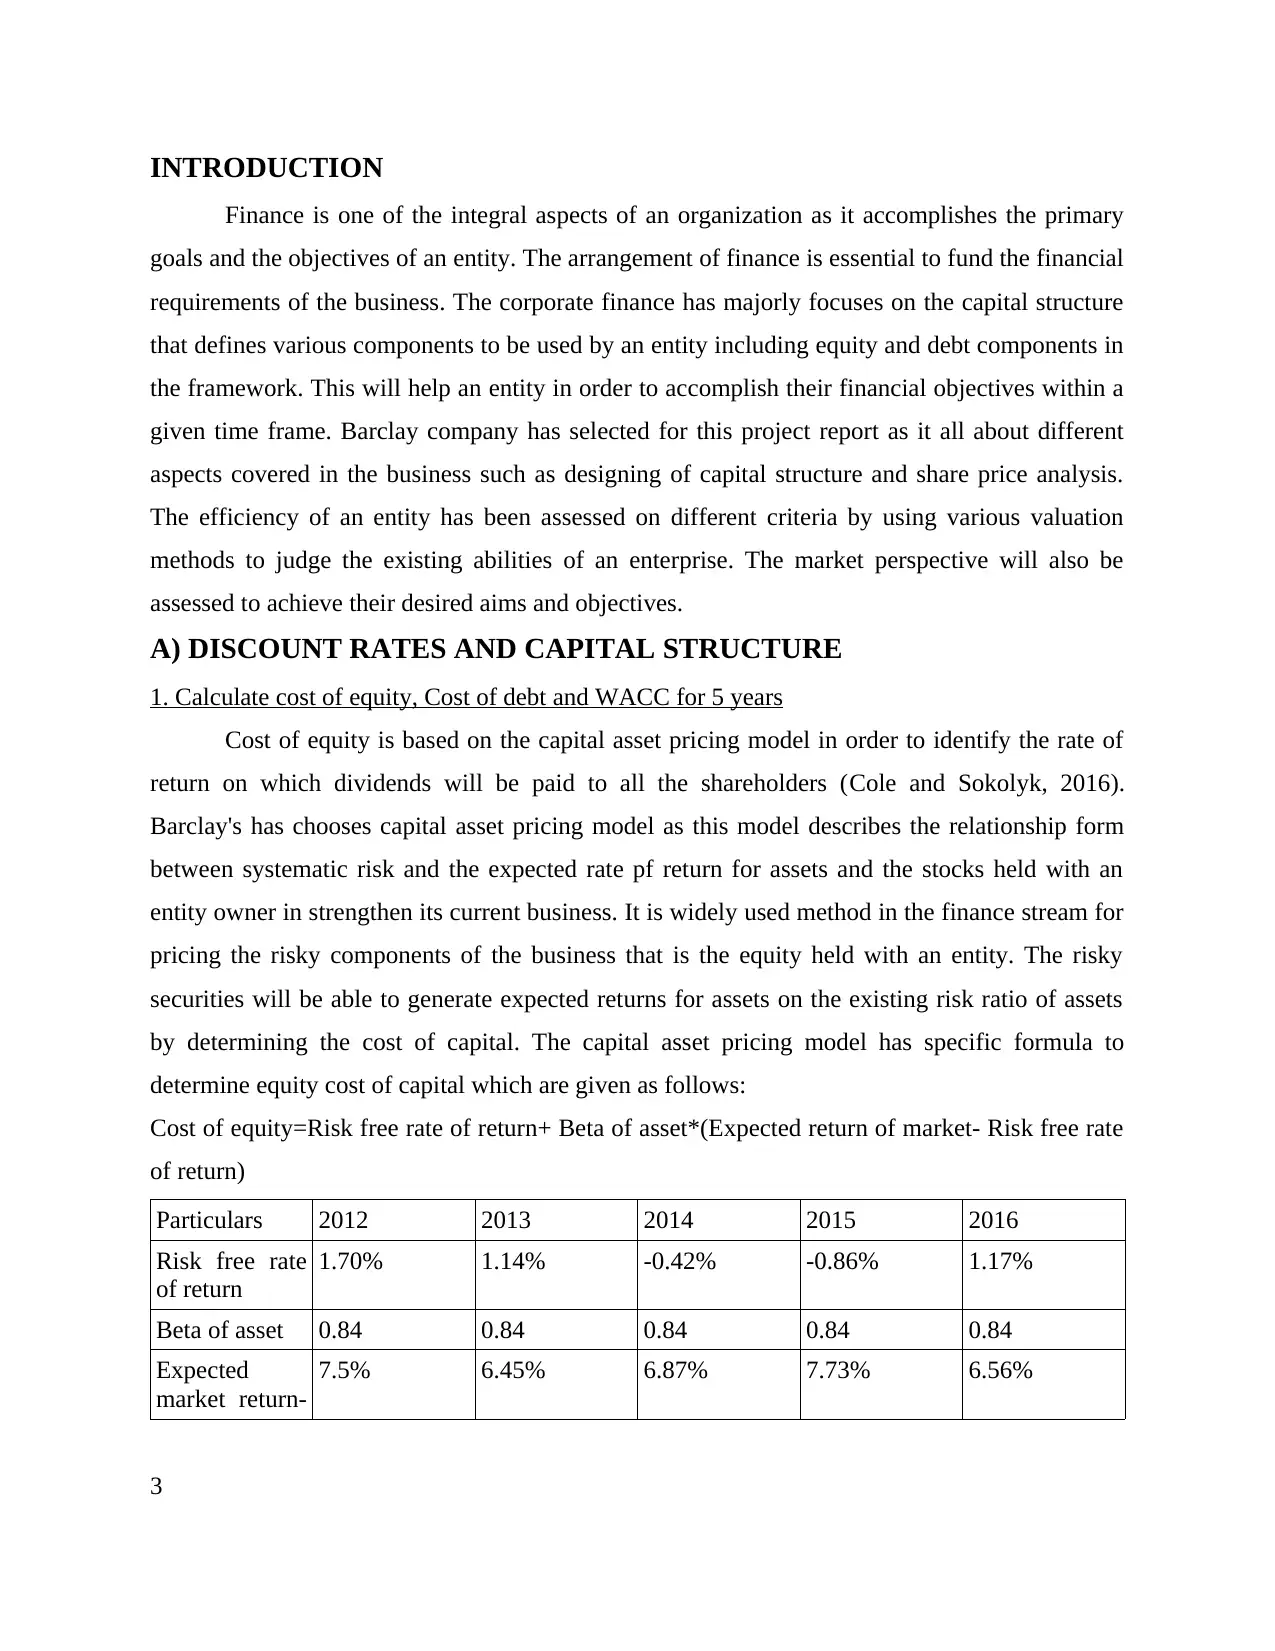
A) DISCOUNT RATES AND CAPITAL STRUCTURE
1. Calculate cost of equity, Cost of debt and WACC for 5 years
Cost of equity is based on the capital asset pricing model in order to identify the rate of
return on which dividends will be paid to all the shareholders (Cole and Sokolyk, 2016).
Barclay's has chooses capital asset pricing model as this model describes the relationship form
between systematic risk and the expected rate pf return for assets and the stocks held with an
entity owner in strengthen its current business. It is widely used method in the finance stream for
pricing the risky components of the business that is the equity held with an entity. The risky
securities will be able to generate expected returns for assets on the existing risk ratio of assets
by determining the cost of capital. The capital asset pricing model has specific formula to
determine equity cost of capital which are given as follows:
Cost of equity=Risk free rate of return+ Beta of asset*(Expected return of market- Risk free rate
of return)
Particulars 2012 2013 2014 2015 2016
Risk free rate
of return
1.70% 1.14% -0.42% -0.86% 1.17%
Beta of asset 0.84 0.84 0.84 0.84 0.84
Expected
market return-
7.5% 6.45% 6.87% 7.73% 6.56%
3
Finance is one of the integral aspects of an organization as it accomplishes the primary
goals and the objectives of an entity. The arrangement of finance is essential to fund the financial
requirements of the business. The corporate finance has majorly focuses on the capital structure
that defines various components to be used by an entity including equity and debt components in
the framework. This will help an entity in order to accomplish their financial objectives within a
given time frame. Barclay company has selected for this project report as it all about different
aspects covered in the business such as designing of capital structure and share price analysis.
The efficiency of an entity has been assessed on different criteria by using various valuation
methods to judge the existing abilities of an enterprise. The market perspective will also be
assessed to achieve their desired aims and objectives.
A) DISCOUNT RATES AND CAPITAL STRUCTURE
1. Calculate cost of equity, Cost of debt and WACC for 5 years
Cost of equity is based on the capital asset pricing model in order to identify the rate of
return on which dividends will be paid to all the shareholders (Cole and Sokolyk, 2016).
Barclay's has chooses capital asset pricing model as this model describes the relationship form
between systematic risk and the expected rate pf return for assets and the stocks held with an
entity owner in strengthen its current business. It is widely used method in the finance stream for
pricing the risky components of the business that is the equity held with an entity. The risky
securities will be able to generate expected returns for assets on the existing risk ratio of assets
by determining the cost of capital. The capital asset pricing model has specific formula to
determine equity cost of capital which are given as follows:
Cost of equity=Risk free rate of return+ Beta of asset*(Expected return of market- Risk free rate
of return)
Particulars 2012 2013 2014 2015 2016
Risk free rate
of return
1.70% 1.14% -0.42% -0.86% 1.17%
Beta of asset 0.84 0.84 0.84 0.84 0.84
Expected
market return-
7.5% 6.45% 6.87% 7.73% 6.56%
3
⊘ This is a preview!⊘
Do you want full access?
Subscribe today to unlock all pages.
Trusted by 1+ million students worldwide
Risk free rate
of return
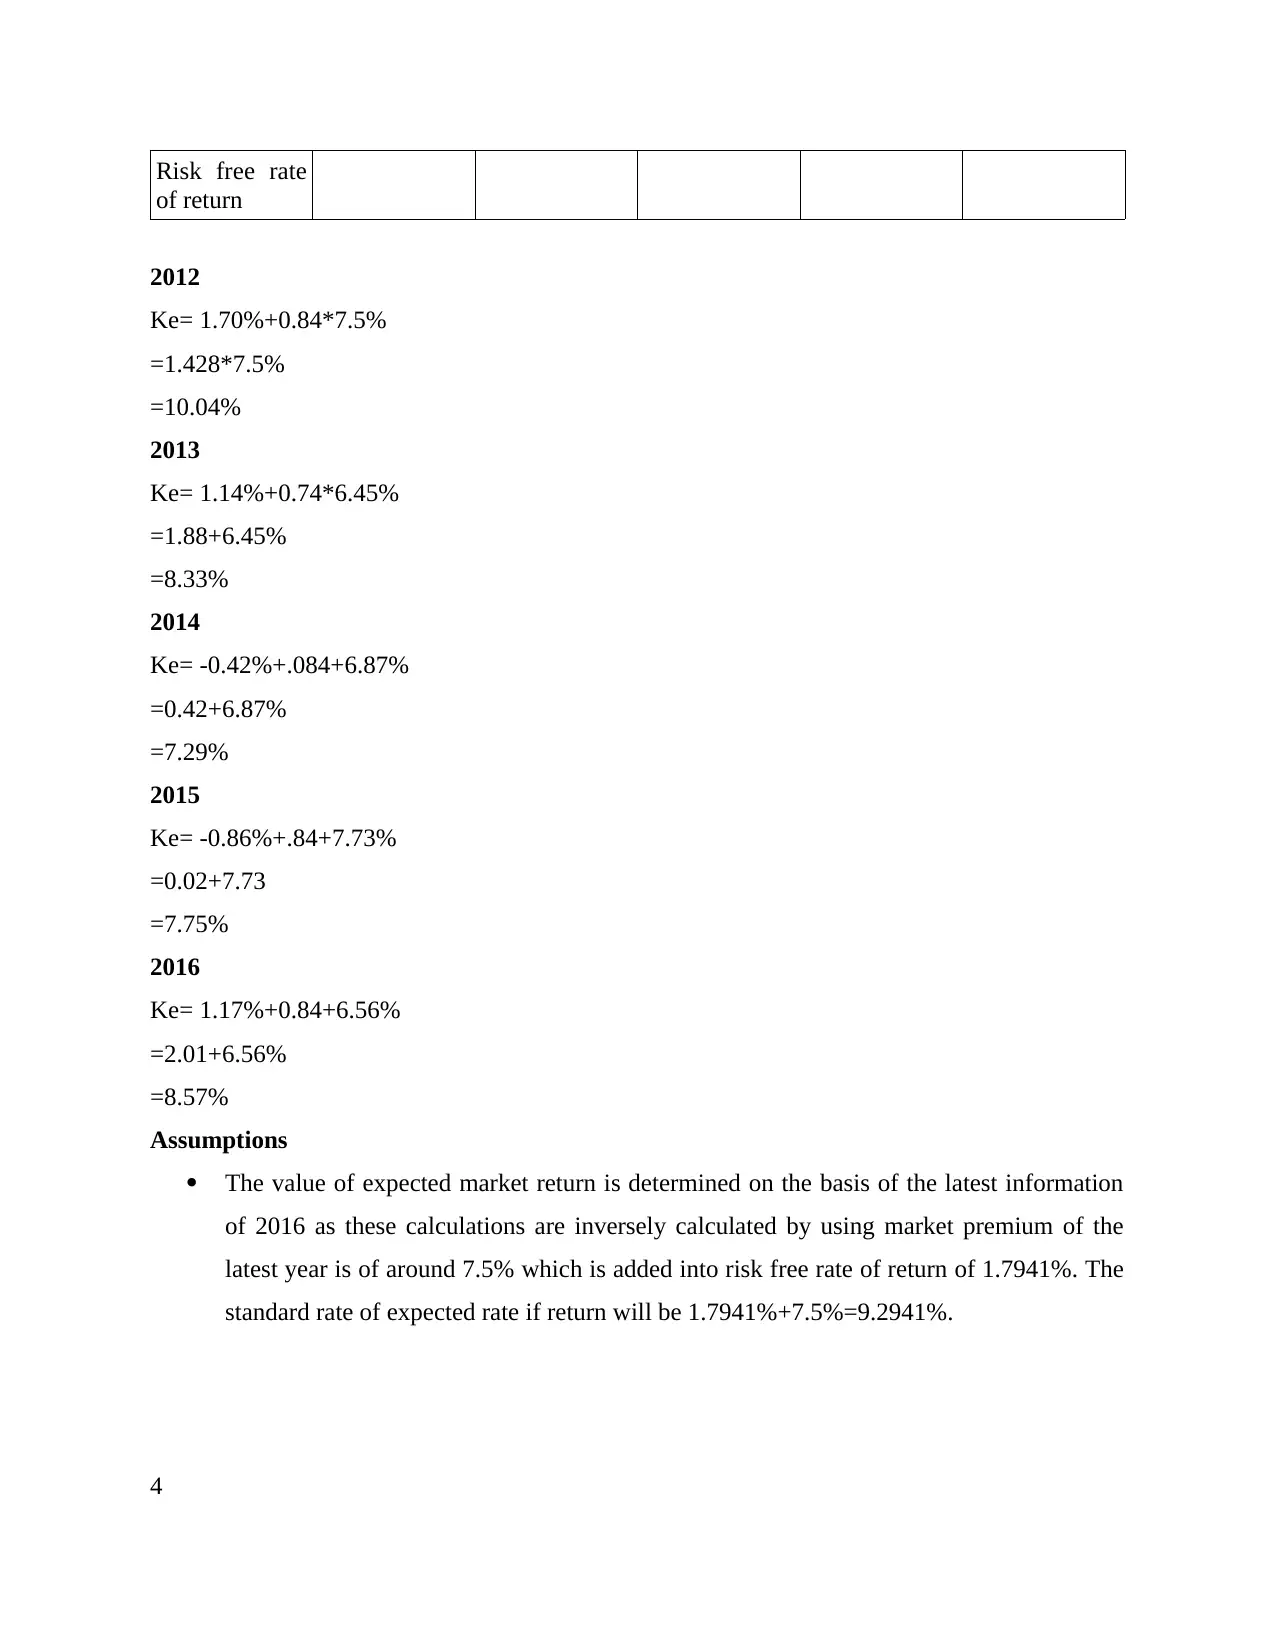
2012
Ke= 1.70%+0.84*7.5%
=1.428*7.5%
=10.04%
2013
Ke= 1.14%+0.74*6.45%
=1.88+6.45%
=8.33%
2014
Ke= -0.42%+.084+6.87%
=0.42+6.87%
=7.29%
2015
Ke= -0.86%+.84+7.73%
=0.02+7.73
=7.75%
2016
Ke= 1.17%+0.84+6.56%
=2.01+6.56%
=8.57%
Assumptions
The value of expected market return is determined on the basis of the latest information
of 2016 as these calculations are inversely calculated by using market premium of the
latest year is of around 7.5% which is added into risk free rate of return of 1.7941%. The
standard rate of expected rate if return will be 1.7941%+7.5%=9.2941%.
4
of return
2012
Ke= 1.70%+0.84*7.5%
=1.428*7.5%
=10.04%
2013
Ke= 1.14%+0.74*6.45%
=1.88+6.45%
=8.33%
2014
Ke= -0.42%+.084+6.87%
=0.42+6.87%
=7.29%
2015
Ke= -0.86%+.84+7.73%
=0.02+7.73
=7.75%
2016
Ke= 1.17%+0.84+6.56%
=2.01+6.56%
=8.57%
Assumptions
The value of expected market return is determined on the basis of the latest information
of 2016 as these calculations are inversely calculated by using market premium of the
latest year is of around 7.5% which is added into risk free rate of return of 1.7941%. The
standard rate of expected rate if return will be 1.7941%+7.5%=9.2941%.
4
Paraphrase This Document
Need a fresh take? Get an instant paraphrase of this document with our AI Paraphraser
The beta of the asset will be based on the latest information from the annual report which
is 0.84 as this value is based on 10 year treasury bonds regarded as one of the asset in the
business. The value assumed to be same for all the years.
The risk free rate of return has decreases from one period to another period and this
information has taken from the annual reports of the Barclay's company. The current rate
of return is based on the Hedge fund prices index which is considered as rate of return.
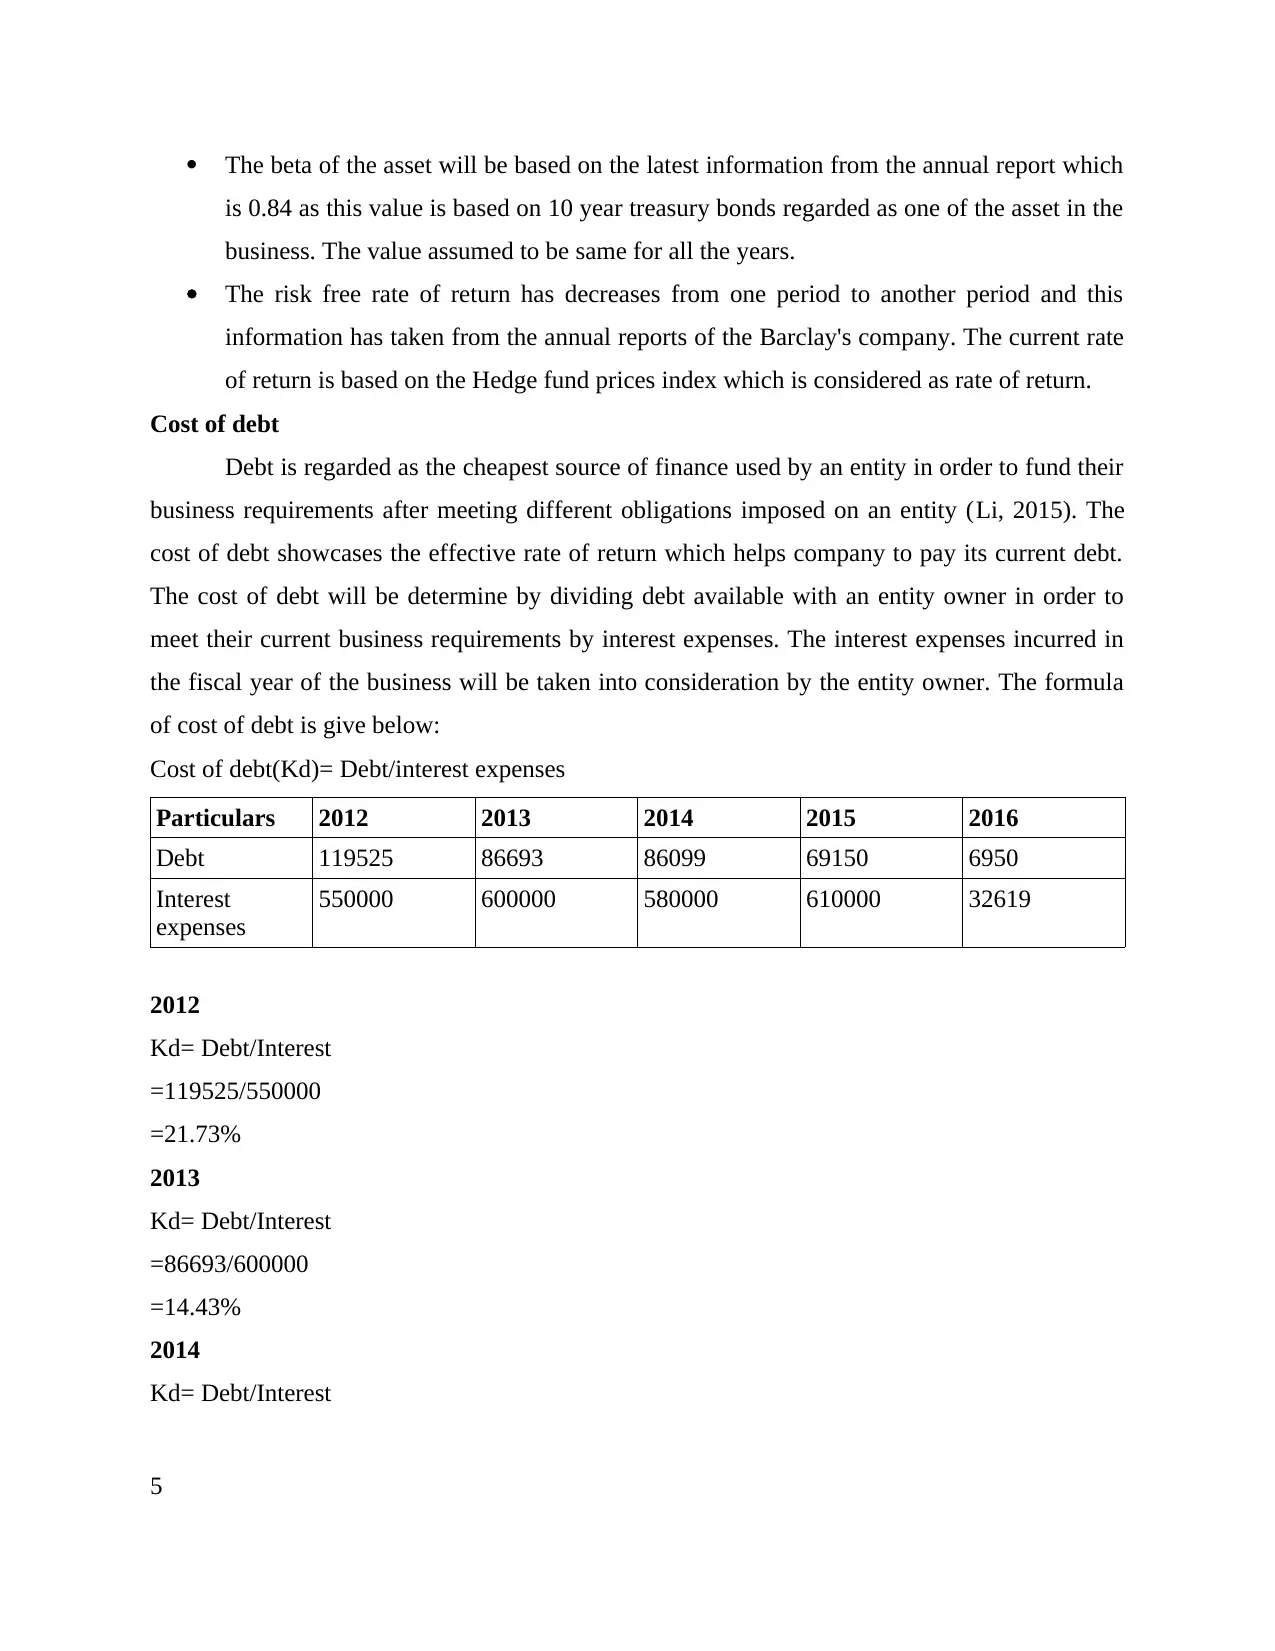
Cost of debt
Debt is regarded as the cheapest source of finance used by an entity in order to fund their
business requirements after meeting different obligations imposed on an entity (Li, 2015). The
cost of debt showcases the effective rate of return which helps company to pay its current debt.
The cost of debt will be determine by dividing debt available with an entity owner in order to
meet their current business requirements by interest expenses. The interest expenses incurred in
the fiscal year of the business will be taken into consideration by the entity owner. The formula
of cost of debt is give below:
Cost of debt(Kd)= Debt/interest expenses
Particulars 2012 2013 2014 2015 2016
Debt 119525 86693 86099 69150 6950
Interest
expenses
550000 600000 580000 610000 32619
2012
Kd= Debt/Interest
=119525/550000
=21.73%
2013
Kd= Debt/Interest
=86693/600000
=14.43%
2014
Kd= Debt/Interest
5
is 0.84 as this value is based on 10 year treasury bonds regarded as one of the asset in the
business. The value assumed to be same for all the years.
The risk free rate of return has decreases from one period to another period and this
information has taken from the annual reports of the Barclay's company. The current rate
of return is based on the Hedge fund prices index which is considered as rate of return.
Cost of debt
Debt is regarded as the cheapest source of finance used by an entity in order to fund their
business requirements after meeting different obligations imposed on an entity (Li, 2015). The
cost of debt showcases the effective rate of return which helps company to pay its current debt.
The cost of debt will be determine by dividing debt available with an entity owner in order to
meet their current business requirements by interest expenses. The interest expenses incurred in
the fiscal year of the business will be taken into consideration by the entity owner. The formula
of cost of debt is give below:
Cost of debt(Kd)= Debt/interest expenses
Particulars 2012 2013 2014 2015 2016
Debt 119525 86693 86099 69150 6950
Interest
expenses
550000 600000 580000 610000 32619
2012
Kd= Debt/Interest
=119525/550000
=21.73%
2013
Kd= Debt/Interest
=86693/600000
=14.43%
2014
Kd= Debt/Interest
5
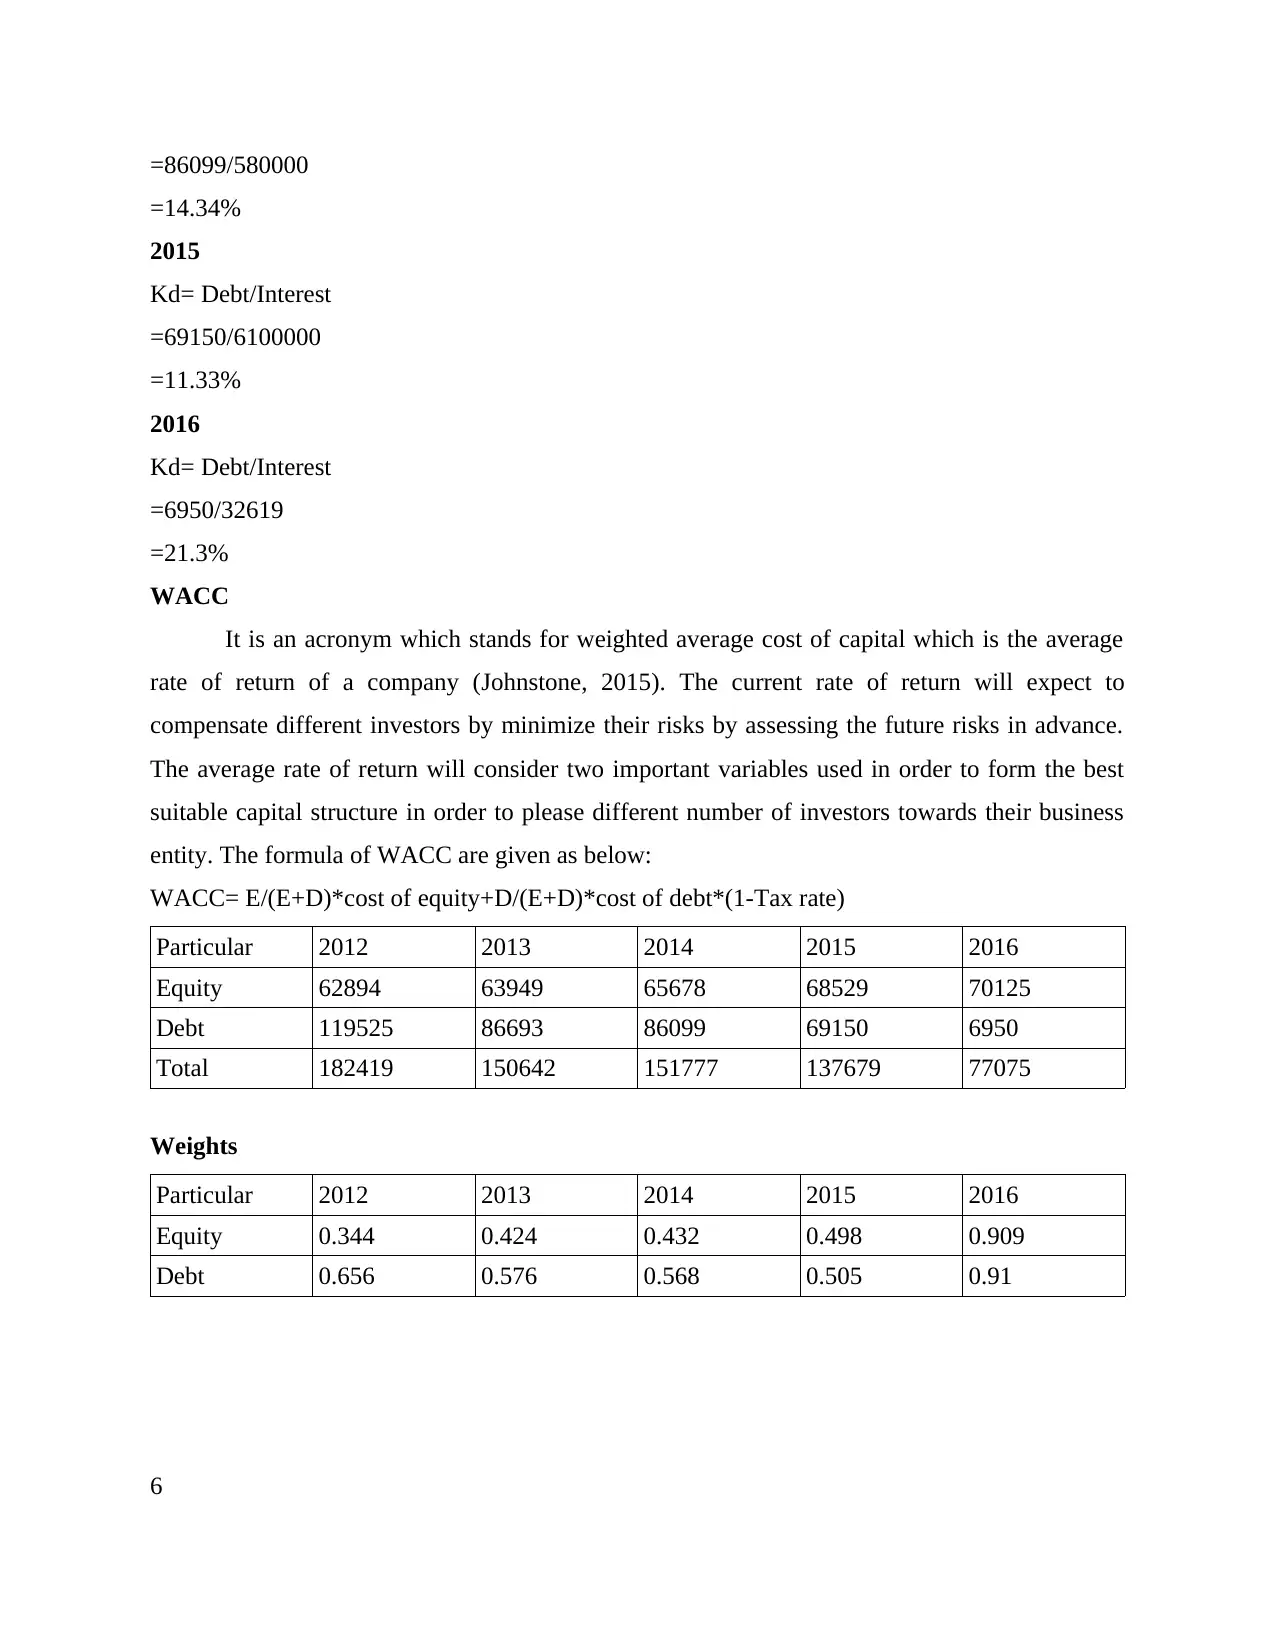
=86099/580000
=14.34%
2015
Kd= Debt/Interest
=69150/6100000
=11.33%
2016
Kd= Debt/Interest
=6950/32619
=21.3%
WACC
It is an acronym which stands for weighted average cost of capital which is the average
rate of return of a company (Johnstone, 2015). The current rate of return will expect to
compensate different investors by minimize their risks by assessing the future risks in advance.
The average rate of return will consider two important variables used in order to form the best
suitable capital structure in order to please different number of investors towards their business
entity. The formula of WACC are given as below:
WACC= E/(E+D)*cost of equity+D/(E+D)*cost of debt*(1-Tax rate)
Particular 2012 2013 2014 2015 2016
Equity 62894 63949 65678 68529 70125
Debt 119525 86693 86099 69150 6950
Total 182419 150642 151777 137679 77075
Weights
Particular 2012 2013 2014 2015 2016
Equity 0.344 0.424 0.432 0.498 0.909
Debt 0.656 0.576 0.568 0.505 0.91
6
⊘ This is a preview!⊘
Do you want full access?
Subscribe today to unlock all pages.
Trusted by 1+ million students worldwide
Partic
ular
201
2 Cost
WA
CC
201
3 cost
WA
CC
201
4 Cost
WA
CC
201
5 Cost
WA
CC 2016 Cost
WAC
C
Equit
y
0.3
44
0.10
04
0.03
453
76
0.42
4
0.08
33
0.03
531
92
0.43
2
0.07
29
0.03
149
28
0.49
8
0.07
75
0.03
859
5 0.909 0.0857
0.0779
013
Debt
0.6
56
0.21
73
0.14
254
88
0.57
6
0.14
43
0.08
311
68
0.56
8
0.14
34
0.08
145
12
0.50
5
0.11
33
0.05
721
65 0.91 0.213
0.1938
3
Total
WAC
C
0.17
708
64
0.11
843
6
0.11
294
4
0.09
581
15
0.2717
313
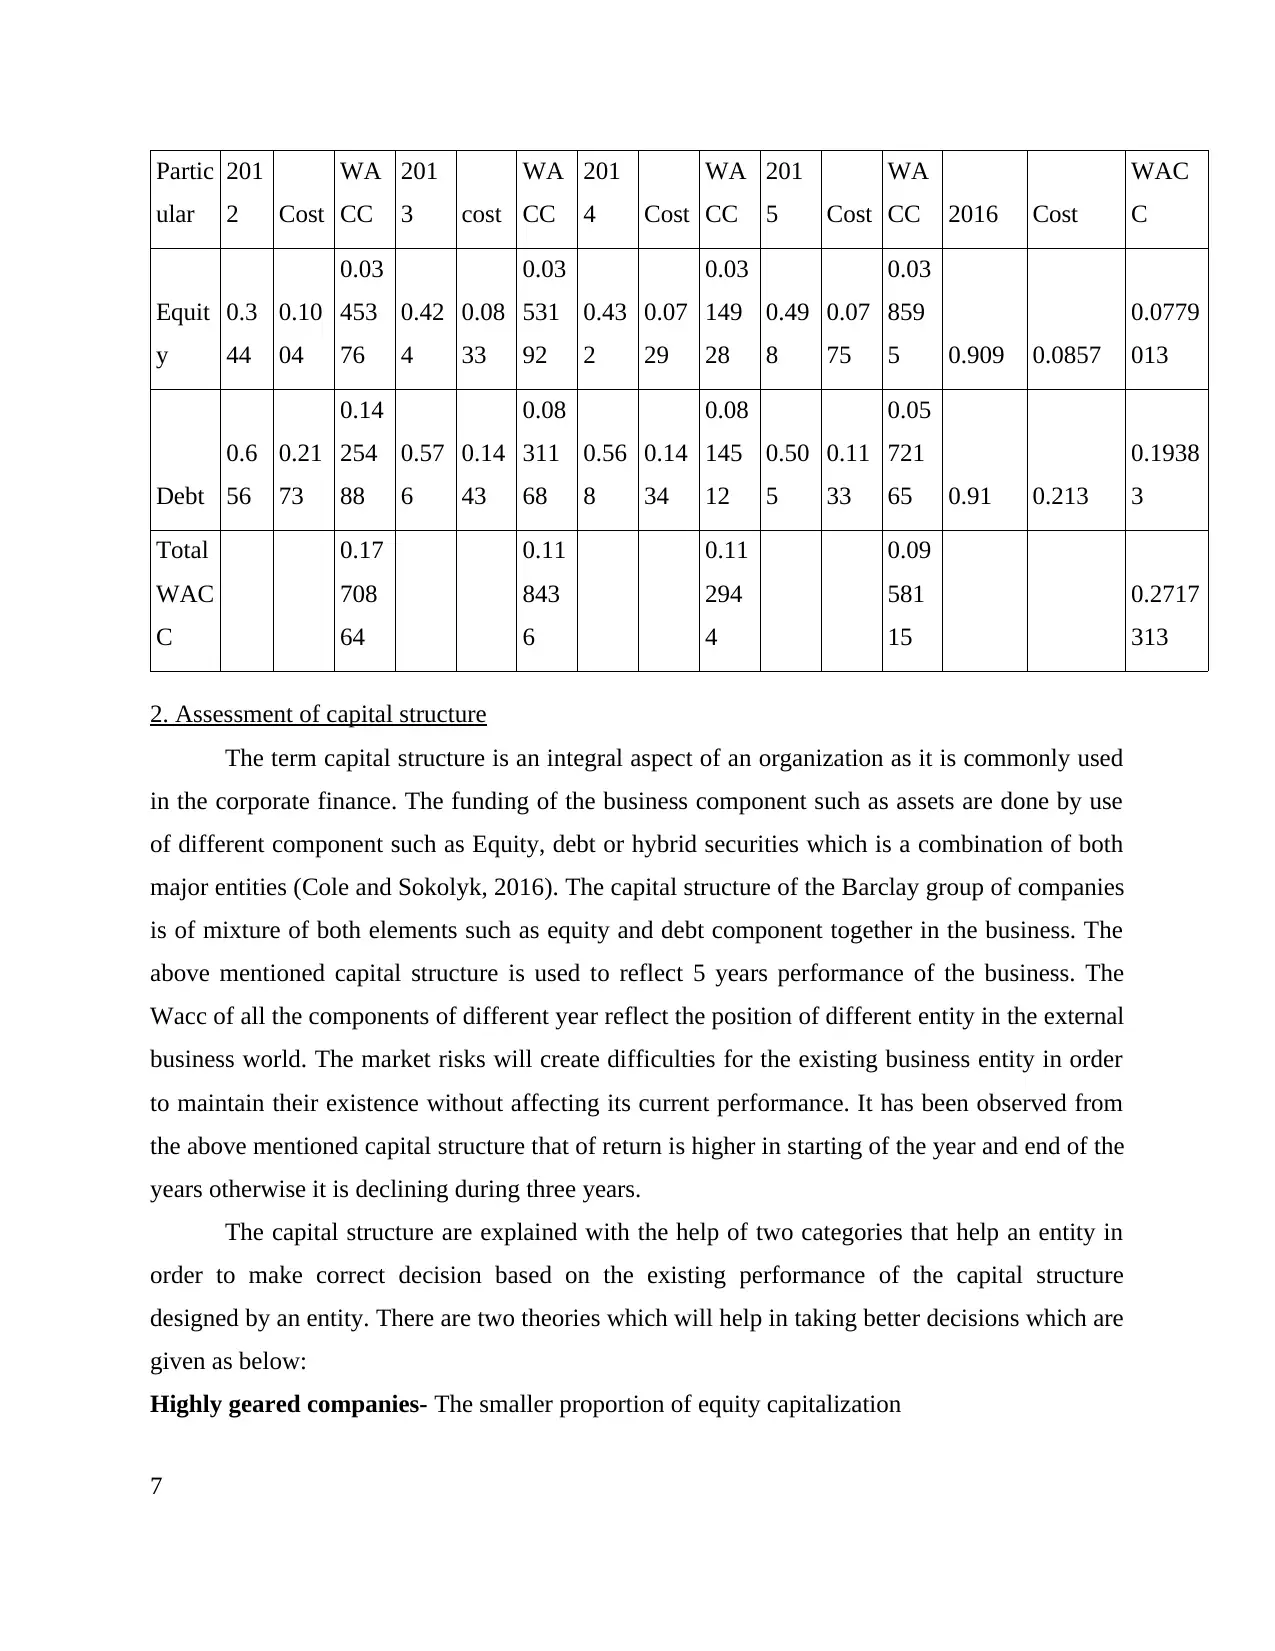
2. Assessment of capital structure
The term capital structure is an integral aspect of an organization as it is commonly used
in the corporate finance. The funding of the business component such as assets are done by use
of different component such as Equity, debt or hybrid securities which is a combination of both
major entities (Cole and Sokolyk, 2016). The capital structure of the Barclay group of companies
is of mixture of both elements such as equity and debt component together in the business. The
above mentioned capital structure is used to reflect 5 years performance of the business. The
Wacc of all the components of different year reflect the position of different entity in the external
business world. The market risks will create difficulties for the existing business entity in order
to maintain their existence without affecting its current performance. It has been observed from
the above mentioned capital structure that of return is higher in starting of the year and end of the
years otherwise it is declining during three years.
The capital structure are explained with the help of two categories that help an entity in
order to make correct decision based on the existing performance of the capital structure
designed by an entity. There are two theories which will help in taking better decisions which are
given as below:
Highly geared companies- The smaller proportion of equity capitalization
7
ular
201
2 Cost
WA
CC
201
3 cost
WA
CC
201
4 Cost
WA
CC
201
5 Cost
WA
CC 2016 Cost
WAC
C
Equit
y
0.3
44
0.10
04
0.03
453
76
0.42
4
0.08
33
0.03
531
92
0.43
2
0.07
29
0.03
149
28
0.49
8
0.07
75
0.03
859
5 0.909 0.0857
0.0779
013
Debt
0.6
56
0.21
73
0.14
254
88
0.57
6
0.14
43
0.08
311
68
0.56
8
0.14
34
0.08
145
12
0.50
5
0.11
33
0.05
721
65 0.91 0.213
0.1938
3
Total
WAC
C
0.17
708
64
0.11
843
6
0.11
294
4
0.09
581
15
0.2717
313
2. Assessment of capital structure
The term capital structure is an integral aspect of an organization as it is commonly used
in the corporate finance. The funding of the business component such as assets are done by use
of different component such as Equity, debt or hybrid securities which is a combination of both
major entities (Cole and Sokolyk, 2016). The capital structure of the Barclay group of companies
is of mixture of both elements such as equity and debt component together in the business. The
above mentioned capital structure is used to reflect 5 years performance of the business. The
Wacc of all the components of different year reflect the position of different entity in the external
business world. The market risks will create difficulties for the existing business entity in order
to maintain their existence without affecting its current performance. It has been observed from
the above mentioned capital structure that of return is higher in starting of the year and end of the
years otherwise it is declining during three years.
The capital structure are explained with the help of two categories that help an entity in
order to make correct decision based on the existing performance of the capital structure
designed by an entity. There are two theories which will help in taking better decisions which are
given as below:
Highly geared companies- The smaller proportion of equity capitalization
7
Paraphrase This Document
Need a fresh take? Get an instant paraphrase of this document with our AI Paraphraser
Low geared companies- The equity held with an entity will dominate the total capitalization
The current business will lie in the high geared market as in this case the equity is less than the
total debt used by this business entity in order to design their overall capital structure.
There are various factors which helps in determine the current capital structure in relation to the
existing performance of the business:
Trading on equity- This method will help in assessing the existing capabilities of the firm by
using their own equity in the business (Li, 2015). The owner used their own equity in the current
business in order to earn higher interest in relation to the burden of debt held on the business.
Market condition- The existing conditions of the market are properly assessed in relation to the
different criteria which will help an entity in order to make good business decisions. The
inflation and boosting in the market will be considered before investing in a particular business.
Choice of investors- The selection of appropriate investors for investing in the best suitable
business by considering adequate investment component that will generate good results.
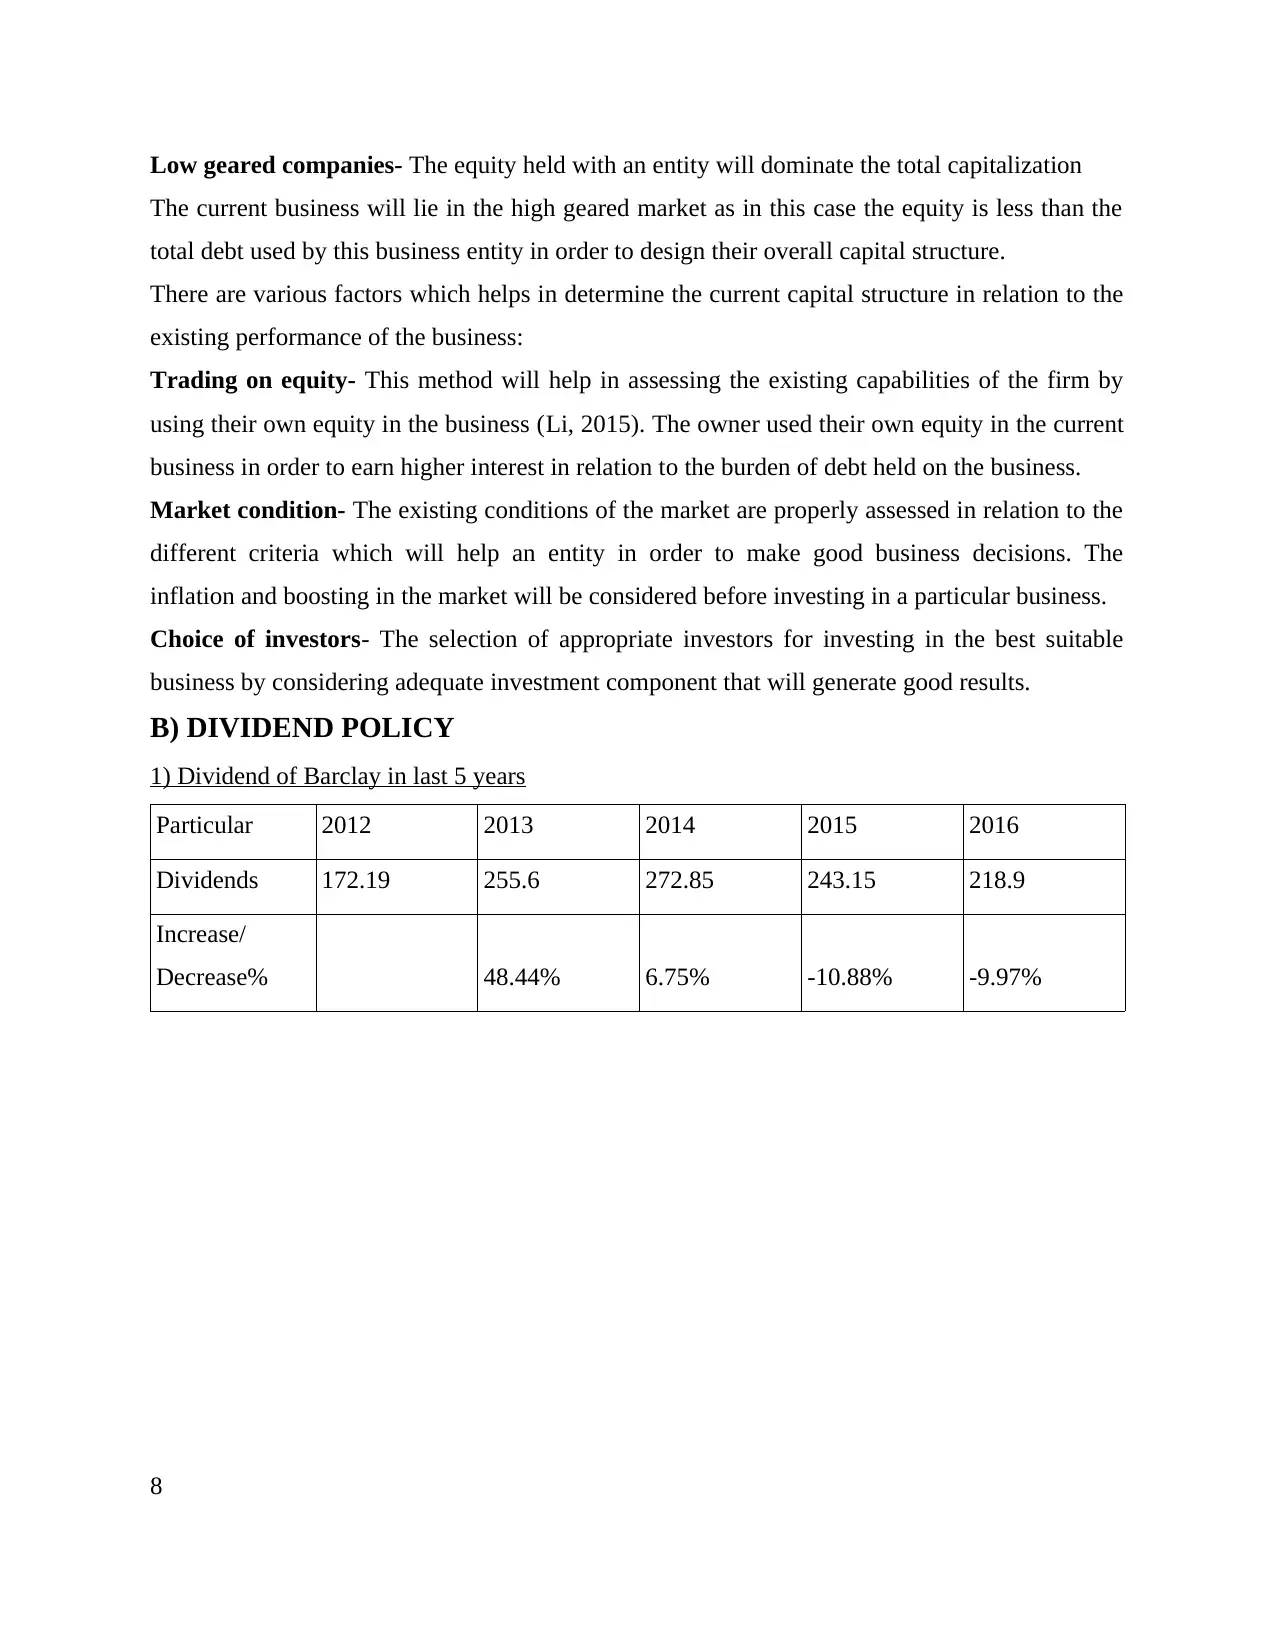
B) DIVIDEND POLICY
1) Dividend of Barclay in last 5 years
Particular 2012 2013 2014 2015 2016
Dividends 172.19 255.6 272.85 243.15 218.9
Increase/
Decrease% 48.44% 6.75% -10.88% -9.97%
8
The current business will lie in the high geared market as in this case the equity is less than the
total debt used by this business entity in order to design their overall capital structure.
There are various factors which helps in determine the current capital structure in relation to the
existing performance of the business:
Trading on equity- This method will help in assessing the existing capabilities of the firm by
using their own equity in the business (Li, 2015). The owner used their own equity in the current
business in order to earn higher interest in relation to the burden of debt held on the business.
Market condition- The existing conditions of the market are properly assessed in relation to the
different criteria which will help an entity in order to make good business decisions. The
inflation and boosting in the market will be considered before investing in a particular business.
Choice of investors- The selection of appropriate investors for investing in the best suitable
business by considering adequate investment component that will generate good results.
B) DIVIDEND POLICY
1) Dividend of Barclay in last 5 years
Particular 2012 2013 2014 2015 2016
Dividends 172.19 255.6 272.85 243.15 218.9
Increase/
Decrease% 48.44% 6.75% -10.88% -9.97%
8
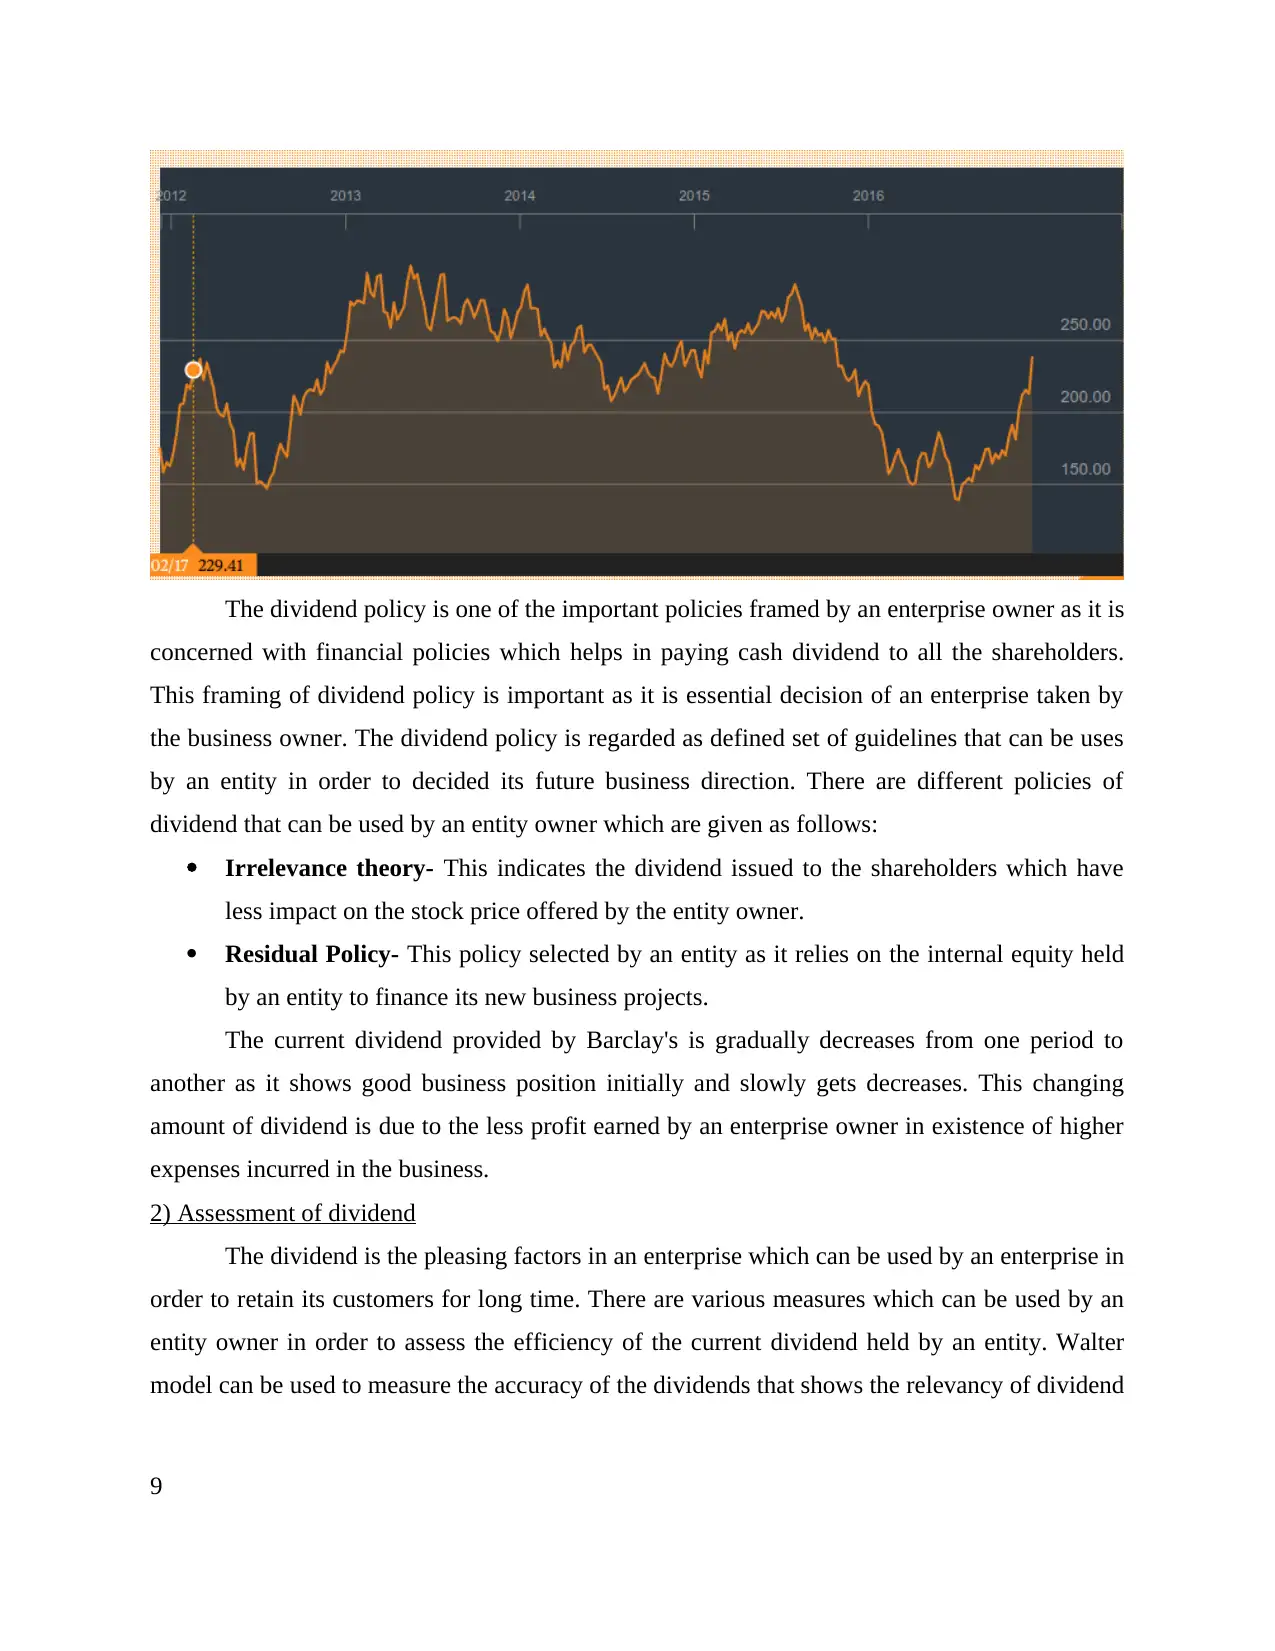
The dividend policy is one of the important policies framed by an enterprise owner as it is
concerned with financial policies which helps in paying cash dividend to all the shareholders.
This framing of dividend policy is important as it is essential decision of an enterprise taken by
the business owner. The dividend policy is regarded as defined set of guidelines that can be uses
by an entity in order to decided its future business direction. There are different policies of
dividend that can be used by an entity owner which are given as follows:
Irrelevance theory- This indicates the dividend issued to the shareholders which have
less impact on the stock price offered by the entity owner.
Residual Policy- This policy selected by an entity as it relies on the internal equity held
by an entity to finance its new business projects.
The current dividend provided by Barclay's is gradually decreases from one period to
another as it shows good business position initially and slowly gets decreases. This changing
amount of dividend is due to the less profit earned by an enterprise owner in existence of higher
expenses incurred in the business.
2) Assessment of dividend
The dividend is the pleasing factors in an enterprise which can be used by an enterprise in
order to retain its customers for long time. There are various measures which can be used by an
entity owner in order to assess the efficiency of the current dividend held by an entity. Walter
model can be used to measure the accuracy of the dividends that shows the relevancy of dividend
9
⊘ This is a preview!⊘
Do you want full access?
Subscribe today to unlock all pages.
Trusted by 1+ million students worldwide
policy along with the value of share offered to various shareholders. The current models run on
different assumptions such as retained earnings by using internal source of finance as it restricts
the entry of external finance (Cole and Sokolyk, 2016). The cost of capital and rate of return will
remain constant through the evaluation process and the life of the firm will be take as endlessly.
Another model used in assessing the value of dividend paid to all the shareholders through model
description. In this particular model the dividends are paid to the shareholders will be re-invested
by shareholders in order to earn higher dividends currently paid to them. The decision based on
this process is based on three different criteria such as rate is higher than the cost of capital, rate
is less than the cost of equity and both the variables get equal. The decision rate is less than the
cost of equity then there is zero payout and making higher amount of investment. The rate of
return is less than cost of equity then there will be 100% payout and no investment of the
retained earnings. The equal of the two variable will be able to produce indifferent values of both
dividends and the investments.
The above model description will apply by Barclay's in order to payout their dividend in a
significant ratio which helps in boosting their existing capabilities.
3) Analyze the consistency of dividends
The dividend policy follower by this enterprise is Residual dividend policy in which
internal business capabilities are used in order to fund their business projects. The selection of
this particular policy will increase its cope of the retained earning or the equity held withing the
business entity to reduce their overall debt components (Abroud, 2015). The dividends paid by
an entity to its various kinds of shareholders over the years are consistently decreases from one
period to another. The performance of the business has declined from its previous figures which
shows the deficiency of an entity to handle the external pressure on their own business.
C) VALUATION
Static valuation methods
Price earning ratio
Particulars 2012 2013 2014 2015 2016
Stock per
share 2.26 2.72 2.41 2.34 4.58
EPS -0.19 0.14 -0.03 -0.07 0.1
PE ratio -11.89 19.42 -80.33 -33.42 45.8
10
Paraphrase This Document
Need a fresh take? Get an instant paraphrase of this document with our AI Paraphraser
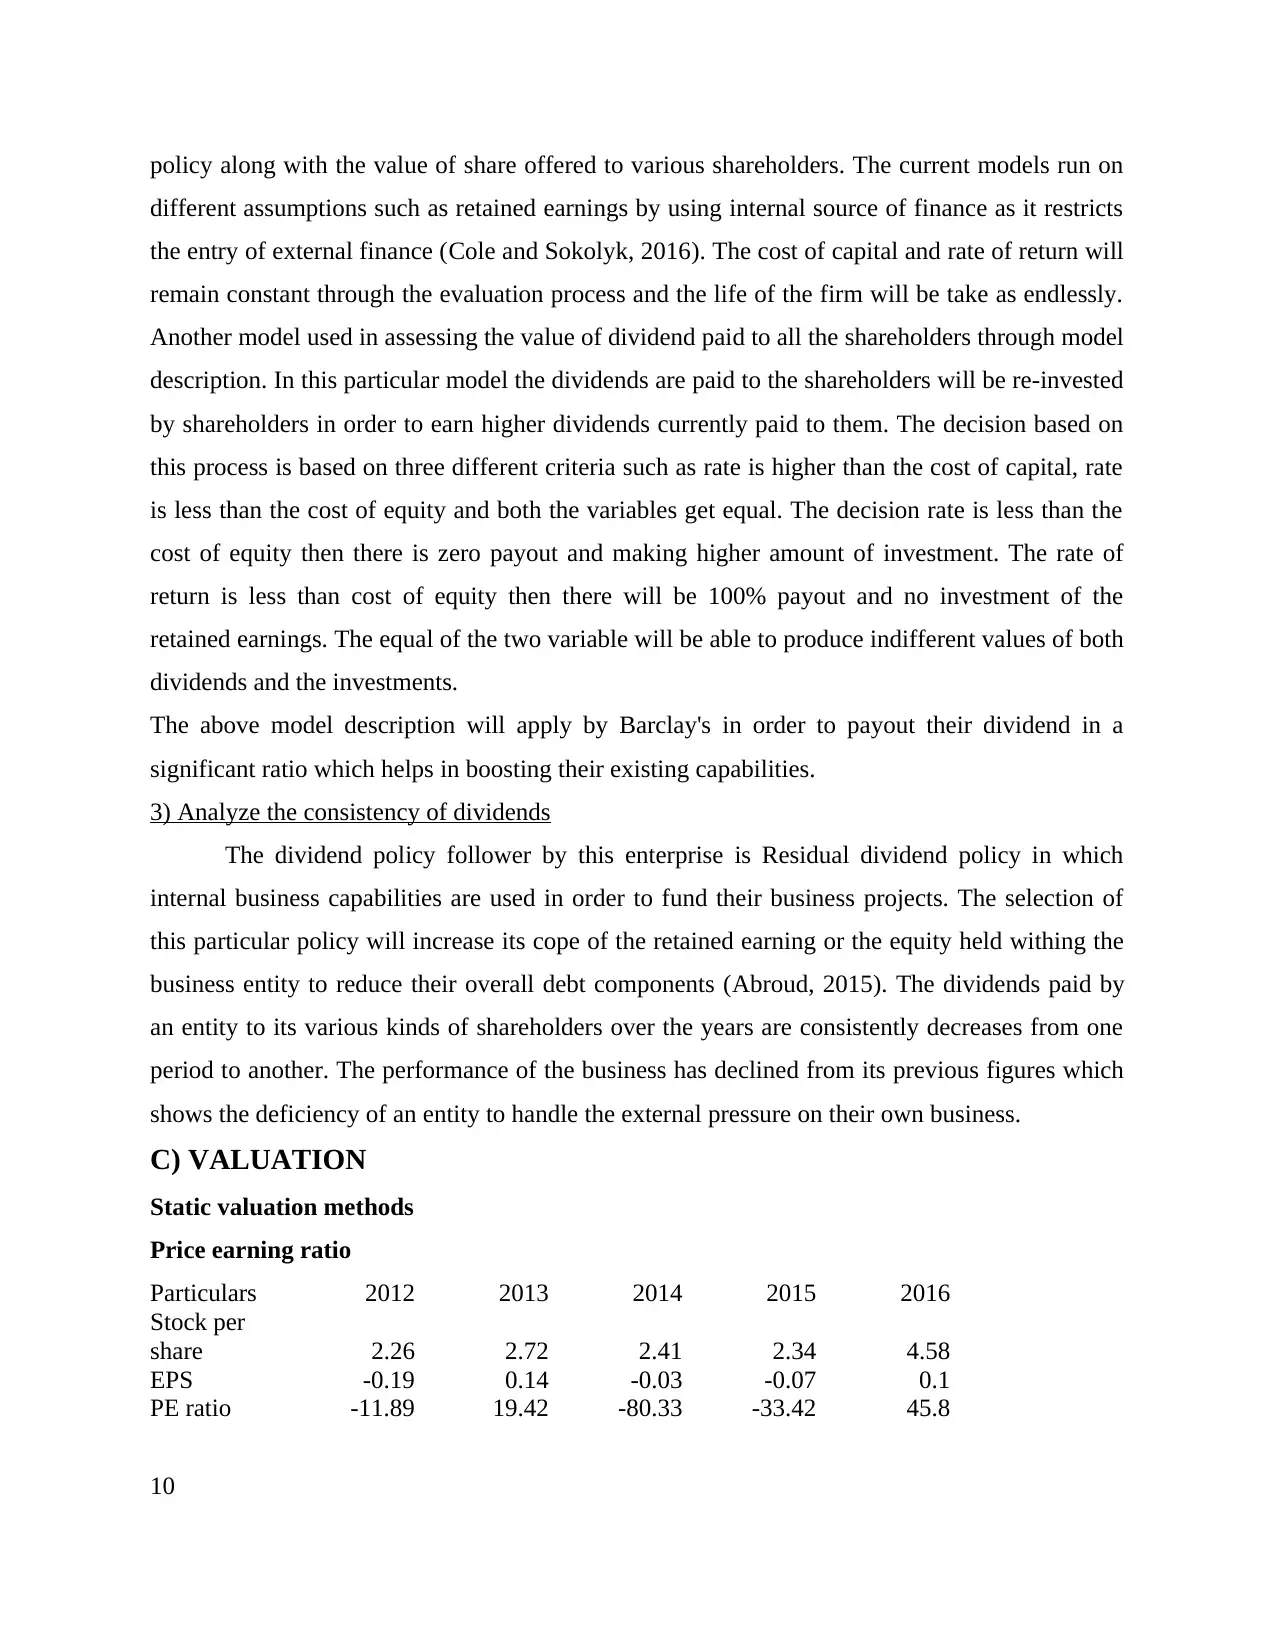
The price earning ratio is regarded as one of the important investment valuation approach
that indicates an entity's performance. The internal business efficiency need to be considered by
an entity owner as this will consider the stock price offered to please different forms of
shareholders towards their organization (Li, 2015). This stock per share will be divided by
Earning per share in order to assess the efficiency of the business.
It has been observed from the above price earning ratio which is the ability of an
enterprise by reflecting their per share earning. This ratio will help an entity in order to assess its
future returns along with the risks of expenses faced by this firm. The price earning ratio is
decreasing over the period by showing negative figures but in 2016 it shows positive and higher
values from all the previous years.
Dividend yield
Particulars 2012 2013 2014 2015 2016
Dividend
per share 172.19 255.6 272.85 243.15 218.9
Stock per
share 2.26 2.72 2.41 2.34 4.58
Dividend
yield 76.19 93.97 113.21 103.91 47.794
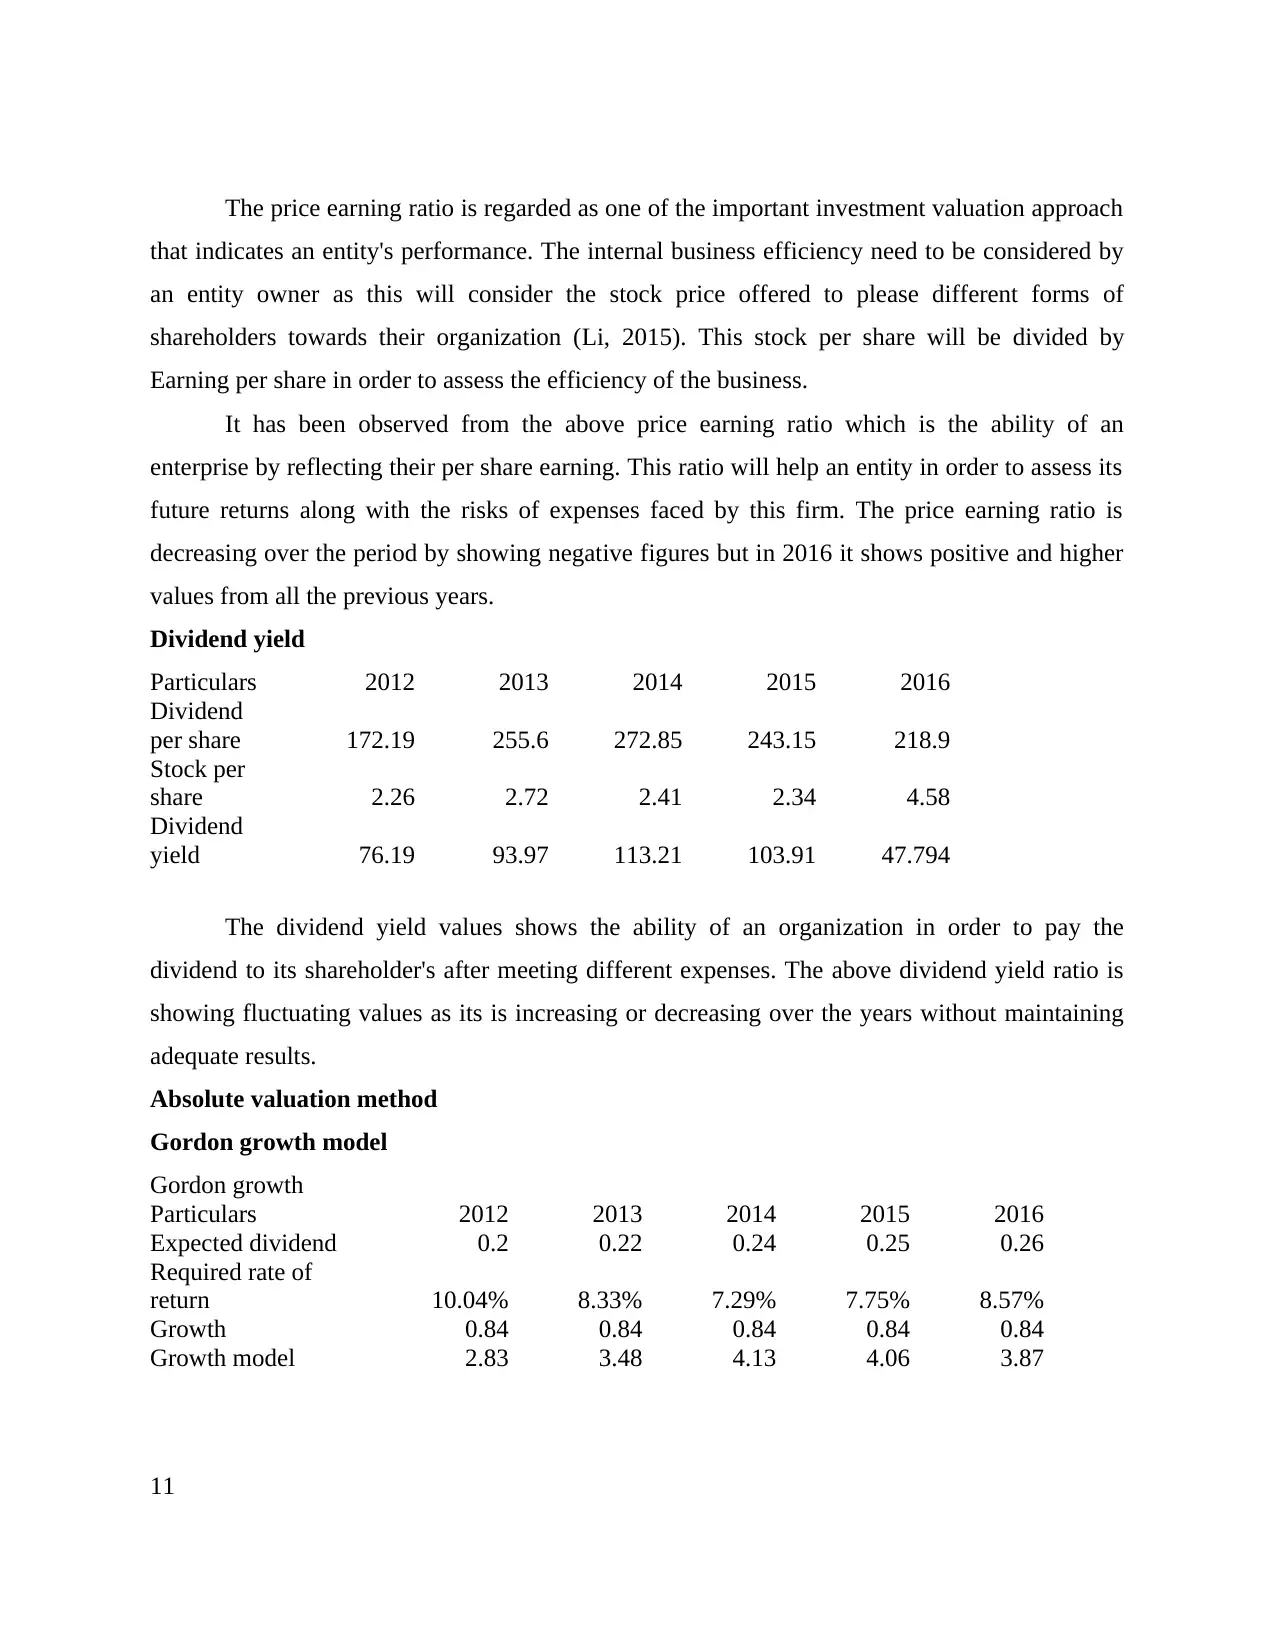
The dividend yield values shows the ability of an organization in order to pay the
dividend to its shareholder's after meeting different expenses. The above dividend yield ratio is
showing fluctuating values as its is increasing or decreasing over the years without maintaining
adequate results.
Absolute valuation method
Gordon growth model
Gordon growth
Particulars 2012 2013 2014 2015 2016
Expected dividend 0.2 0.22 0.24 0.25 0.26
Required rate of
return 10.04% 8.33% 7.29% 7.75% 8.57%
Growth 0.84 0.84 0.84 0.84 0.84
Growth model 2.83 3.48 4.13 4.06 3.87
11
that indicates an entity's performance. The internal business efficiency need to be considered by
an entity owner as this will consider the stock price offered to please different forms of
shareholders towards their organization (Li, 2015). This stock per share will be divided by
Earning per share in order to assess the efficiency of the business.
It has been observed from the above price earning ratio which is the ability of an
enterprise by reflecting their per share earning. This ratio will help an entity in order to assess its
future returns along with the risks of expenses faced by this firm. The price earning ratio is
decreasing over the period by showing negative figures but in 2016 it shows positive and higher
values from all the previous years.
Dividend yield
Particulars 2012 2013 2014 2015 2016
Dividend
per share 172.19 255.6 272.85 243.15 218.9
Stock per
share 2.26 2.72 2.41 2.34 4.58
Dividend
yield 76.19 93.97 113.21 103.91 47.794
The dividend yield values shows the ability of an organization in order to pay the
dividend to its shareholder's after meeting different expenses. The above dividend yield ratio is
showing fluctuating values as its is increasing or decreasing over the years without maintaining
adequate results.
Absolute valuation method
Gordon growth model
Gordon growth
Particulars 2012 2013 2014 2015 2016
Expected dividend 0.2 0.22 0.24 0.25 0.26
Required rate of
return 10.04% 8.33% 7.29% 7.75% 8.57%
Growth 0.84 0.84 0.84 0.84 0.84
Growth model 2.83 3.48 4.13 4.06 3.87
11
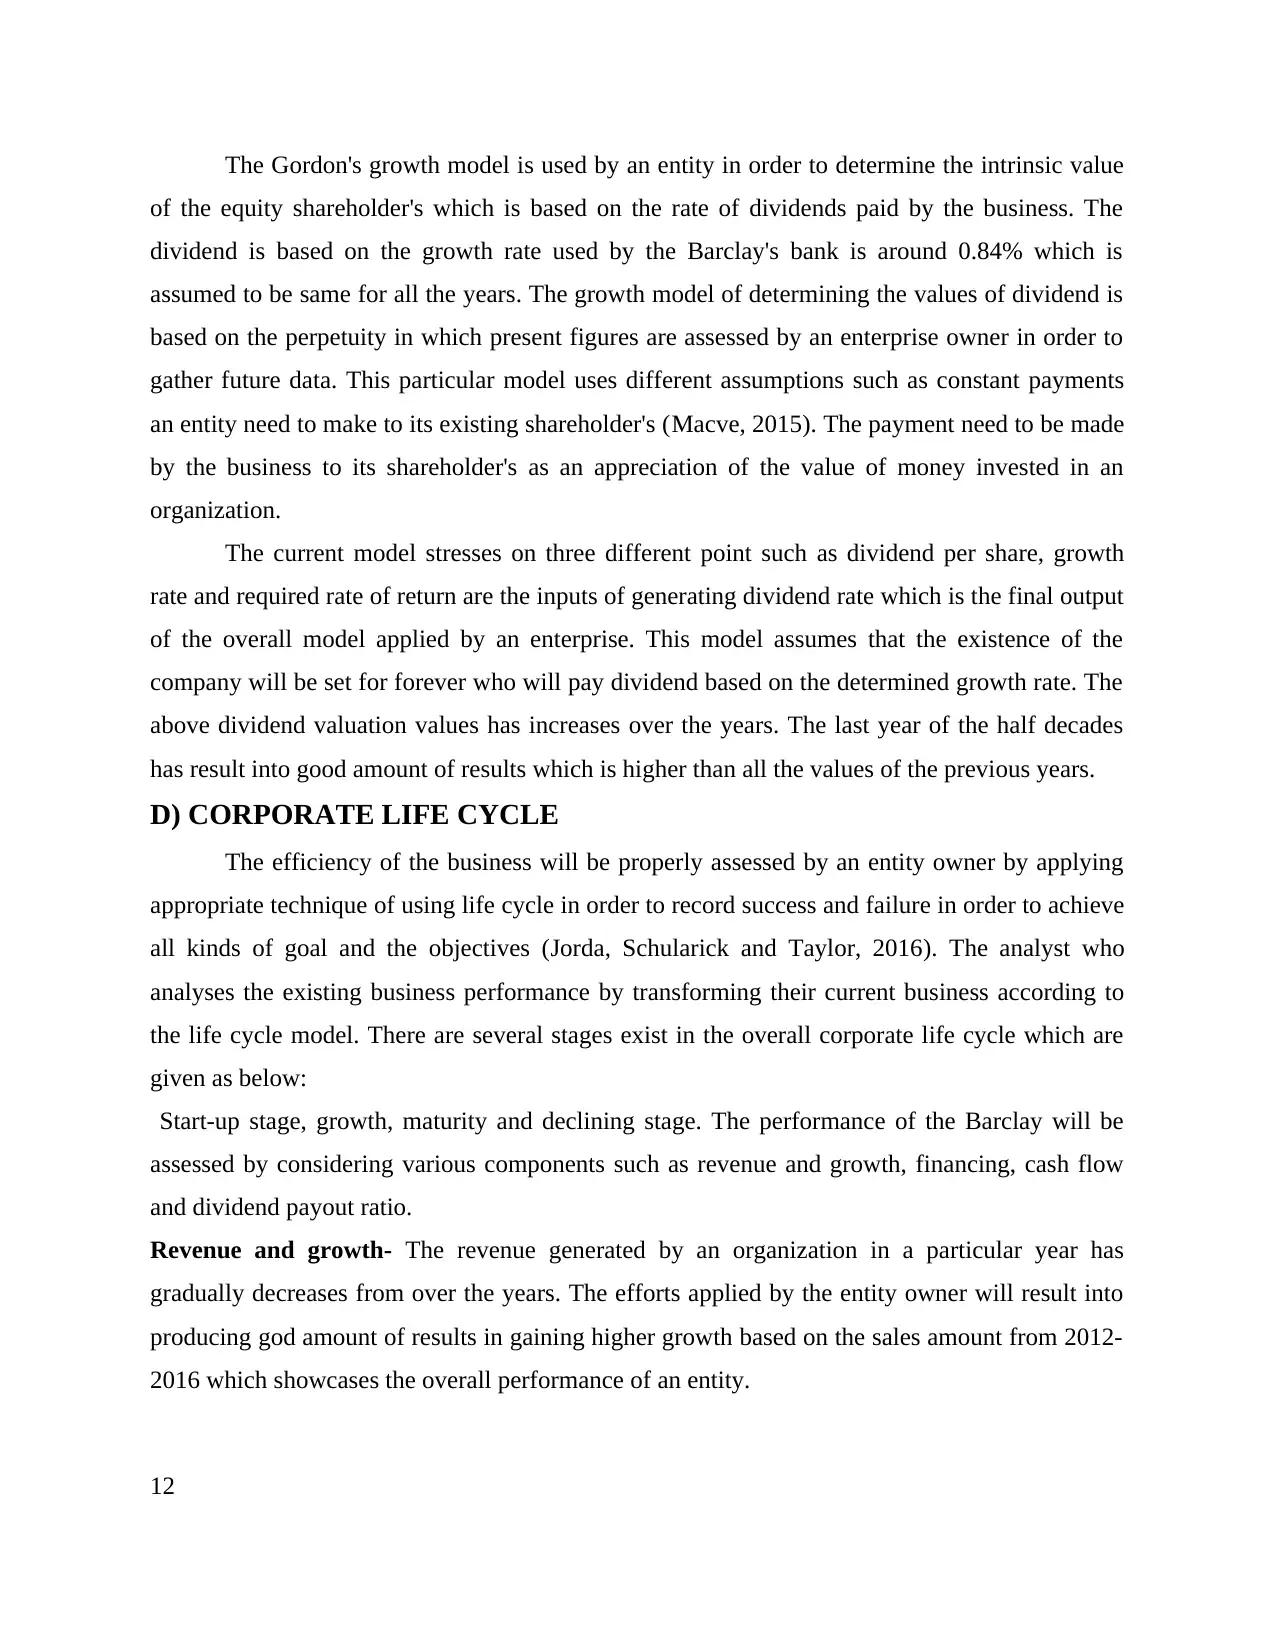
The Gordon's growth model is used by an entity in order to determine the intrinsic value
of the equity shareholder's which is based on the rate of dividends paid by the business. The
dividend is based on the growth rate used by the Barclay's bank is around 0.84% which is
assumed to be same for all the years. The growth model of determining the values of dividend is
based on the perpetuity in which present figures are assessed by an enterprise owner in order to
gather future data. This particular model uses different assumptions such as constant payments
an entity need to make to its existing shareholder's (Macve, 2015). The payment need to be made
by the business to its shareholder's as an appreciation of the value of money invested in an
organization.
The current model stresses on three different point such as dividend per share, growth
rate and required rate of return are the inputs of generating dividend rate which is the final output
of the overall model applied by an enterprise. This model assumes that the existence of the
company will be set for forever who will pay dividend based on the determined growth rate. The
above dividend valuation values has increases over the years. The last year of the half decades
has result into good amount of results which is higher than all the values of the previous years.
D) CORPORATE LIFE CYCLE
The efficiency of the business will be properly assessed by an entity owner by applying
appropriate technique of using life cycle in order to record success and failure in order to achieve
all kinds of goal and the objectives (Jorda, Schularick and Taylor, 2016). The analyst who
analyses the existing business performance by transforming their current business according to
the life cycle model. There are several stages exist in the overall corporate life cycle which are
given as below:
Start-up stage, growth, maturity and declining stage. The performance of the Barclay will be
assessed by considering various components such as revenue and growth, financing, cash flow
and dividend payout ratio.
Revenue and growth- The revenue generated by an organization in a particular year has
gradually decreases from over the years. The efforts applied by the entity owner will result into
producing god amount of results in gaining higher growth based on the sales amount from 2012-
2016 which showcases the overall performance of an entity.
12
⊘ This is a preview!⊘
Do you want full access?
Subscribe today to unlock all pages.
Trusted by 1+ million students worldwide
1 out of 16
Related Documents


Your All-in-One AI-Powered Toolkit for Academic Success.
+13062052269
info@desklib.com
Available 24*7 on WhatsApp / Email
![[object Object]](/_next/static/media/star-bottom.7253800d.svg)
Unlock your academic potential
Copyright © 2020–2026 A2Z Services. All Rights Reserved. Developed and managed by ZUCOL.