Financial Analysis of Barclays: Data Handling and Decision Making
VerifiedAdded on 2021/01/03
|30
|5483
|457
Report
AI Summary
This report provides a detailed analysis of Barclays' financial performance, focusing on data handling and decision-making processes. It begins with an introduction to data handling techniques and their importance in financial analysis. The report then outlines the specific decision Barclays needs to make, which involves assessing the impact of operational performance on shareholder equity. The analysis utilizes financial data from Barclays' annual reports over a five-year period, including interest income, interest expense, net interest income, non-interest income, net operating income, and shareholder's equity. The report includes a discussion of the data mining procedures, data preparation, cleaning, and filtering processes. Descriptive data analysis is used to observe business performance, with correlations examined between net interest income, non-interest income, and stockholder's equity. The findings reveal a negative relationship between net interest income and shareholder equity, as well as a strong negative correlation between non-interest revenue and stockholder's equity. The report concludes with recommendations based on the analysis and provides references for further study. This report highlights the importance of data-driven decision-making in financial analysis and its impact on shareholder value.

DATA HANDLING AND
DECISION MAKING
DECISION MAKING
Paraphrase This Document
Need a fresh take? Get an instant paraphrase of this document with our AI Paraphraser
TABLE OF CONTENTS
INTRODUCTION...........................................................................................................................1
QUESTION .....................................................................................................................................1
Statement of specific decision Barclays required to make..........................................................1
Descripting of relevant information used for analysis.................................................................4
a. Discussion of information related to business with representation of dataset.........................4
b. Obtaining of dataset with appropriate explanation..................................................................5
c. Importance of this statement in decision making process of business entity...........................5
Analysing the data mining procedures from data set...................................................................6
Data preparation, cleaning and filtering.......................................................................................6
Implicating the descriptive data analysis effective for immediate observation for business
performance.................................................................................................................................6
Developing organisational forecasting report............................................................................25
Visualisation and interpretation of outcomes............................................................................26
Decision making recommendations...........................................................................................26
CONCLUSION..............................................................................................................................26
REFERENCES..............................................................................................................................27
INTRODUCTION
Data handling is the techniques of collecting the data and managing it in the books of accounts which will be adequate and
effective with respect to make appropriate analysis over firm’s performance. To implicate the reformative changes in the operations of
Barclays which reflect in potential growth of this banking industry. The company have been operating in UK with facilitating the
internal banking services which is comprised of various activities such as Corporate banking, personal banking, investment
management and wealth management. In the present assessment there will be determination of the facts which are affecting the growth
of industry. The analysis will be based on analysing impacts of profitability on the amount of funds derived through shareholders.
Thus, the profitability of this banking industry will affect the number of investors in each period. It will be consisting influences of
statistical tools to analyse the relationship between variables.
QUESTION
Statement of specific decision Barclays required to make
The operational performance of Barclays Plc analysed through measuring the consequences which affects the number of
shareholders to the organisation. To analyse such variations there will be collection of reliable information which have been gathered
from past 5 year’s performance of the organisation. The data is gathered through annual reports of the company. Income statement and
balance sheets are some major sources for gathering information regarding firm's financial performance of the company. It is
consisting of profits as well as revenue derived from operations. Along with this, there will be collection of details relevant with the
number of shareholder’s to be collected to analyse the information. The net income of organization contributes significant aspect for
identifying shareholder's equity. The net income is calculated by considering its revenues for specified duration and excluded the cost
of goods sold. The COGS consider all expenses which are used for operating business like payroll, advertising, rent, taxes and
equipment. In the similar aspect, shareholder's equity is liabilities which are excluded from its business assets as it is listed on
organization's balance sheet. It contributes to assets of company and impact the book value or shareholder's equity. If profit is
generated and with retention of portion of margin after excluding each cost where equity of owner generally increases. On the contrary
1
⊘ This is a preview!⊘
Do you want full access?
Subscribe today to unlock all pages.
Trusted by 1+ million students worldwide
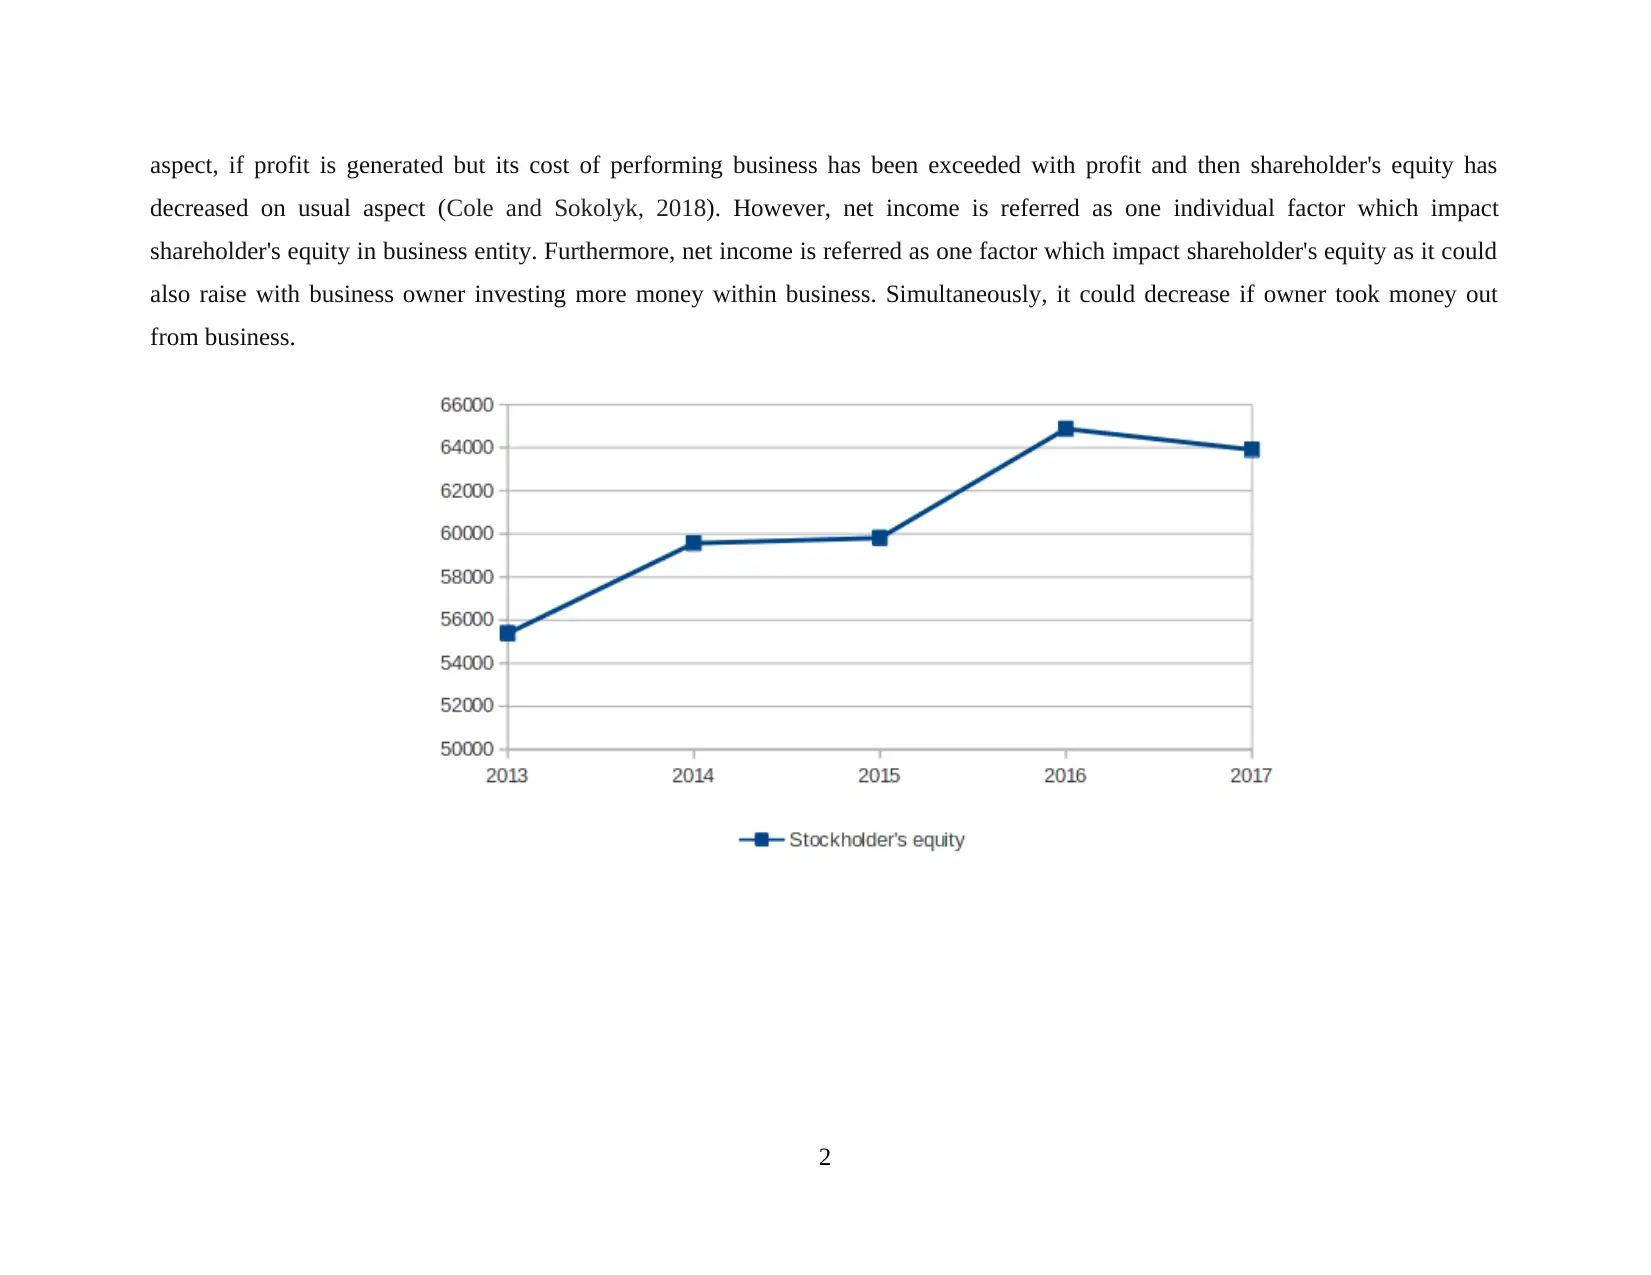
aspect, if profit is generated but its cost of performing business has been exceeded with profit and then shareholder's equity has
decreased on usual aspect (Cole and Sokolyk, 2018). However, net income is referred as one individual factor which impact
shareholder's equity in business entity. Furthermore, net income is referred as one factor which impact shareholder's equity as it could
also raise with business owner investing more money within business. Simultaneously, it could decrease if owner took money out
from business.
2
Paraphrase This Document
Need a fresh take? Get an instant paraphrase of this document with our AI Paraphraser
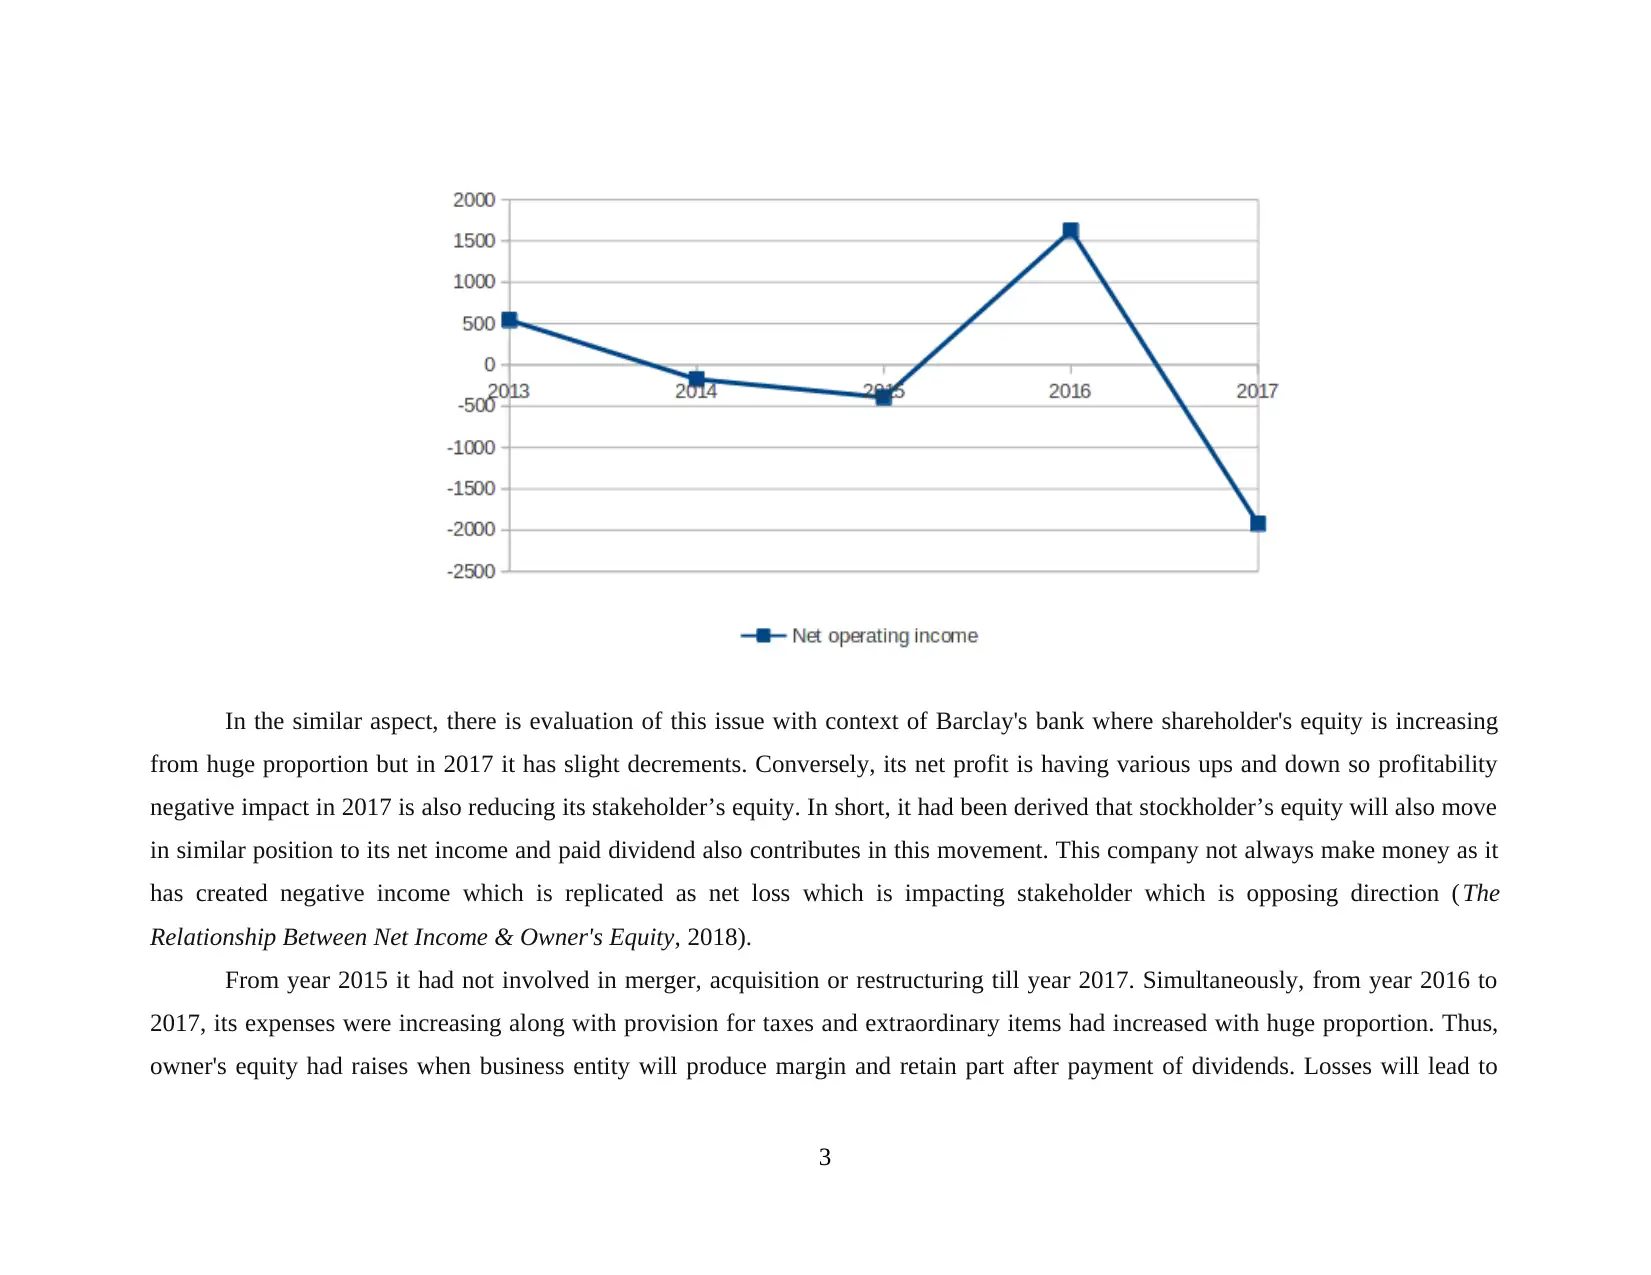
In the similar aspect, there is evaluation of this issue with context of Barclay's bank where shareholder's equity is increasing
from huge proportion but in 2017 it has slight decrements. Conversely, its net profit is having various ups and down so profitability
negative impact in 2017 is also reducing its stakeholder’s equity. In short, it had been derived that stockholder’s equity will also move
in similar position to its net income and paid dividend also contributes in this movement. This company not always make money as it
has created negative income which is replicated as net loss which is impacting stakeholder which is opposing direction ( The
Relationship Between Net Income & Owner's Equity, 2018).
From year 2015 it had not involved in merger, acquisition or restructuring till year 2017. Simultaneously, from year 2016 to
2017, its expenses were increasing along with provision for taxes and extraordinary items had increased with huge proportion. Thus,
owner's equity had raises when business entity will produce margin and retain part after payment of dividends. Losses will lead to
3
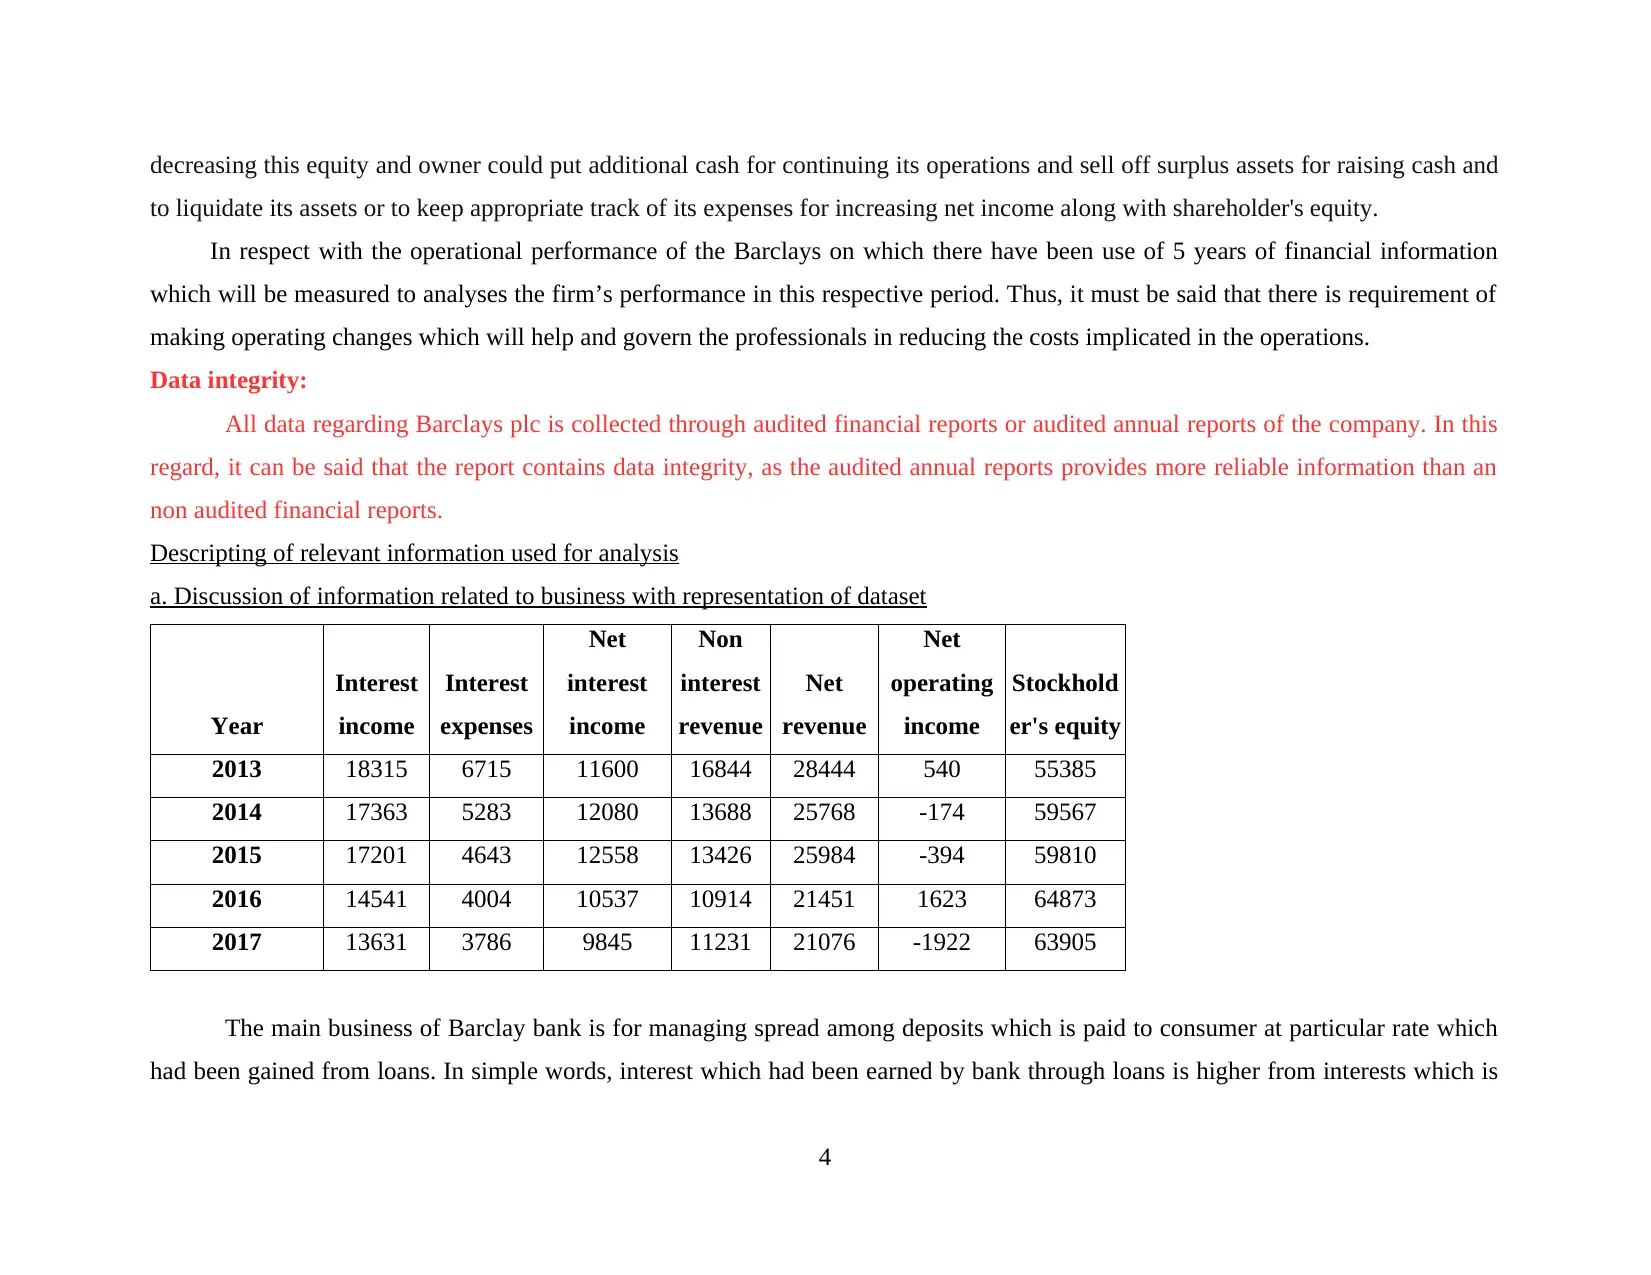
decreasing this equity and owner could put additional cash for continuing its operations and sell off surplus assets for raising cash and
to liquidate its assets or to keep appropriate track of its expenses for increasing net income along with shareholder's equity.
In respect with the operational performance of the Barclays on which there have been use of 5 years of financial information
which will be measured to analyses the firm’s performance in this respective period. Thus, it must be said that there is requirement of
making operating changes which will help and govern the professionals in reducing the costs implicated in the operations.
Data integrity:
All data regarding Barclays plc is collected through audited financial reports or audited annual reports of the company. In this
regard, it can be said that the report contains data integrity, as the audited annual reports provides more reliable information than an
non audited financial reports.
Descripting of relevant information used for analysis
a. Discussion of information related to business with representation of dataset
Year
Interest
income
Interest
expenses
Net
interest
income
Non
interest
revenue
Net
revenue
Net
operating
income
Stockhold
er's equity
2013 18315 6715 11600 16844 28444 540 55385
2014 17363 5283 12080 13688 25768 -174 59567
2015 17201 4643 12558 13426 25984 -394 59810
2016 14541 4004 10537 10914 21451 1623 64873
2017 13631 3786 9845 11231 21076 -1922 63905
The main business of Barclay bank is for managing spread among deposits which is paid to consumer at particular rate which
had been gained from loans. In simple words, interest which had been earned by bank through loans is higher from interests which is
4
⊘ This is a preview!⊘
Do you want full access?
Subscribe today to unlock all pages.
Trusted by 1+ million students worldwide
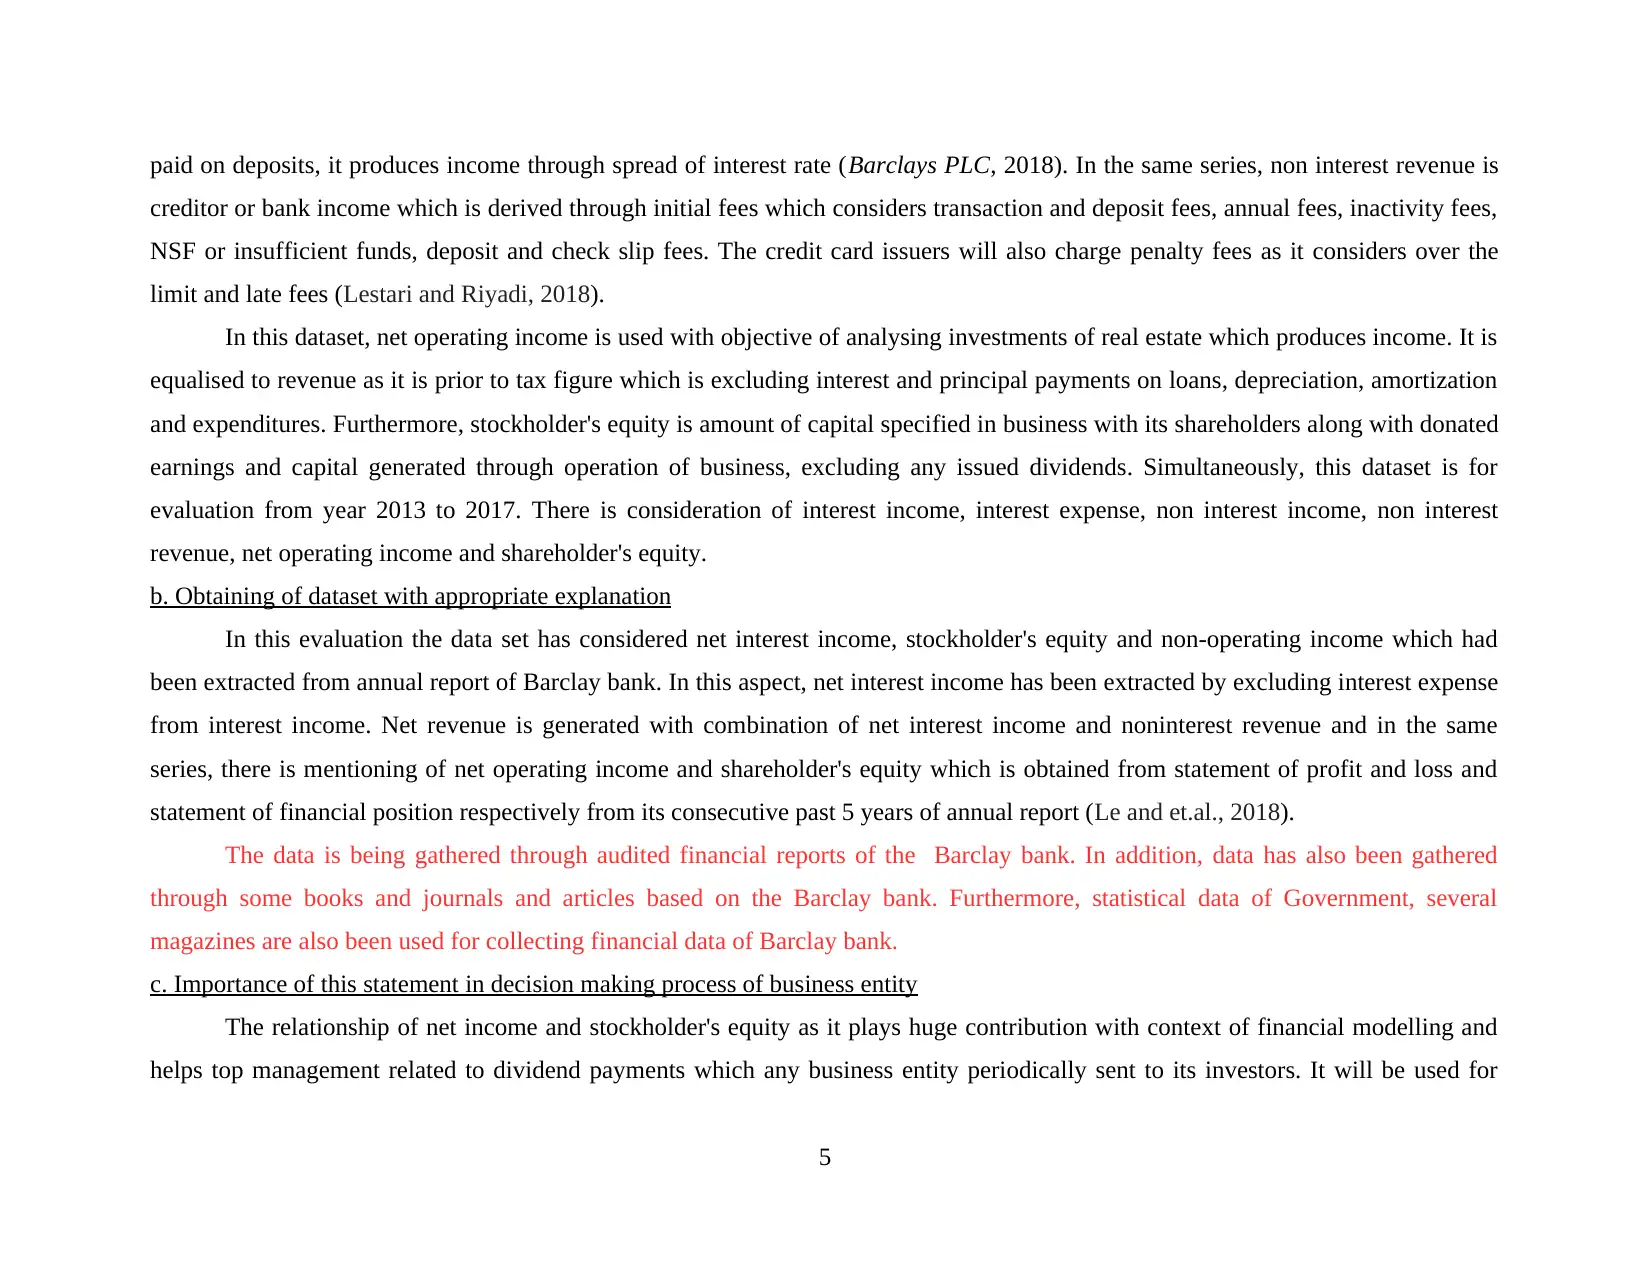
paid on deposits, it produces income through spread of interest rate (Barclays PLC, 2018). In the same series, non interest revenue is
creditor or bank income which is derived through initial fees which considers transaction and deposit fees, annual fees, inactivity fees,
NSF or insufficient funds, deposit and check slip fees. The credit card issuers will also charge penalty fees as it considers over the
limit and late fees (Lestari and Riyadi, 2018).
In this dataset, net operating income is used with objective of analysing investments of real estate which produces income. It is
equalised to revenue as it is prior to tax figure which is excluding interest and principal payments on loans, depreciation, amortization
and expenditures. Furthermore, stockholder's equity is amount of capital specified in business with its shareholders along with donated
earnings and capital generated through operation of business, excluding any issued dividends. Simultaneously, this dataset is for
evaluation from year 2013 to 2017. There is consideration of interest income, interest expense, non interest income, non interest
revenue, net operating income and shareholder's equity.
b. Obtaining of dataset with appropriate explanation
In this evaluation the data set has considered net interest income, stockholder's equity and non-operating income which had
been extracted from annual report of Barclay bank. In this aspect, net interest income has been extracted by excluding interest expense
from interest income. Net revenue is generated with combination of net interest income and noninterest revenue and in the same
series, there is mentioning of net operating income and shareholder's equity which is obtained from statement of profit and loss and
statement of financial position respectively from its consecutive past 5 years of annual report (Le and et.al., 2018).
The data is being gathered through audited financial reports of the Barclay bank. In addition, data has also been gathered
through some books and journals and articles based on the Barclay bank. Furthermore, statistical data of Government, several
magazines are also been used for collecting financial data of Barclay bank.
c. Importance of this statement in decision making process of business entity
The relationship of net income and stockholder's equity as it plays huge contribution with context of financial modelling and
helps top management related to dividend payments which any business entity periodically sent to its investors. It will be used for
5
Paraphrase This Document
Need a fresh take? Get an instant paraphrase of this document with our AI Paraphraser
maximising business value and to increase its impact on profit or margin. It is major tool which could be used for investing
perspective as it is extremely varied which is highly dependent on method of any individual organization. It is organised with
company perspective and pertained to ownership, preferred stock, paid in capital and for increment or diluting over time and
explanation about alteration in shareholder's equity.
In the same series, it will also help in gaining financial performance, position and for peer comparison as well along with
getting rough idea about dividends. In nutshell, it has been elaborated that for assisting in better decision making this relationship
helps majorly to investors, creditors and lenders. With perspective of investors, it performs fiscal analysis as basis of decision making
to invest or not whereas lending institutions will be examining financial health and confirms with presence of capacity for servicing
debt. This will help creditor as well, vendors with extension of credit might use this relationship for assessing credit worthiness of
business (Graham and Lin, 2018).
Analysing the data mining procedures from data set
Data preparation, cleaning and filtering
In respect with analysing the relationship between the profitability and number of shareholders to the firm there have been use of
various information such as Net income, operating income and shareholder equity of Barclays from 2013 to 2017 (Roth, 2018).
Implicating the descriptive data analysis effective for immediate observation for business performance
Descriptive analysis
Interes
t
income
Interes
t
expen
ses
Net
interes
t
income
Non
-interest
revenu
e
Net
revenue
Net
Operatin
g
income
Stockholder'
s
equity
Mean 1621 Mean 4886 Mean 1132 Mean 1322 Mean 24544. Mean -65.4 Mean 60708
6
0.2 .2 4 0.6 6
Standa
rd
Error
899.
42
Standa
rd
Error
526.
77
Standa
rd
Error
498.
86
Standar
d
Error
1064.
63
Standar
d
Error
1420.8
3509
Standard
Error
582.4
06
Standard
Error
1703.
095
Media
n
1720
1
Media
n 4643
Media
n
1160
0 Median
1342
6 Median 25768 Median -174 Median 59810
Mode
#N/
A Mode
#N/
A Mode
#N/
A Mode #N/A Mode #N/A Mode #N/A Mode #N/A
Standa
rd
Deviati
on
2011
.18
Standa
rd
Deviat
ion
1177
.9
Standa
rd
Deviat
ion
1115
.49
Standar
d
Deviati
on
2380.
58
Standar
d
Deviati
on
3177.0
8385
Standard
Deviation
1302.
3
Standard
Deviation
3808.
236
Sampl
e
Varian
ce
4044
829
Sampl
e
Varia
nce
1387
456
Sampl
e
Varian
ce
1244
320
Sample
Varianc
e
5667
148
Sample
Varianc
e
10093
861.8
Sample
Variance
1695
985
Sample
Variance
14502
662
Kurtos
is -2.32
Kurtos
is
0.62
642
Kurtos
is -1.69
Kurtosi
s
0.422
34
Kurtosi
s
-
2.1837
497 Kurtosis
0.758
51 Kurtosis
-
0.805
43
Skewn
ess -0.51
Skewn
ess 1.06
Skewn
ess -0.42
Skewne
ss
0.850
4
Skewne
ss
-
0.0939
807 Skewness
-
0.264
4 Skewness
-
0.362
93
Range 4684 Range 2929 Range 2713 Range 5930 Range 7368 Range 3545 Range 9488
Minim
um
1363
1
Minim
um 3786
Minim
um 9845
Minimu
m
1091
4
Minimu
m 21076
Minimu
m -1922 Minimum 55385
Maxim
um
1831
5
Maxim
um 6715
Maxim
um
1255
8
Maxim
um
1684
4
Maxim
um 28444
Maximu
m 1623 Maximum 64873
Sum
8105
1 Sum
2443
1 Sum
5662
0 Sum
6610
3 Sum
12272
3 Sum -327 Sum
30354
0
Count 5 Count 5 Count 5 Count 5 Count 5 Count 5 Count 5
Larges
t
(1)
1831
5
Larges
t
(1) 6715
Larges
t
(1)
1255
8
Largest
(1)
1684
4
Largest
(1) 28444
Largest
(1) 1623
Largest
(1) 64873
7
Standa
rd
Error
899.
42
Standa
rd
Error
526.
77
Standa
rd
Error
498.
86
Standar
d
Error
1064.
63
Standar
d
Error
1420.8
3509
Standard
Error
582.4
06
Standard
Error
1703.
095
Media
n
1720
1
Media
n 4643
Media
n
1160
0 Median
1342
6 Median 25768 Median -174 Median 59810
Mode
#N/
A Mode
#N/
A Mode
#N/
A Mode #N/A Mode #N/A Mode #N/A Mode #N/A
Standa
rd
Deviati
on
2011
.18
Standa
rd
Deviat
ion
1177
.9
Standa
rd
Deviat
ion
1115
.49
Standar
d
Deviati
on
2380.
58
Standar
d
Deviati
on
3177.0
8385
Standard
Deviation
1302.
3
Standard
Deviation
3808.
236
Sampl
e
Varian
ce
4044
829
Sampl
e
Varia
nce
1387
456
Sampl
e
Varian
ce
1244
320
Sample
Varianc
e
5667
148
Sample
Varianc
e
10093
861.8
Sample
Variance
1695
985
Sample
Variance
14502
662
Kurtos
is -2.32
Kurtos
is
0.62
642
Kurtos
is -1.69
Kurtosi
s
0.422
34
Kurtosi
s
-
2.1837
497 Kurtosis
0.758
51 Kurtosis
-
0.805
43
Skewn
ess -0.51
Skewn
ess 1.06
Skewn
ess -0.42
Skewne
ss
0.850
4
Skewne
ss
-
0.0939
807 Skewness
-
0.264
4 Skewness
-
0.362
93
Range 4684 Range 2929 Range 2713 Range 5930 Range 7368 Range 3545 Range 9488
Minim
um
1363
1
Minim
um 3786
Minim
um 9845
Minimu
m
1091
4
Minimu
m 21076
Minimu
m -1922 Minimum 55385
Maxim
um
1831
5
Maxim
um 6715
Maxim
um
1255
8
Maxim
um
1684
4
Maxim
um 28444
Maximu
m 1623 Maximum 64873
Sum
8105
1 Sum
2443
1 Sum
5662
0 Sum
6610
3 Sum
12272
3 Sum -327 Sum
30354
0
Count 5 Count 5 Count 5 Count 5 Count 5 Count 5 Count 5
Larges
t
(1)
1831
5
Larges
t
(1) 6715
Larges
t
(1)
1255
8
Largest
(1)
1684
4
Largest
(1) 28444
Largest
(1) 1623
Largest
(1) 64873
7
⊘ This is a preview!⊘
Do you want full access?
Subscribe today to unlock all pages.
Trusted by 1+ million students worldwide
Smalle
st
(1)
1363
1
Smalle
st
(1) 3786
Smalle
st
(1) 9845
Smalles
t
(1)
1091
4
Smalles
t
(1) 21076
Smallest
(1) -1922
Smallest
(1) 55385
Confid
ence
Level
(95.0%
)
2497
.2
Confid
ence
Level
(95.0%
)
1462
.56
Confid
ence
Level
(95.0%
)
1385
.06
Confide
nce
Level
(95.0%)
2955.
88
Confide
nce
Level
(95.0%
)
3944.8
7064
Confiden
ce
Level
(95.0%)
1617.
02
Confidence
Level
(95.0%)
4728.
55
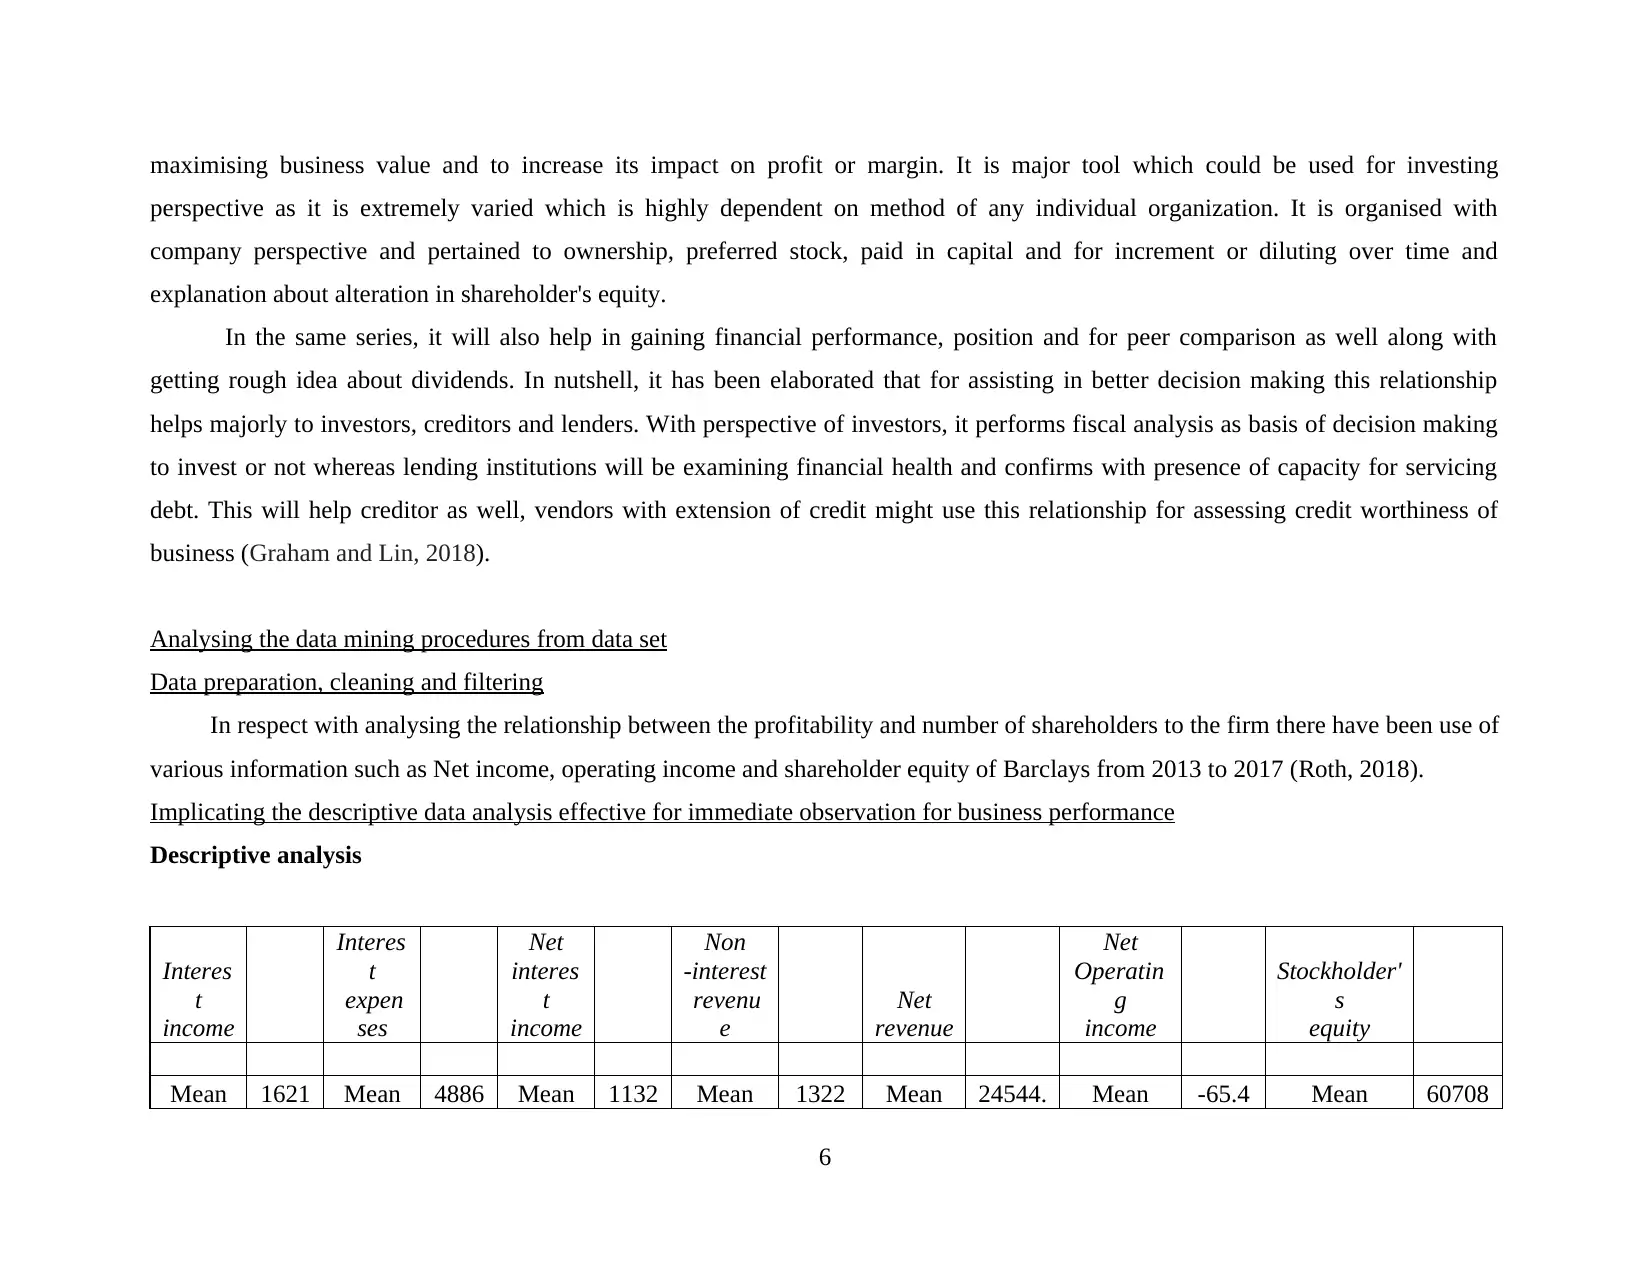
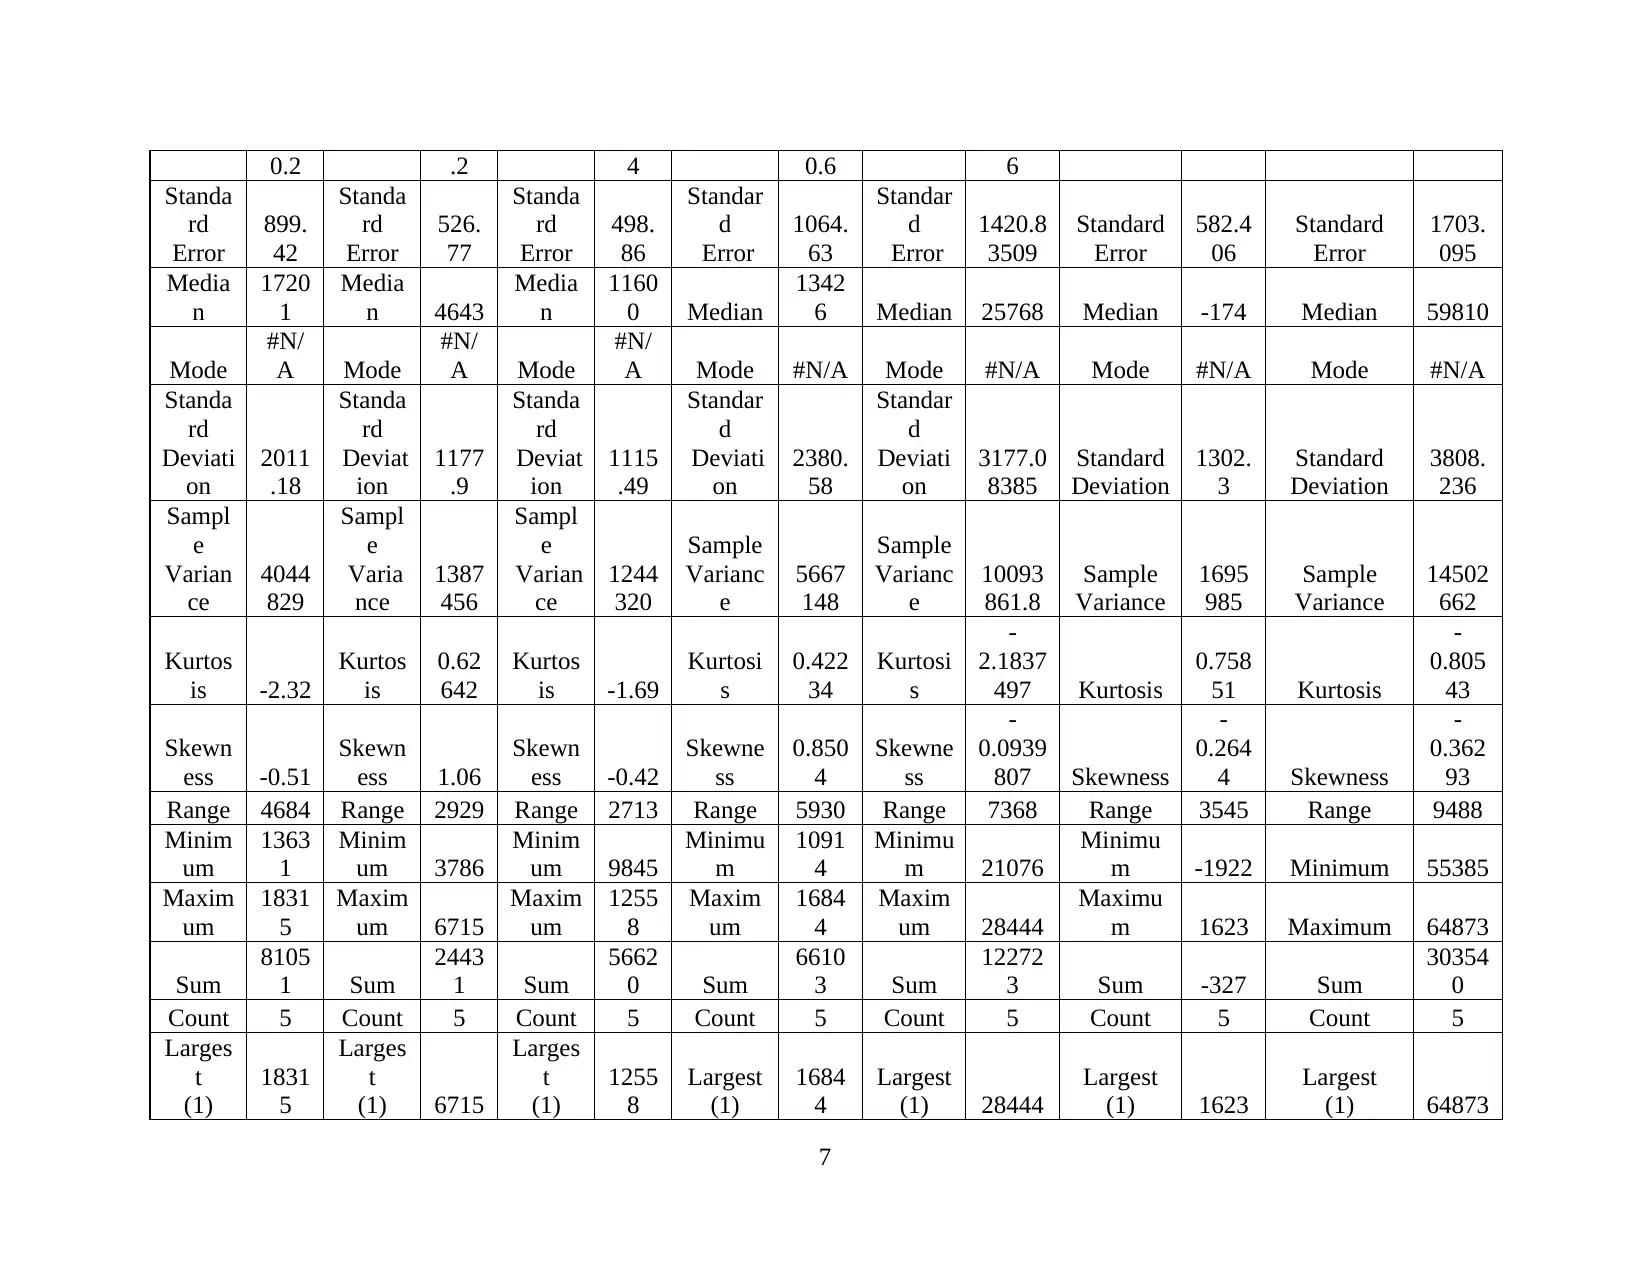
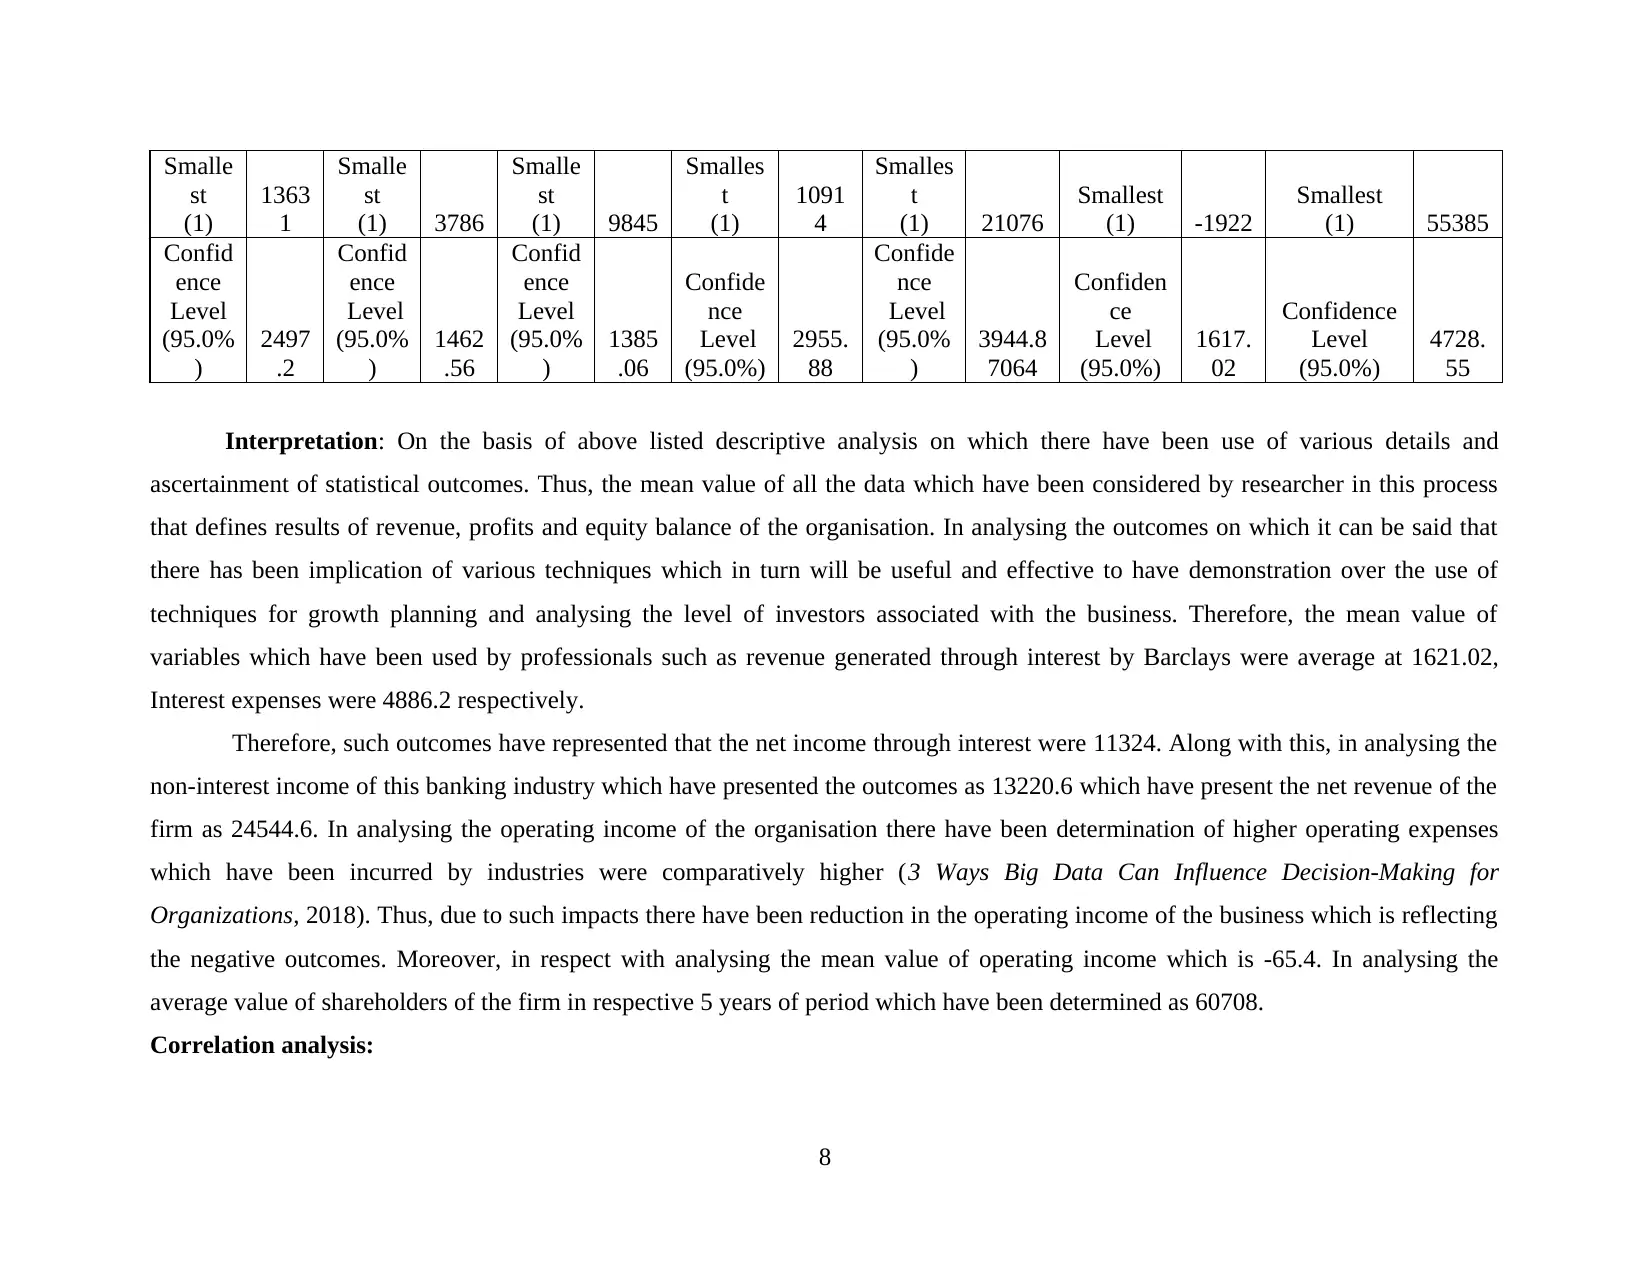
Interpretation: On the basis of above listed descriptive analysis on which there have been use of various details and
ascertainment of statistical outcomes. Thus, the mean value of all the data which have been considered by researcher in this process
that defines results of revenue, profits and equity balance of the organisation. In analysing the outcomes on which it can be said that
there has been implication of various techniques which in turn will be useful and effective to have demonstration over the use of
techniques for growth planning and analysing the level of investors associated with the business. Therefore, the mean value of
variables which have been used by professionals such as revenue generated through interest by Barclays were average at 1621.02,
Interest expenses were 4886.2 respectively.
Therefore, such outcomes have represented that the net income through interest were 11324. Along with this, in analysing the
non-interest income of this banking industry which have presented the outcomes as 13220.6 which have present the net revenue of the
firm as 24544.6. In analysing the operating income of the organisation there have been determination of higher operating expenses
which have been incurred by industries were comparatively higher (3 Ways Big Data Can Influence Decision-Making for
Organizations, 2018). Thus, due to such impacts there have been reduction in the operating income of the business which is reflecting
the negative outcomes. Moreover, in respect with analysing the mean value of operating income which is -65.4. In analysing the
average value of shareholders of the firm in respective 5 years of period which have been determined as 60708.
Correlation analysis:
8
st
(1)
1363
1
Smalle
st
(1) 3786
Smalle
st
(1) 9845
Smalles
t
(1)
1091
4
Smalles
t
(1) 21076
Smallest
(1) -1922
Smallest
(1) 55385
Confid
ence
Level
(95.0%
)
2497
.2
Confid
ence
Level
(95.0%
)
1462
.56
Confid
ence
Level
(95.0%
)
1385
.06
Confide
nce
Level
(95.0%)
2955.
88
Confide
nce
Level
(95.0%
)
3944.8
7064
Confiden
ce
Level
(95.0%)
1617.
02
Confidence
Level
(95.0%)
4728.
55
Interpretation: On the basis of above listed descriptive analysis on which there have been use of various details and
ascertainment of statistical outcomes. Thus, the mean value of all the data which have been considered by researcher in this process
that defines results of revenue, profits and equity balance of the organisation. In analysing the outcomes on which it can be said that
there has been implication of various techniques which in turn will be useful and effective to have demonstration over the use of
techniques for growth planning and analysing the level of investors associated with the business. Therefore, the mean value of
variables which have been used by professionals such as revenue generated through interest by Barclays were average at 1621.02,
Interest expenses were 4886.2 respectively.
Therefore, such outcomes have represented that the net income through interest were 11324. Along with this, in analysing the
non-interest income of this banking industry which have presented the outcomes as 13220.6 which have present the net revenue of the
firm as 24544.6. In analysing the operating income of the organisation there have been determination of higher operating expenses
which have been incurred by industries were comparatively higher (3 Ways Big Data Can Influence Decision-Making for
Organizations, 2018). Thus, due to such impacts there have been reduction in the operating income of the business which is reflecting
the negative outcomes. Moreover, in respect with analysing the mean value of operating income which is -65.4. In analysing the
average value of shareholders of the firm in respective 5 years of period which have been determined as 60708.
Correlation analysis:
8
Paraphrase This Document
Need a fresh take? Get an instant paraphrase of this document with our AI Paraphraser
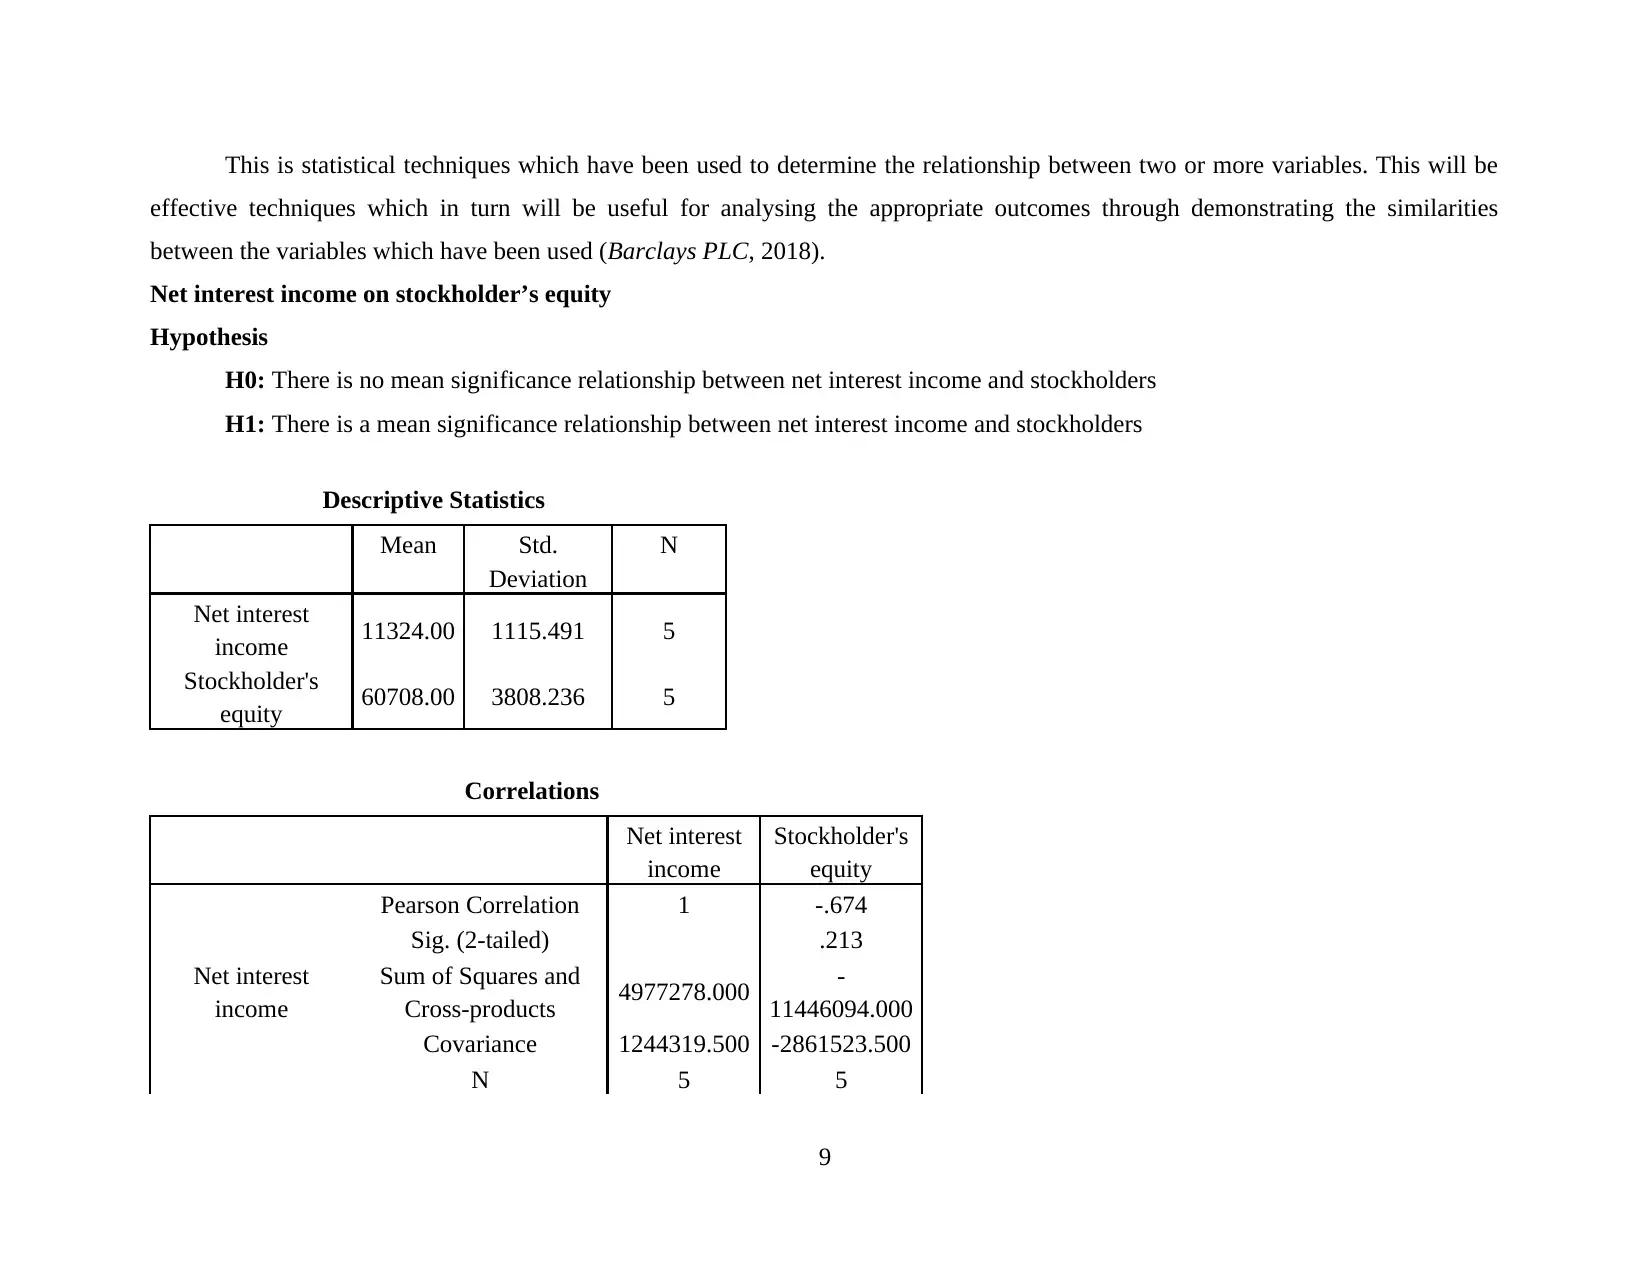
This is statistical techniques which have been used to determine the relationship between two or more variables. This will be
effective techniques which in turn will be useful for analysing the appropriate outcomes through demonstrating the similarities
between the variables which have been used (Barclays PLC, 2018).
Net interest income on stockholder’s equity
Hypothesis
H0: There is no mean significance relationship between net interest income and stockholders
H1: There is a mean significance relationship between net interest income and stockholders
Descriptive Statistics
Mean Std.
Deviation
N
Net interest
income 11324.00 1115.491 5
Stockholder's
equity 60708.00 3808.236 5
Correlations
Net interest
income
Stockholder's
equity
Net interest
income
Pearson Correlation 1 -.674
Sig. (2-tailed) .213
Sum of Squares and
Cross-products 4977278.000 -
11446094.000
Covariance 1244319.500 -2861523.500
N 5 5
9
Stockholder's
equity
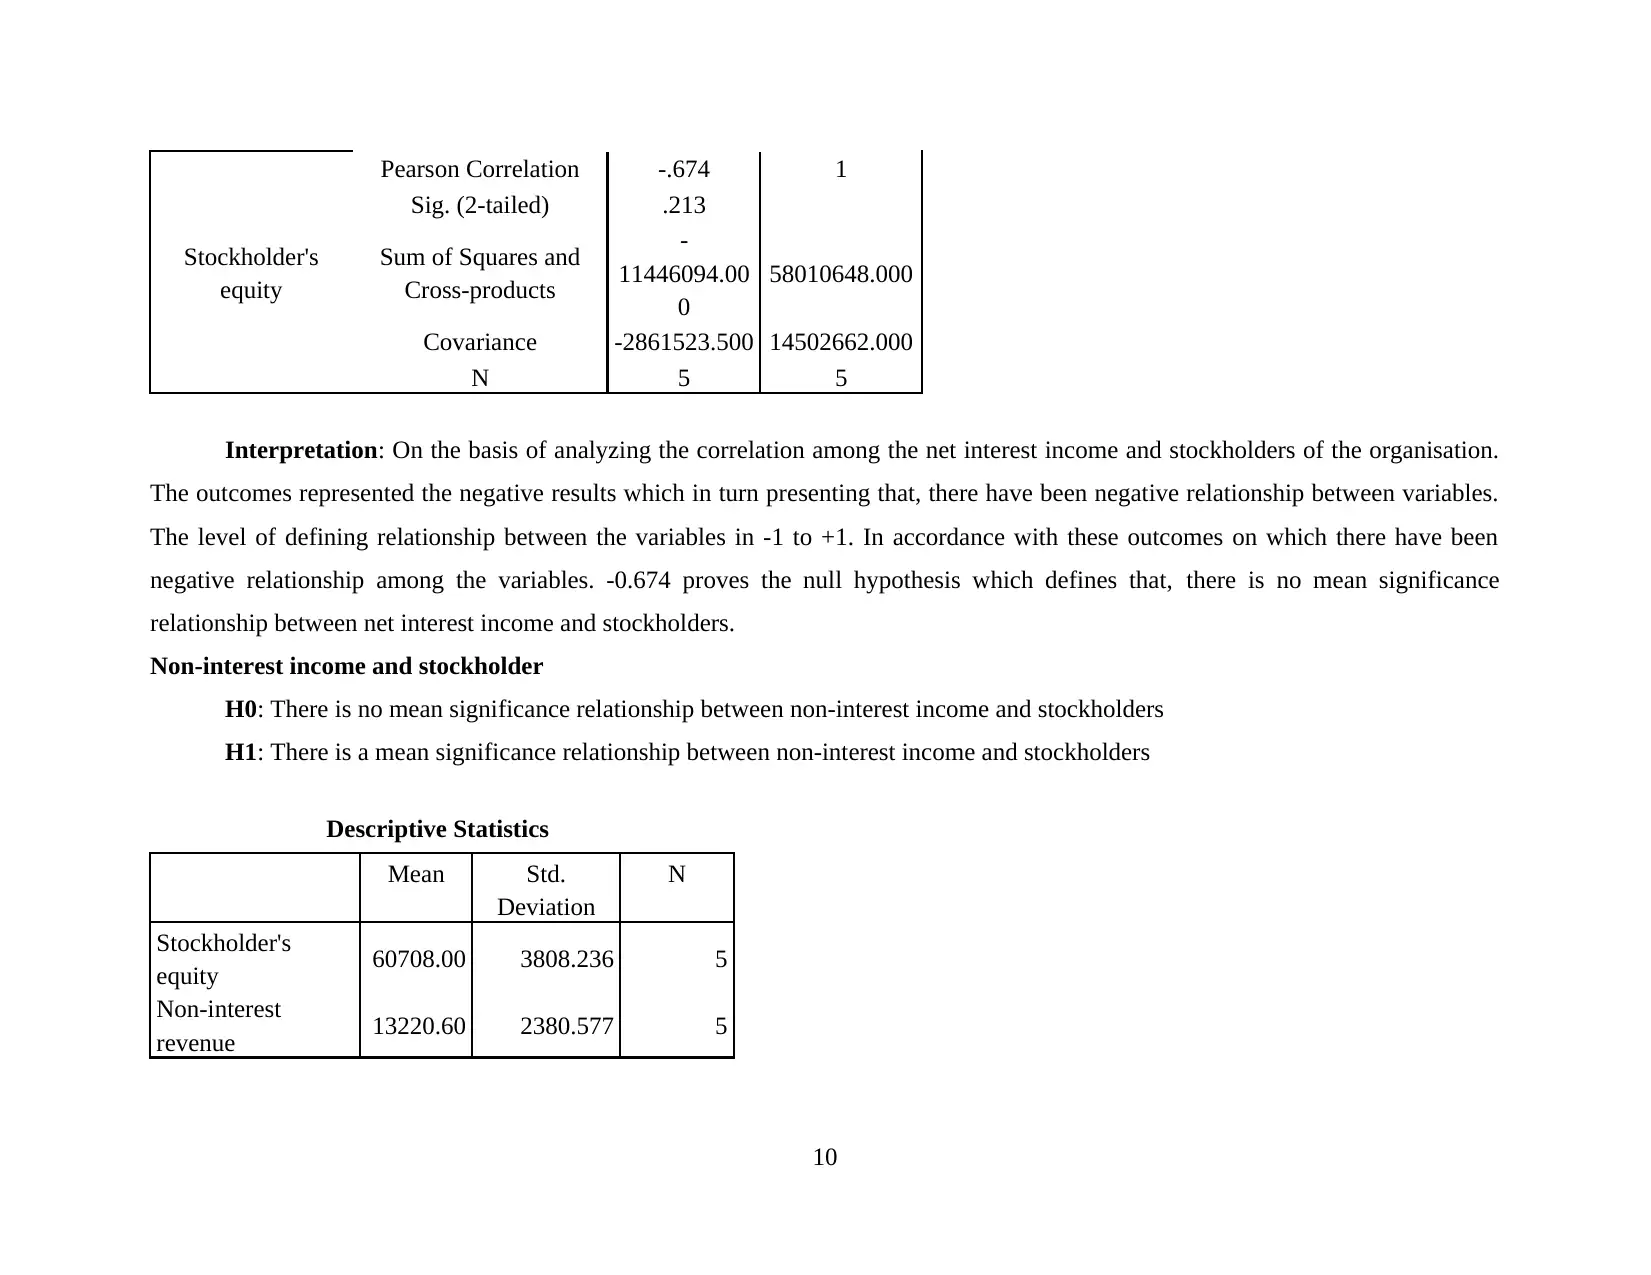
Pearson Correlation -.674 1
Sig. (2-tailed) .213
Sum of Squares and
Cross-products
-
11446094.00
0
58010648.000
Covariance -2861523.500 14502662.000
N 5 5
Interpretation: On the basis of analyzing the correlation among the net interest income and stockholders of the organisation.
The outcomes represented the negative results which in turn presenting that, there have been negative relationship between variables.
The level of defining relationship between the variables in -1 to +1. In accordance with these outcomes on which there have been
negative relationship among the variables. -0.674 proves the null hypothesis which defines that, there is no mean significance
relationship between net interest income and stockholders.
Non-interest income and stockholder
H0: There is no mean significance relationship between non-interest income and stockholders
H1: There is a mean significance relationship between non-interest income and stockholders
Descriptive Statistics
Mean Std.
Deviation
N
Stockholder's
equity 60708.00 3808.236 5
Non-interest
revenue 13220.60 2380.577 5
10
equity
Pearson Correlation -.674 1
Sig. (2-tailed) .213
Sum of Squares and
Cross-products
-
11446094.00
0
58010648.000
Covariance -2861523.500 14502662.000
N 5 5
Interpretation: On the basis of analyzing the correlation among the net interest income and stockholders of the organisation.
The outcomes represented the negative results which in turn presenting that, there have been negative relationship between variables.
The level of defining relationship between the variables in -1 to +1. In accordance with these outcomes on which there have been
negative relationship among the variables. -0.674 proves the null hypothesis which defines that, there is no mean significance
relationship between net interest income and stockholders.
Non-interest income and stockholder
H0: There is no mean significance relationship between non-interest income and stockholders
H1: There is a mean significance relationship between non-interest income and stockholders
Descriptive Statistics
Mean Std.
Deviation
N
Stockholder's
equity 60708.00 3808.236 5
Non-interest
revenue 13220.60 2380.577 5
10
⊘ This is a preview!⊘
Do you want full access?
Subscribe today to unlock all pages.
Trusted by 1+ million students worldwide
1 out of 30
Related Documents


Your All-in-One AI-Powered Toolkit for Academic Success.
+13062052269
info@desklib.com
Available 24*7 on WhatsApp / Email
![[object Object]](/_next/static/media/star-bottom.7253800d.svg)
Unlock your academic potential
Copyright © 2020–2026 A2Z Services. All Rights Reserved. Developed and managed by ZUCOL.