Financial Analysis of Barratt Developments plc: A Detailed Report
VerifiedAdded on 2023/01/16
|15
|2969
|29
Report
AI Summary
This report provides a comprehensive financial analysis of Barratt Developments plc, a major player in the UK house-building industry. The analysis focuses on key financial statements, including the income statement, balance sheet, and cash flow statements, to assess the company's performance over a four-year period. The report utilizes ratio analysis, covering liquidity, profitability, activity, and solvency ratios, to evaluate the company's financial health and identify trends. A comparative analysis with Persimmon plc, a competitor in the same industry, provides valuable context. Furthermore, trend analysis is conducted to understand the dynamic performance of the companies. The report also offers insights from an investor's perspective, commenting on the movements in financial ratios. Finally, it concludes with recommendations aimed at enhancing the company's financial performance in the future. The report emphasizes the importance of financial reporting and its role in assessing a business's profitability and overall performance.

PRINCIPLES OF FINANCE
Paraphrase This Document
Need a fresh take? Get an instant paraphrase of this document with our AI Paraphraser
TABLE OF CONTENTS
INTRODUCTION...........................................................................................................................1
MAIN BODY...................................................................................................................................1
Barratt Developments plc............................................................................................................1
Ratio Analysis .............................................................................................................................1
I ) Financial Performance of Barratt Developments Plc..............................................................4
II) Comparison of financial position of companies ....................................................................6
Trend analysis .................................................................................................................................7
Comment on the business from an investor’s point of view in terms of movements in ratios......11
Overall conclusions and recommendations for enhancing financial performance in future.........12
REFERENCES..............................................................................................................................13
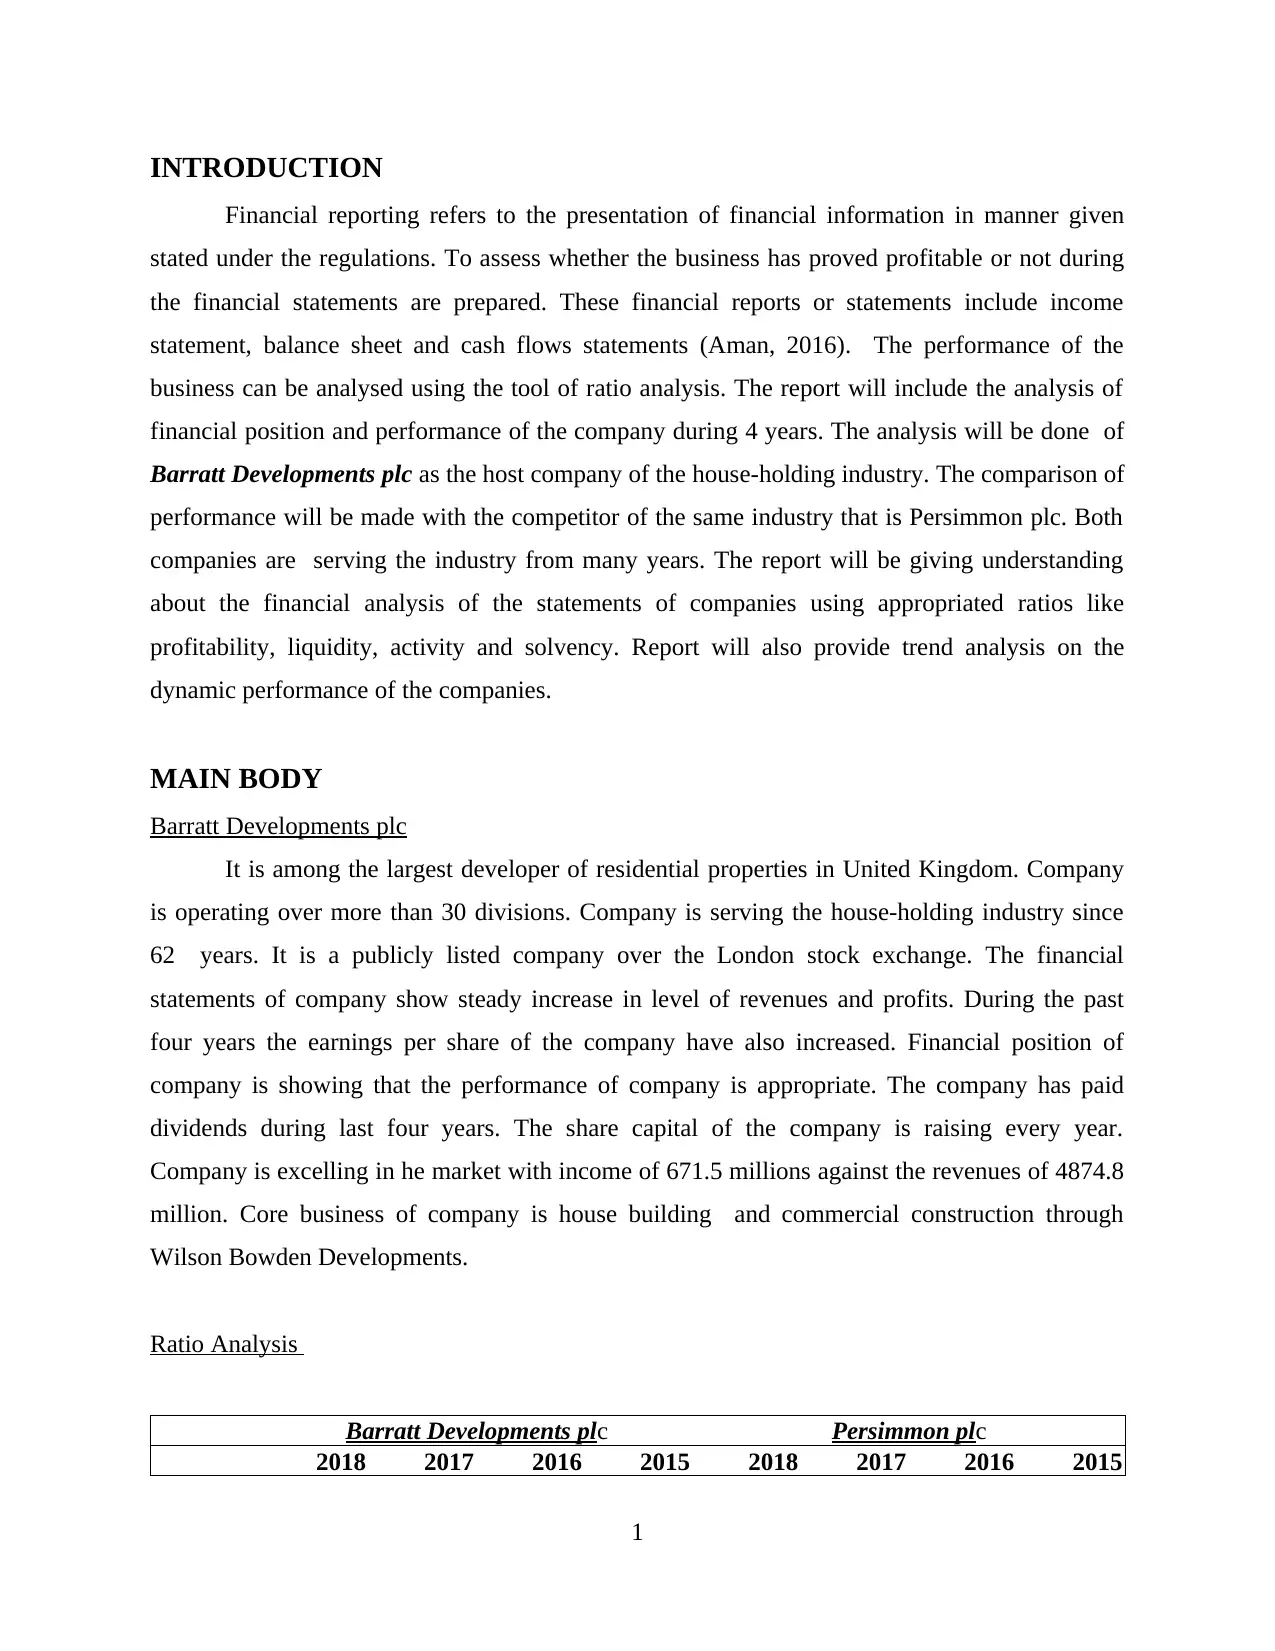
INTRODUCTION
Financial reporting refers to the presentation of financial information in manner given
stated under the regulations. To assess whether the business has proved profitable or not during
the financial statements are prepared. These financial reports or statements include income
statement, balance sheet and cash flows statements (Aman, 2016). The performance of the
business can be analysed using the tool of ratio analysis. The report will include the analysis of
financial position and performance of the company during 4 years. The analysis will be done of
Barratt Developments plc as the host company of the house-holding industry. The comparison of
performance will be made with the competitor of the same industry that is Persimmon plc. Both
companies are serving the industry from many years. The report will be giving understanding
about the financial analysis of the statements of companies using appropriated ratios like
profitability, liquidity, activity and solvency. Report will also provide trend analysis on the
dynamic performance of the companies.
MAIN BODY
Barratt Developments plc
It is among the largest developer of residential properties in United Kingdom. Company
is operating over more than 30 divisions. Company is serving the house-holding industry since
62 years. It is a publicly listed company over the London stock exchange. The financial
statements of company show steady increase in level of revenues and profits. During the past
four years the earnings per share of the company have also increased. Financial position of
company is showing that the performance of company is appropriate. The company has paid
dividends during last four years. The share capital of the company is raising every year.
Company is excelling in he market with income of 671.5 millions against the revenues of 4874.8
million. Core business of company is house building and commercial construction through
Wilson Bowden Developments.
Ratio Analysis
Barratt Developments plc Persimmon plc
2018 2017 2016 2015 2018 2017 2016 2015
1
⊘ This is a preview!⊘
Do you want full access?
Subscribe today to unlock all pages.
Trusted by 1+ million students worldwide
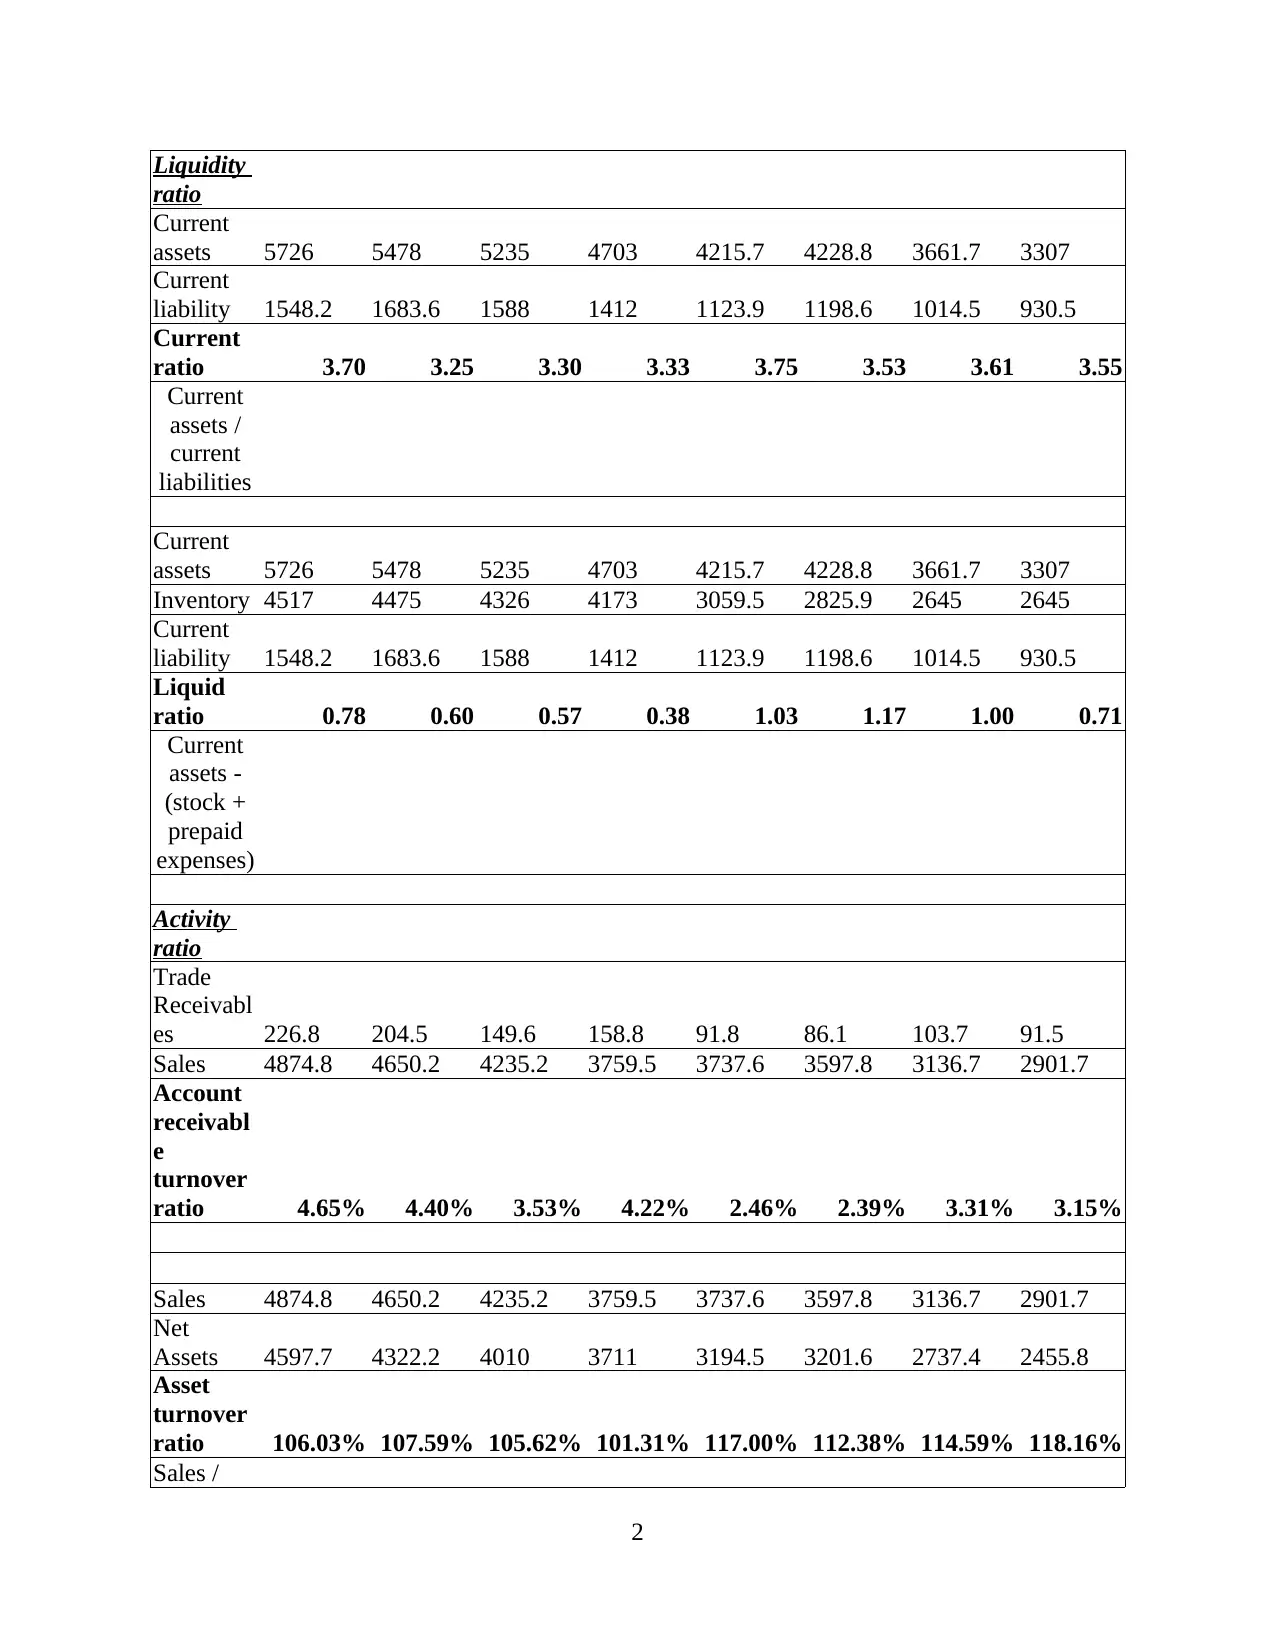
Liquidity
ratio
Current
assets 5726 5478 5235 4703 4215.7 4228.8 3661.7 3307
Current
liability 1548.2 1683.6 1588 1412 1123.9 1198.6 1014.5 930.5
Current
ratio 3.70 3.25 3.30 3.33 3.75 3.53 3.61 3.55
Current
assets /
current
liabilities
Current
assets 5726 5478 5235 4703 4215.7 4228.8 3661.7 3307
Inventory 4517 4475 4326 4173 3059.5 2825.9 2645 2645
Current
liability 1548.2 1683.6 1588 1412 1123.9 1198.6 1014.5 930.5
Liquid
ratio 0.78 0.60 0.57 0.38 1.03 1.17 1.00 0.71
Current
assets -
(stock +
prepaid
expenses)
Activity
ratio
Trade
Receivabl
es 226.8 204.5 149.6 158.8 91.8 86.1 103.7 91.5
Sales 4874.8 4650.2 4235.2 3759.5 3737.6 3597.8 3136.7 2901.7
Account
receivabl
e
turnover
ratio 4.65% 4.40% 3.53% 4.22% 2.46% 2.39% 3.31% 3.15%
Sales 4874.8 4650.2 4235.2 3759.5 3737.6 3597.8 3136.7 2901.7
Net
Assets 4597.7 4322.2 4010 3711 3194.5 3201.6 2737.4 2455.8
Asset
turnover
ratio 106.03% 107.59% 105.62% 101.31% 117.00% 112.38% 114.59% 118.16%
Sales /
2
ratio
Current
assets 5726 5478 5235 4703 4215.7 4228.8 3661.7 3307
Current
liability 1548.2 1683.6 1588 1412 1123.9 1198.6 1014.5 930.5
Current
ratio 3.70 3.25 3.30 3.33 3.75 3.53 3.61 3.55
Current
assets /
current
liabilities
Current
assets 5726 5478 5235 4703 4215.7 4228.8 3661.7 3307
Inventory 4517 4475 4326 4173 3059.5 2825.9 2645 2645
Current
liability 1548.2 1683.6 1588 1412 1123.9 1198.6 1014.5 930.5
Liquid
ratio 0.78 0.60 0.57 0.38 1.03 1.17 1.00 0.71
Current
assets -
(stock +
prepaid
expenses)
Activity
ratio
Trade
Receivabl
es 226.8 204.5 149.6 158.8 91.8 86.1 103.7 91.5
Sales 4874.8 4650.2 4235.2 3759.5 3737.6 3597.8 3136.7 2901.7
Account
receivabl
e
turnover
ratio 4.65% 4.40% 3.53% 4.22% 2.46% 2.39% 3.31% 3.15%
Sales 4874.8 4650.2 4235.2 3759.5 3737.6 3597.8 3136.7 2901.7
Net
Assets 4597.7 4322.2 4010 3711 3194.5 3201.6 2737.4 2455.8
Asset
turnover
ratio 106.03% 107.59% 105.62% 101.31% 117.00% 112.38% 114.59% 118.16%
Sales /
2
Paraphrase This Document
Need a fresh take? Get an instant paraphrase of this document with our AI Paraphraser
Net assets
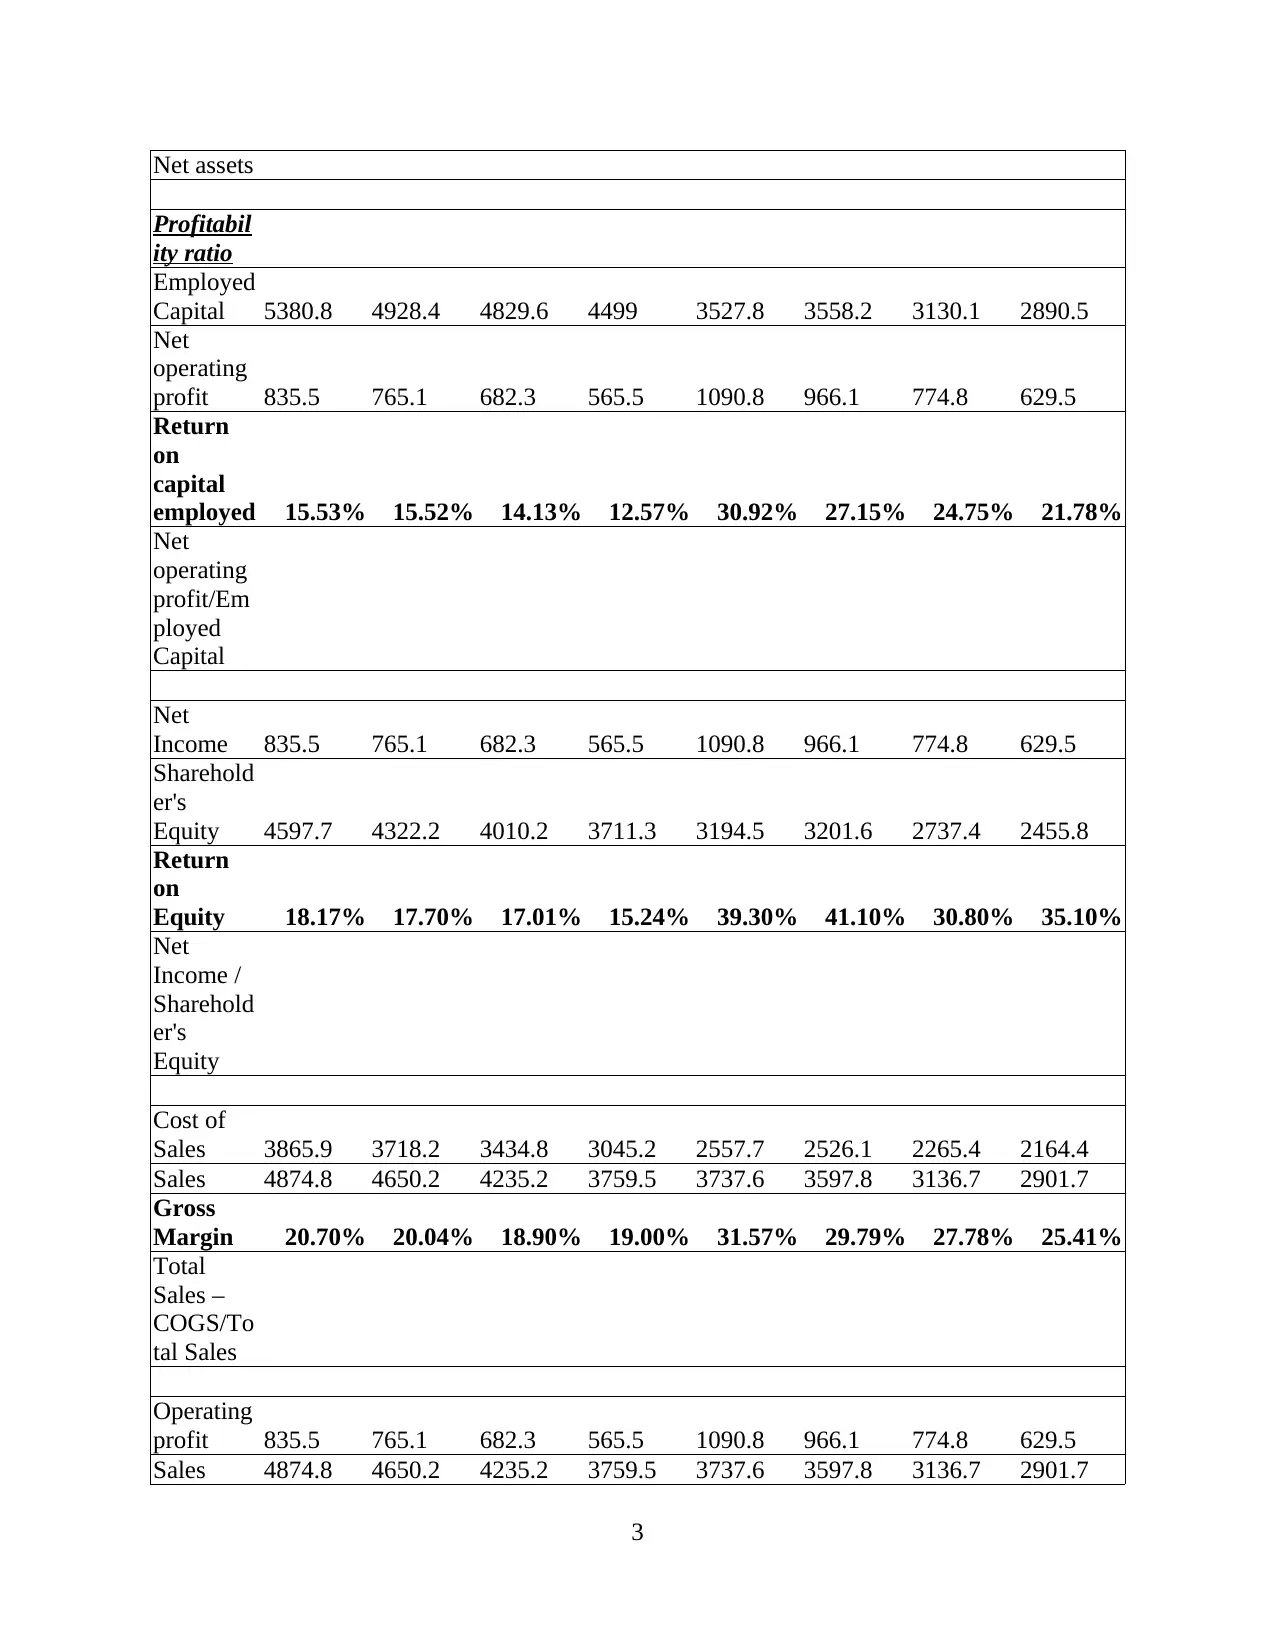
Profitabil
ity ratio
Employed
Capital 5380.8 4928.4 4829.6 4499 3527.8 3558.2 3130.1 2890.5
Net
operating
profit 835.5 765.1 682.3 565.5 1090.8 966.1 774.8 629.5
Return
on
capital
employed 15.53% 15.52% 14.13% 12.57% 30.92% 27.15% 24.75% 21.78%
Net
operating
profit/Em
ployed
Capital
Net
Income 835.5 765.1 682.3 565.5 1090.8 966.1 774.8 629.5
Sharehold
er's
Equity 4597.7 4322.2 4010.2 3711.3 3194.5 3201.6 2737.4 2455.8
Return
on
Equity 18.17% 17.70% 17.01% 15.24% 39.30% 41.10% 30.80% 35.10%
Net
Income /
Sharehold
er's
Equity
Cost of
Sales 3865.9 3718.2 3434.8 3045.2 2557.7 2526.1 2265.4 2164.4
Sales 4874.8 4650.2 4235.2 3759.5 3737.6 3597.8 3136.7 2901.7
Gross
Margin 20.70% 20.04% 18.90% 19.00% 31.57% 29.79% 27.78% 25.41%
Total
Sales –
COGS/To
tal Sales
Operating
profit 835.5 765.1 682.3 565.5 1090.8 966.1 774.8 629.5
Sales 4874.8 4650.2 4235.2 3759.5 3737.6 3597.8 3136.7 2901.7
3

Operatin
g profit
ratio 17.14% 16.45% 16.11% 15.04% 29.18% 26.85% 24.70% 21.69%
Operating
Income/
Net Sales
Debt
Debt 191.1 1.4 171.5 163.3 333.3 356.6 392.7 435.5
Equity 4597.7 4322.2 4010.2 3711.3 3194.4 3201.6 2737.4 2455.8
Debt
equity
ratio 4.16% 0.03% 4.28% 4.40% 10.43% 11.14% 14.35% 17.73%
Debt/
Equity
EBIT 869.6 808 668.4 576.8 1082.7 955.1 770.5 626.2
Interest
expense 64.1 64.6 10.6 15.7 12.3 13.5 15.5 18.8
Interest
coverage
ratio 7.37% 8.00% 1.59% 2.72% 1.14% 1.41% 2.01% 3.00%
Interest /
EBIT
Market
ratio
Net profit 671.5 616 550.3 450.3 886.4 786.9 633.3 521.9
Shares
outstandin
g 1010.7 1004.3 1013 1008.4 312.9 308.6 308 306.4
EPS 0.664 0.613 0.543 0.447 2.833 2.550 2.056 1.703
Net
profit /
shares
outstandin
g
I ) Financial Performance of Barratt Developments Plc
Interpretations
4
⊘ This is a preview!⊘
Do you want full access?
Subscribe today to unlock all pages.
Trusted by 1+ million students worldwide
Liquidity ratios are used for measuring the liquidity position of company. Liquidity of
company is assessed using the current ratio and quick ratio (Dicle and Meyer, 2018). Current
ratios of company during the past four years is more than 2 that shows the company is having
strong liquidity position considering all the current assets including inventory. Current ratio of
the company should be high as it represents the ability of company to meet its short term
obligations. Quick ratio of company is significantly lower. This should be higher than 1.5 as it do
not considers. This shows major part of current assets of company comprises of the inventory.
However seeing the 4 years trend it is improving continuously.
Profitability ratios are very important to know the financial performance of company. Barratt plc
shows the profitability of company is above the average industry standards.
Return over capital employed of company does not shows major increase during the last
four years. Rise was seen mainly in 2016 as the profit levels of company raised from the
previous year. Company should have adequate returns over capital employed for motivating the
business and its employees to perform better.
Return over equity of company has raised to 18.17% from 15.24% in 2015 during the last
four years. Company is showing growth and therefore is able to provide more returns to its
equity holders. This helps in satisfying the equity investors by providing adequate returns over
their investments. The returns have to be improved further by using the appropriate strategies
that helps company in raising the returns.
Gross profit margin of company during the last four years has remained between 19 -
21%. the gross profit margin of company is not very high but has continuously increasing. Gross
profit is the amount left with the company after carrying out its cost of sales. Since they are
involved in house building and construction they involve high costs of production. They can use
cost controls strategies so that the cost of sales can be controlled by company.
Operating profit margin of company is showing a rising trend. The net profit margin of
company as against its revenues can be improved further using appropriate steps (Boyas and
Teeter, 2017). Profits have to be increased by controlling the operating expenses. Since the
company operates over increased number of divisions it has higher operational costs. It can use
centralized approach for managing the operations of company.
Solvency of the company is assessed using the debt equity and interest coverage ratio. It
is essential for company to have appropriate mix of debt and equity so that the capital structure
5
Paraphrase This Document
Need a fresh take? Get an instant paraphrase of this document with our AI Paraphraser
of the company is also adequate. Company has maintained a range of 4-5% of debt against its
equity. Company in year 2017 was having almost negligible debt against equity. Higher debt
represents higher financial risks. If the risks is high investors do not invest in such companies.
However the significantly lower debts allocates profits to larger number of shareholders. The
interest coverage ratio of company is has raised during the last two years (Bragg, 2018). It has
increased over the short term borrowings not over the long term borrowings.
Activity ratio of company shows the activities of company during the year. Asset
turnover ratio of company is in relation with standard of industry. Higher the ratio better for
company. Revenues generated against still have be increased by the enterprise. Account
receivable turnover is adequate of company. This shows that cash collection period of company
is adequate.
Market ratio of company shows that the industry is running in accordance with the
market. The earning ratio of company shows the earnings of the shareholders who have invested
funds in company. Company is having high equity capital therefore the earnings per share of the
company are splitted to larger number of shares.
II) Comparison of financial position of companies
Persimmon plc is serving the same industry of house-holding developments. Company
has comparatively by lower level of revenues than also able to earn higher returns in terms of
gross profit and operating profit margins (Williams and Dobelman, 2017). Other probability
ratios have higher returns than Barratt but the increase is seen as the invested capital and
shareholder equity is lower in comparison to Barratt plc. The Persimmon is having adequate
liquidity levels as company manages the assets properly. Activity ratios of company does not
shows higher variations between the two companies. Persimmon plc have adequate capital mix
with lower finance costs. This brings cost benefits to the company. The earning ratio of
Persimmon is higher than Barratt that helps I attracting new investors but company has lower
share capital as compared with Baratt plc. Company is tough competitor of Baratt plc and can
also move forward from it.
6
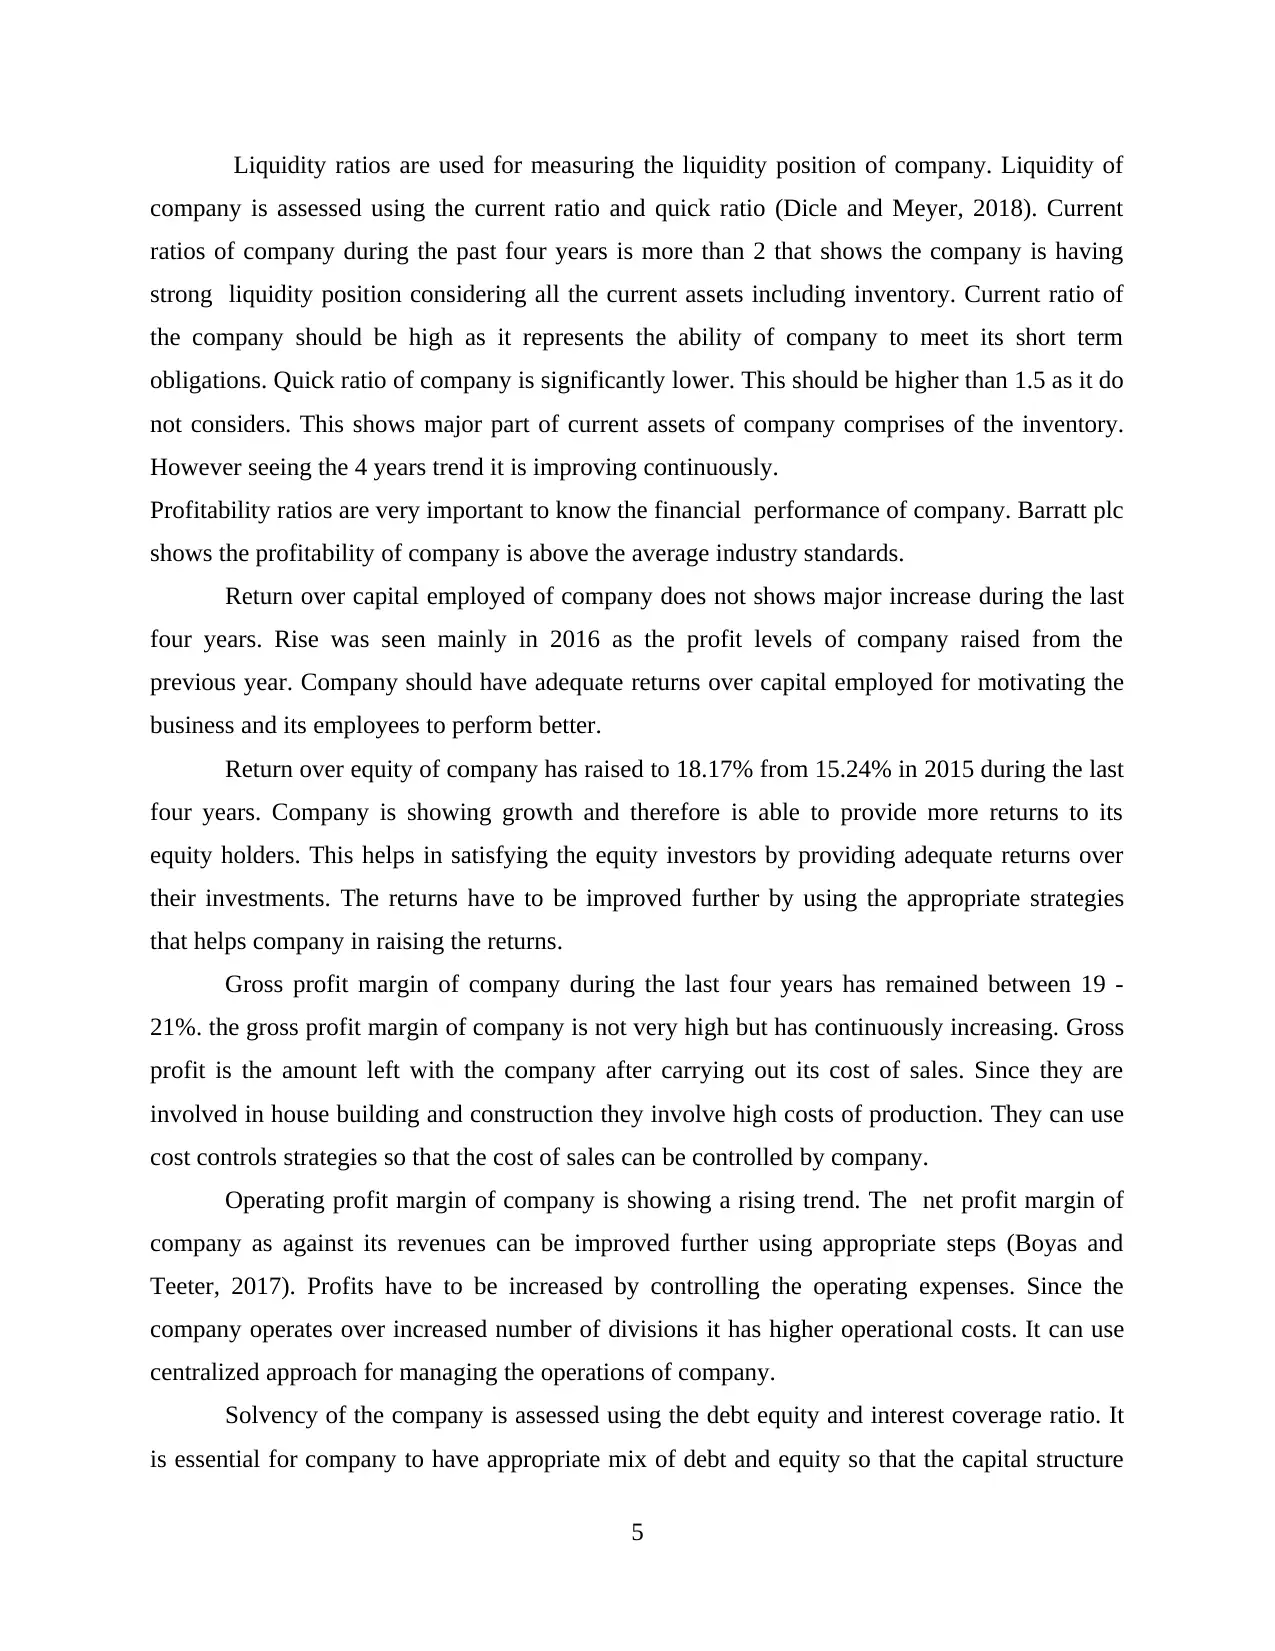
Trend analysis
Figure 1Current ratio
Current ratio of the Barrat Development decline sligtly in the year 2016 and 2017 from 3.33 to
3.25. However, then it rise to 3.75 in the year 2018. It can be said that performance improved.
However, decline in the performance was also not matter of concern because value of current
ratio each year is already above standard value 2.
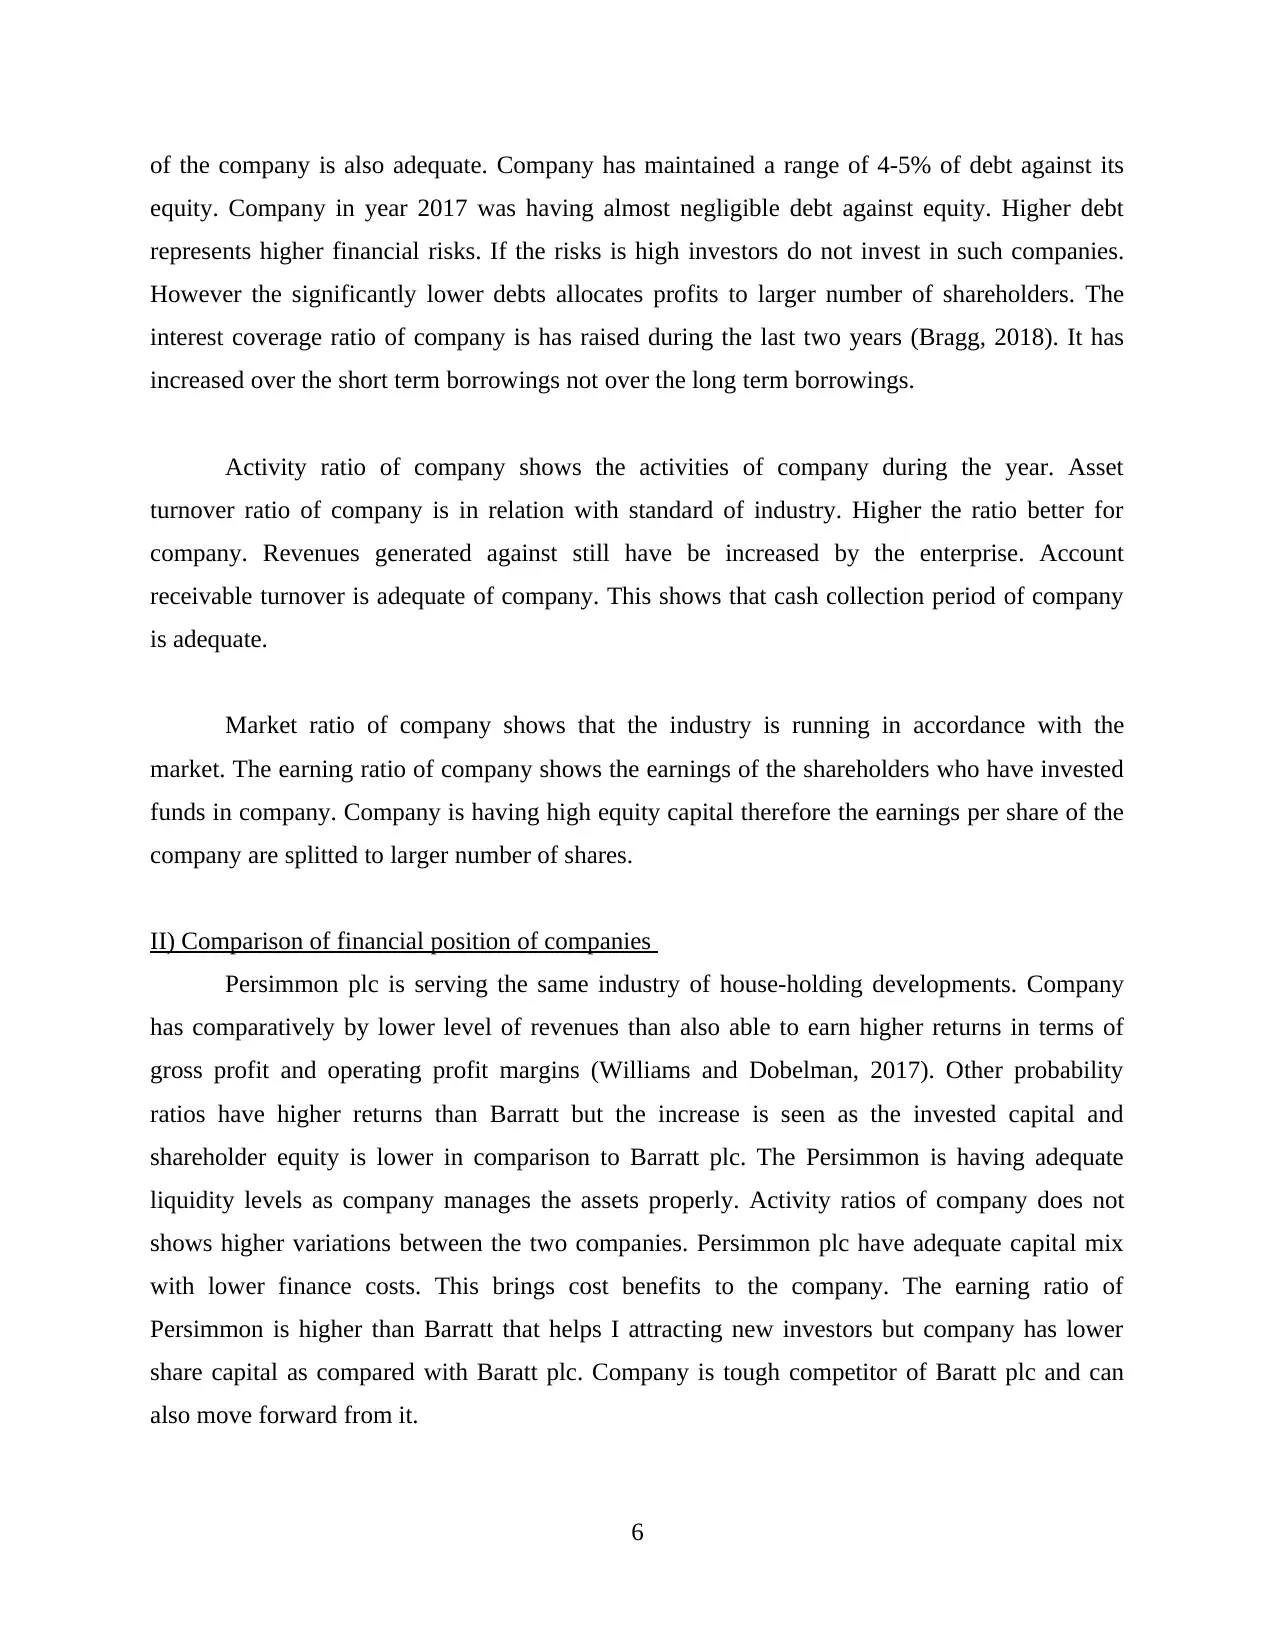
Figure 2Liquid ratio
7
Figure 1Current ratio
Current ratio of the Barrat Development decline sligtly in the year 2016 and 2017 from 3.33 to
3.25. However, then it rise to 3.75 in the year 2018. It can be said that performance improved.
However, decline in the performance was also not matter of concern because value of current
ratio each year is already above standard value 2.
Figure 2Liquid ratio
7
⊘ This is a preview!⊘
Do you want full access?
Subscribe today to unlock all pages.
Trusted by 1+ million students worldwide
Value of liquid ratio is increasing consistently and its growth rate is also increasing on yearly
basis. In the year 2015 value of the ratio was 0.38 which increased to 0.57 in the year 2016. In
the year 2017 value become 0.60 which elevate to 0.78 in the year 2018. It can be said that if
inventory not considered then in that case liquidity is slightly below standard.
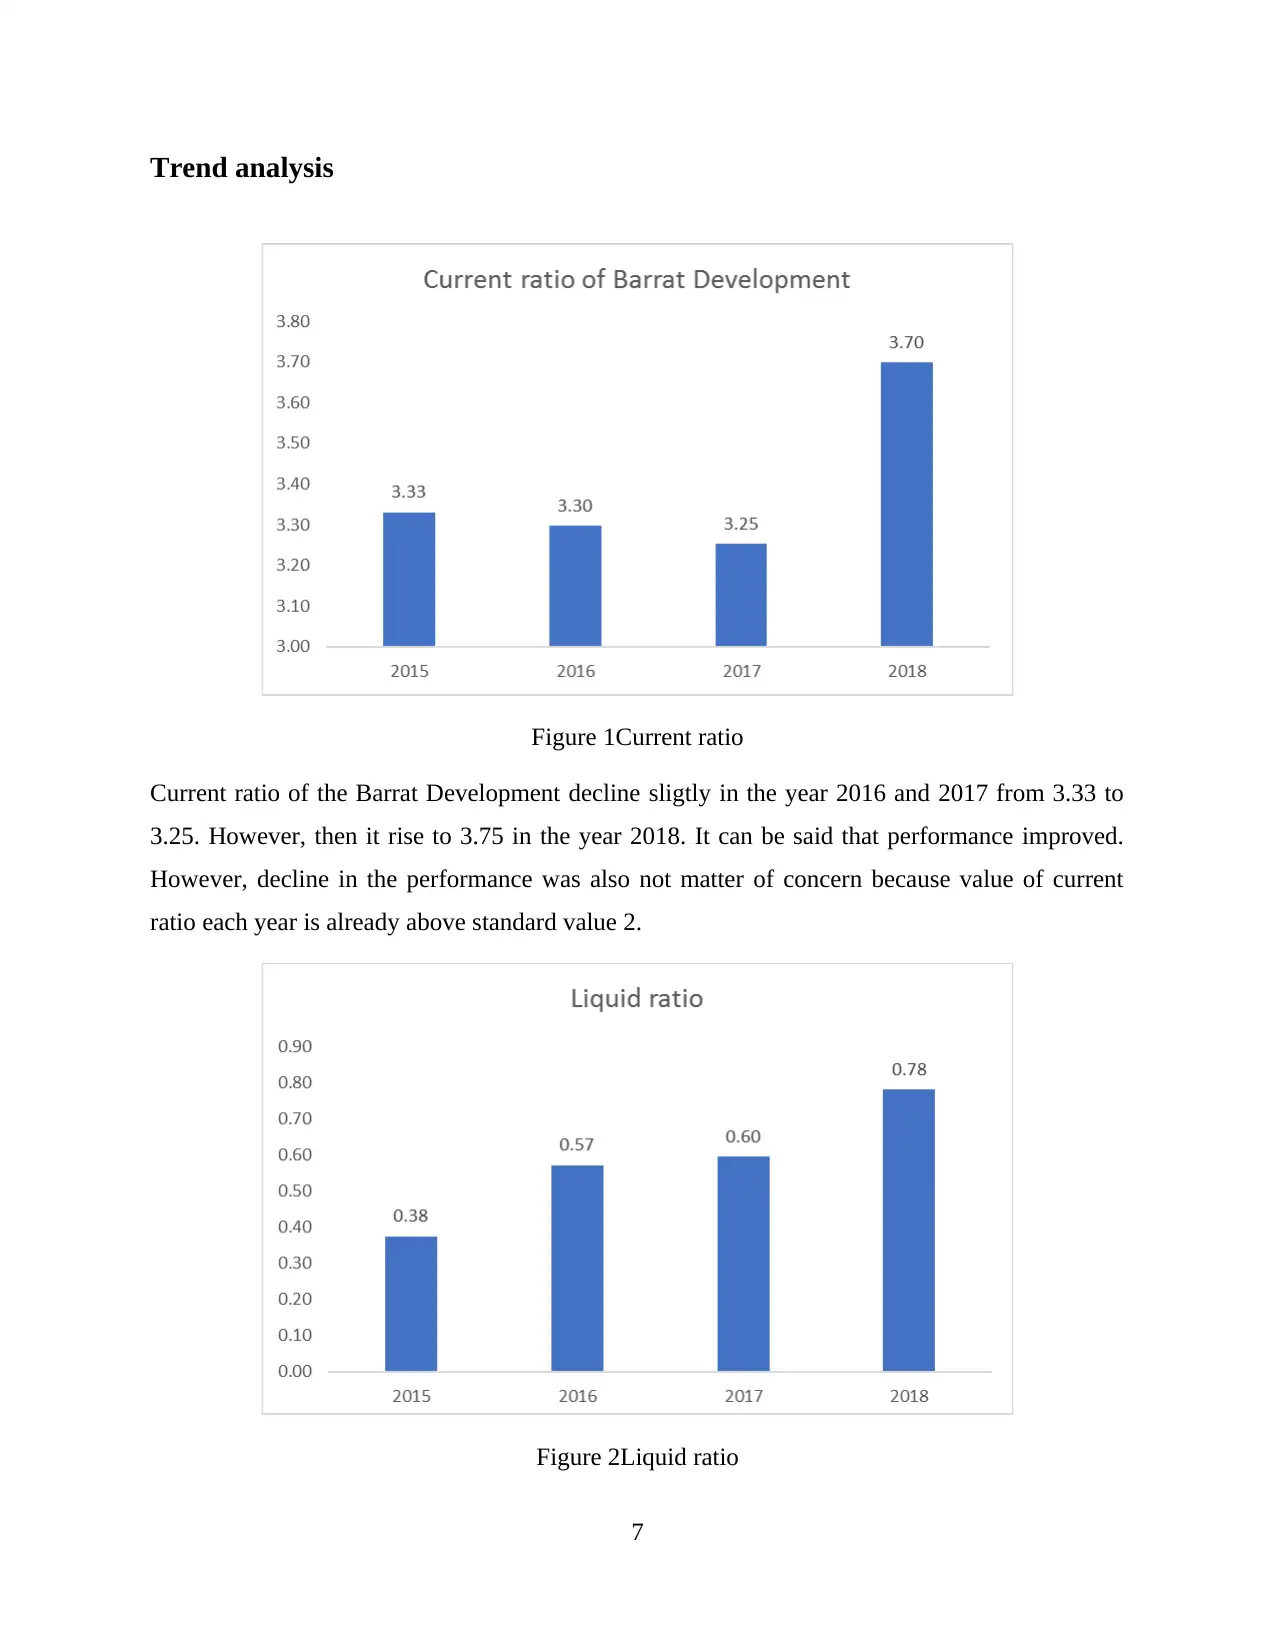
Figure 3Asset turnover ratio
Asset turnover ratio value increased sharply from the year 2015 to 2017 from 1.01 to
1.08. This change is not big and it can be said that asset turnover ratio remains constant in
mentioned time period. In the year 2018 ratio value decline slightly to 1.06. Low value of the
ratio reflects that firm failed to make effective use of asset in its business.
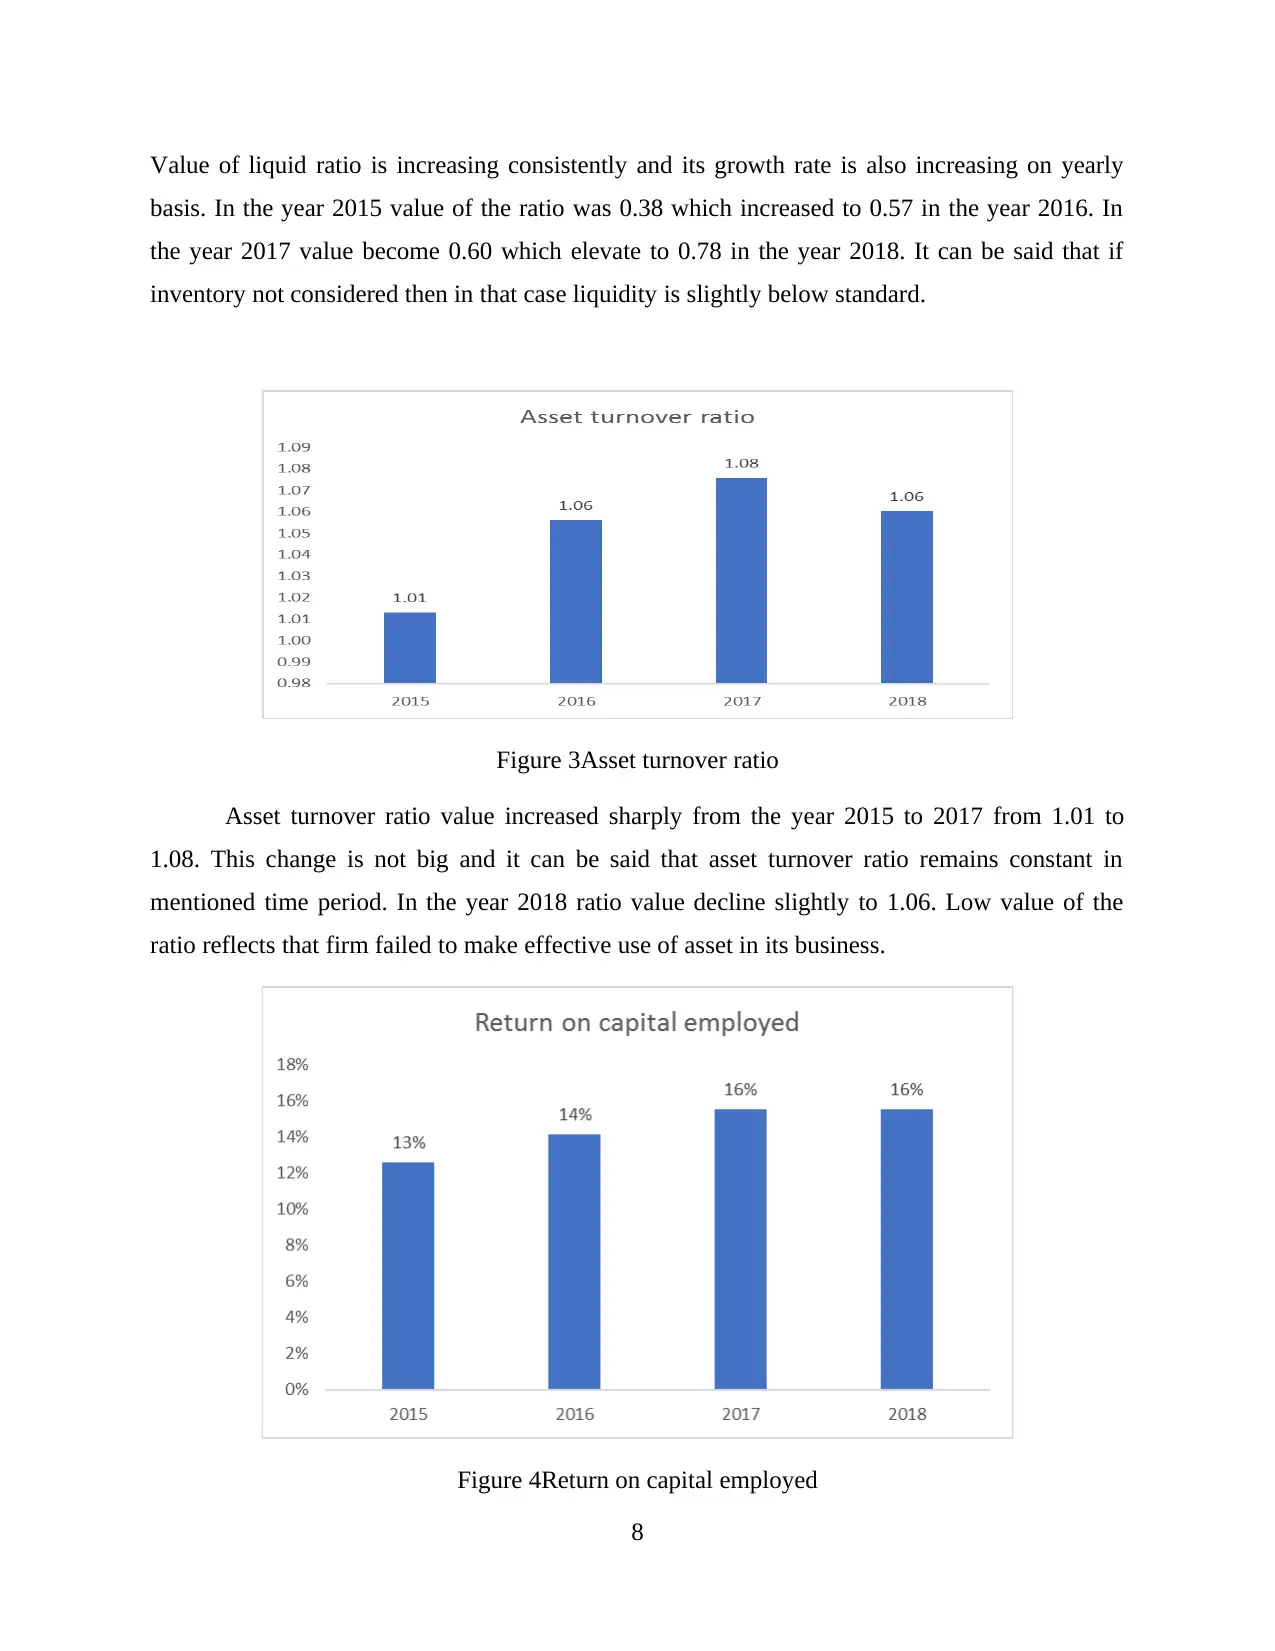
Figure 4Return on capital employed
8
basis. In the year 2015 value of the ratio was 0.38 which increased to 0.57 in the year 2016. In
the year 2017 value become 0.60 which elevate to 0.78 in the year 2018. It can be said that if
inventory not considered then in that case liquidity is slightly below standard.
Figure 3Asset turnover ratio
Asset turnover ratio value increased sharply from the year 2015 to 2017 from 1.01 to
1.08. This change is not big and it can be said that asset turnover ratio remains constant in
mentioned time period. In the year 2018 ratio value decline slightly to 1.06. Low value of the
ratio reflects that firm failed to make effective use of asset in its business.
Figure 4Return on capital employed
8
Paraphrase This Document
Need a fresh take? Get an instant paraphrase of this document with our AI Paraphraser

ROCE or return on capital employed increase from 13% to 16% from the year 2015 to 2017. It
remain constant at 16%. ROCE percentage is apprioporiate and currently constant. Hence, it can
be said that firm perform moderate on this front.
Figure 5Return on equity
Return on equity increased from 15% to 18% from the year 2015 to 2018. Each year increase of
1% is observed. Growth is not satisfactory and it can be said that firm failed to generate efficient
return for its investors.
Figure 6Gross margin percentage
9
There is stability in the firm gross profit ratio and its value increased from 19% to 21%. Such
kind of growth is not so big and it can be said that gross profit ratio remain in the specific range.
However, gross profit ratio is not satisfatory and it need to be improved.
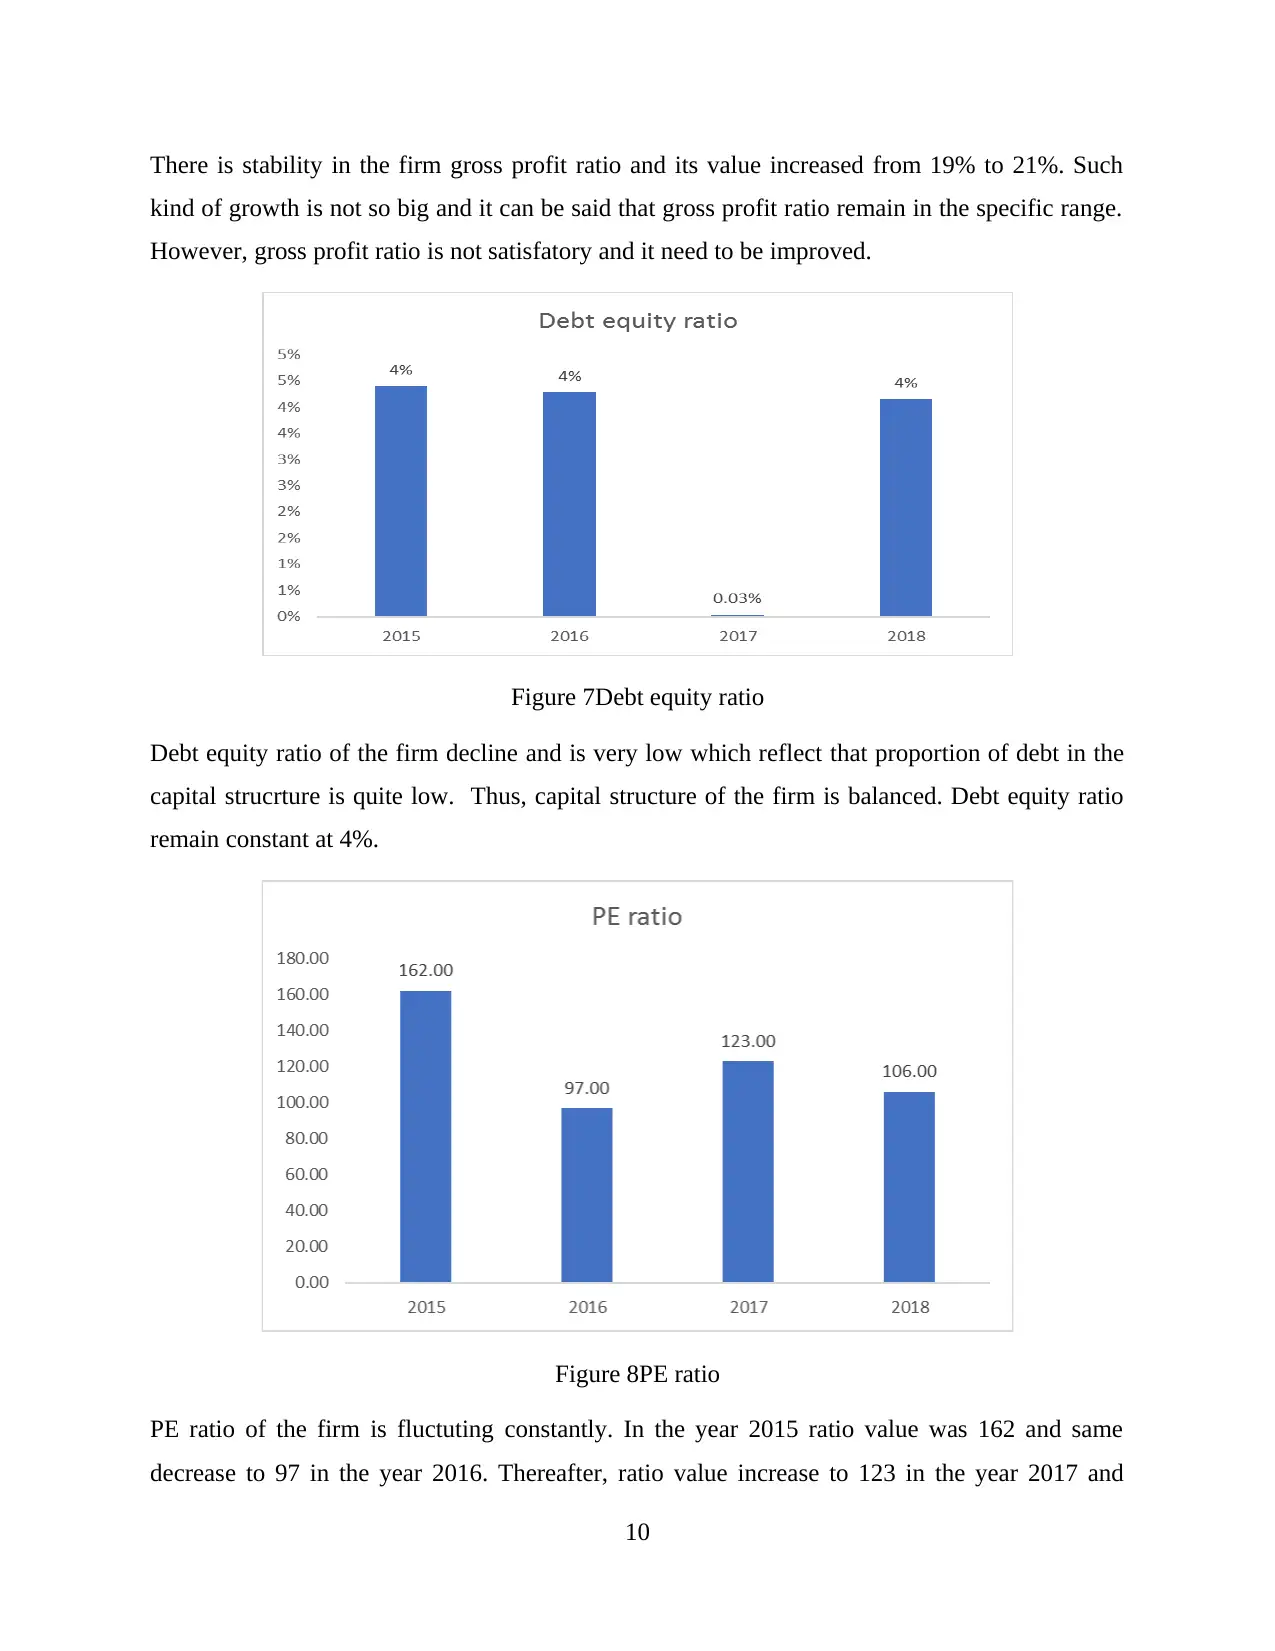
Figure 7Debt equity ratio
Debt equity ratio of the firm decline and is very low which reflect that proportion of debt in the
capital strucrture is quite low. Thus, capital structure of the firm is balanced. Debt equity ratio
remain constant at 4%.
Figure 8PE ratio
PE ratio of the firm is fluctuting constantly. In the year 2015 ratio value was 162 and same
decrease to 97 in the year 2016. Thereafter, ratio value increase to 123 in the year 2017 and
10
kind of growth is not so big and it can be said that gross profit ratio remain in the specific range.
However, gross profit ratio is not satisfatory and it need to be improved.
Figure 7Debt equity ratio
Debt equity ratio of the firm decline and is very low which reflect that proportion of debt in the
capital strucrture is quite low. Thus, capital structure of the firm is balanced. Debt equity ratio
remain constant at 4%.
Figure 8PE ratio
PE ratio of the firm is fluctuting constantly. In the year 2015 ratio value was 162 and same
decrease to 97 in the year 2016. Thereafter, ratio value increase to 123 in the year 2017 and
10
⊘ This is a preview!⊘
Do you want full access?
Subscribe today to unlock all pages.
Trusted by 1+ million students worldwide
1 out of 15
Related Documents


Your All-in-One AI-Powered Toolkit for Academic Success.
+13062052269
info@desklib.com
Available 24*7 on WhatsApp / Email
![[object Object]](/_next/static/media/star-bottom.7253800d.svg)
Unlock your academic potential
Copyright © 2020–2026 A2Z Services. All Rights Reserved. Developed and managed by ZUCOL.