PHM102: Basic Statistics for Public Health Assignment Solution

Verified

Added on  2023/01/11

|5
|702
|90
Homework Assignment
AI Summary
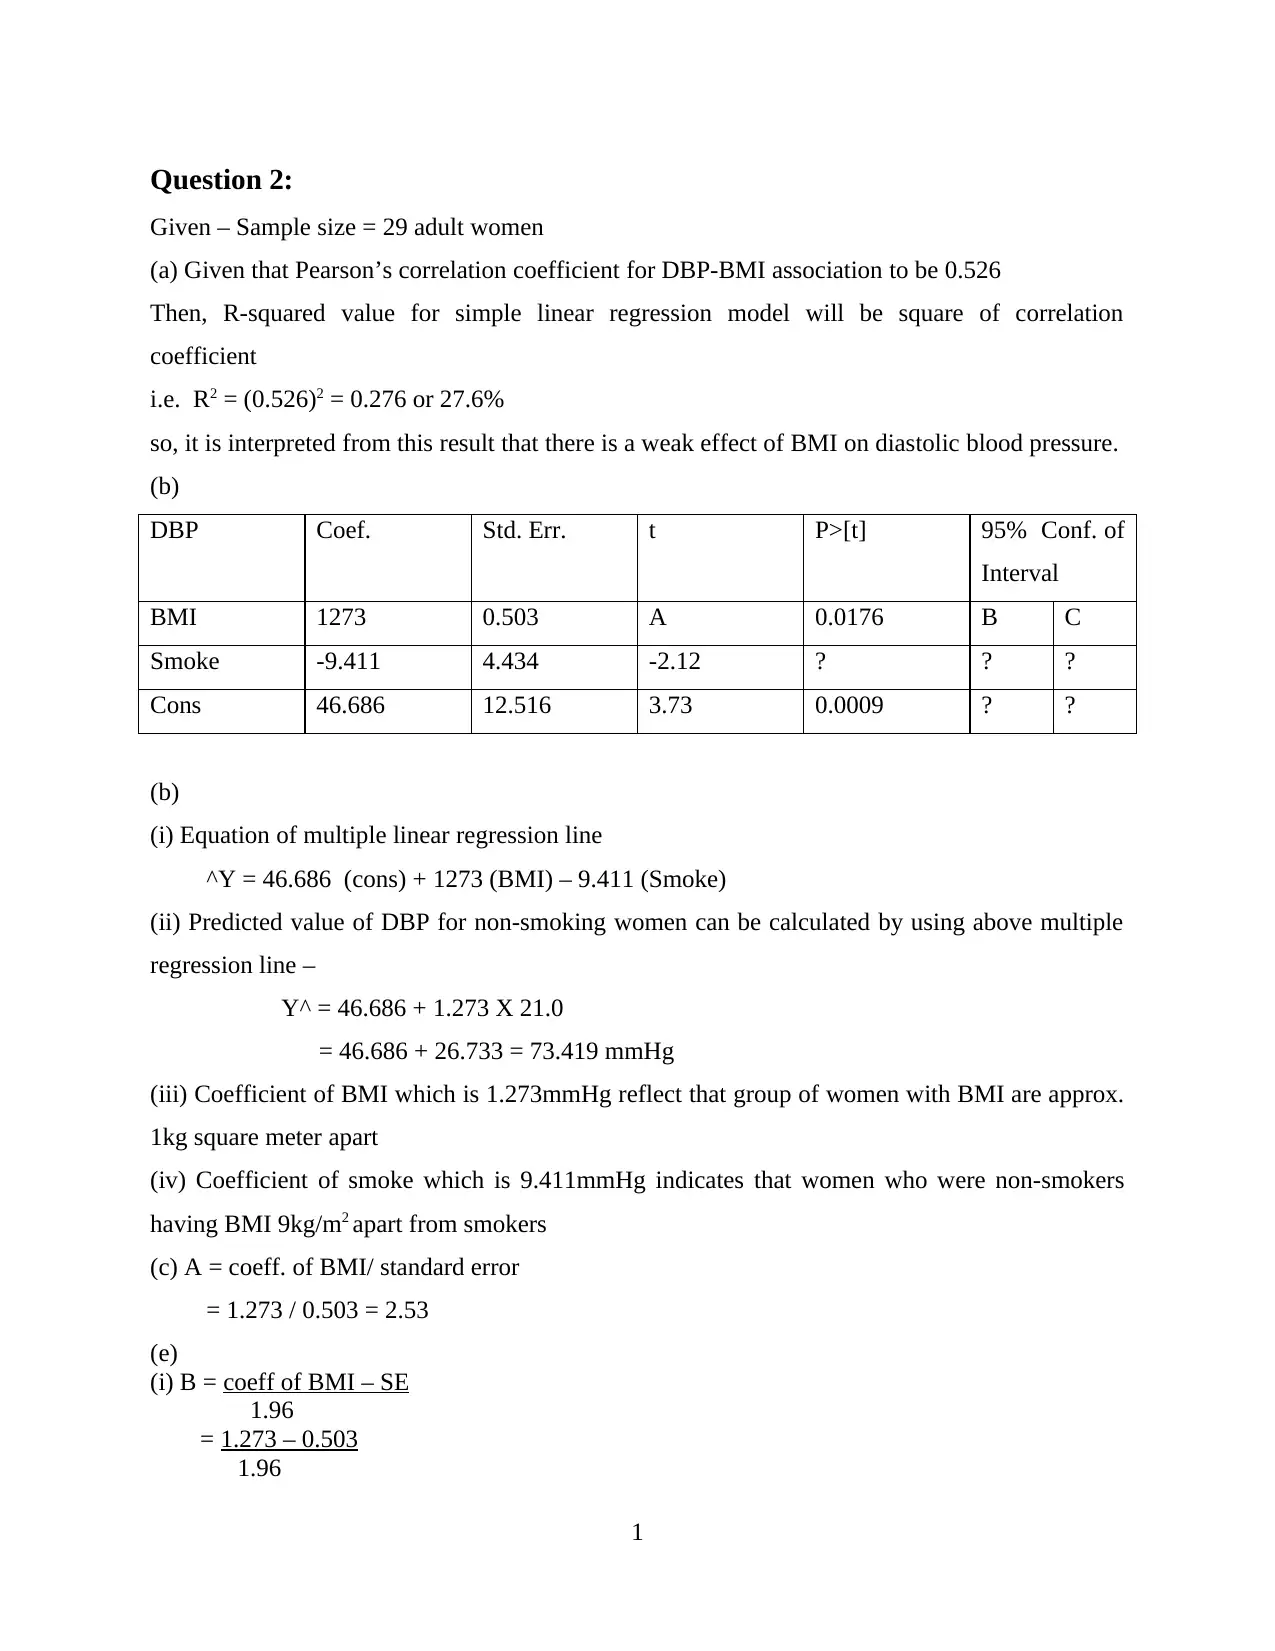
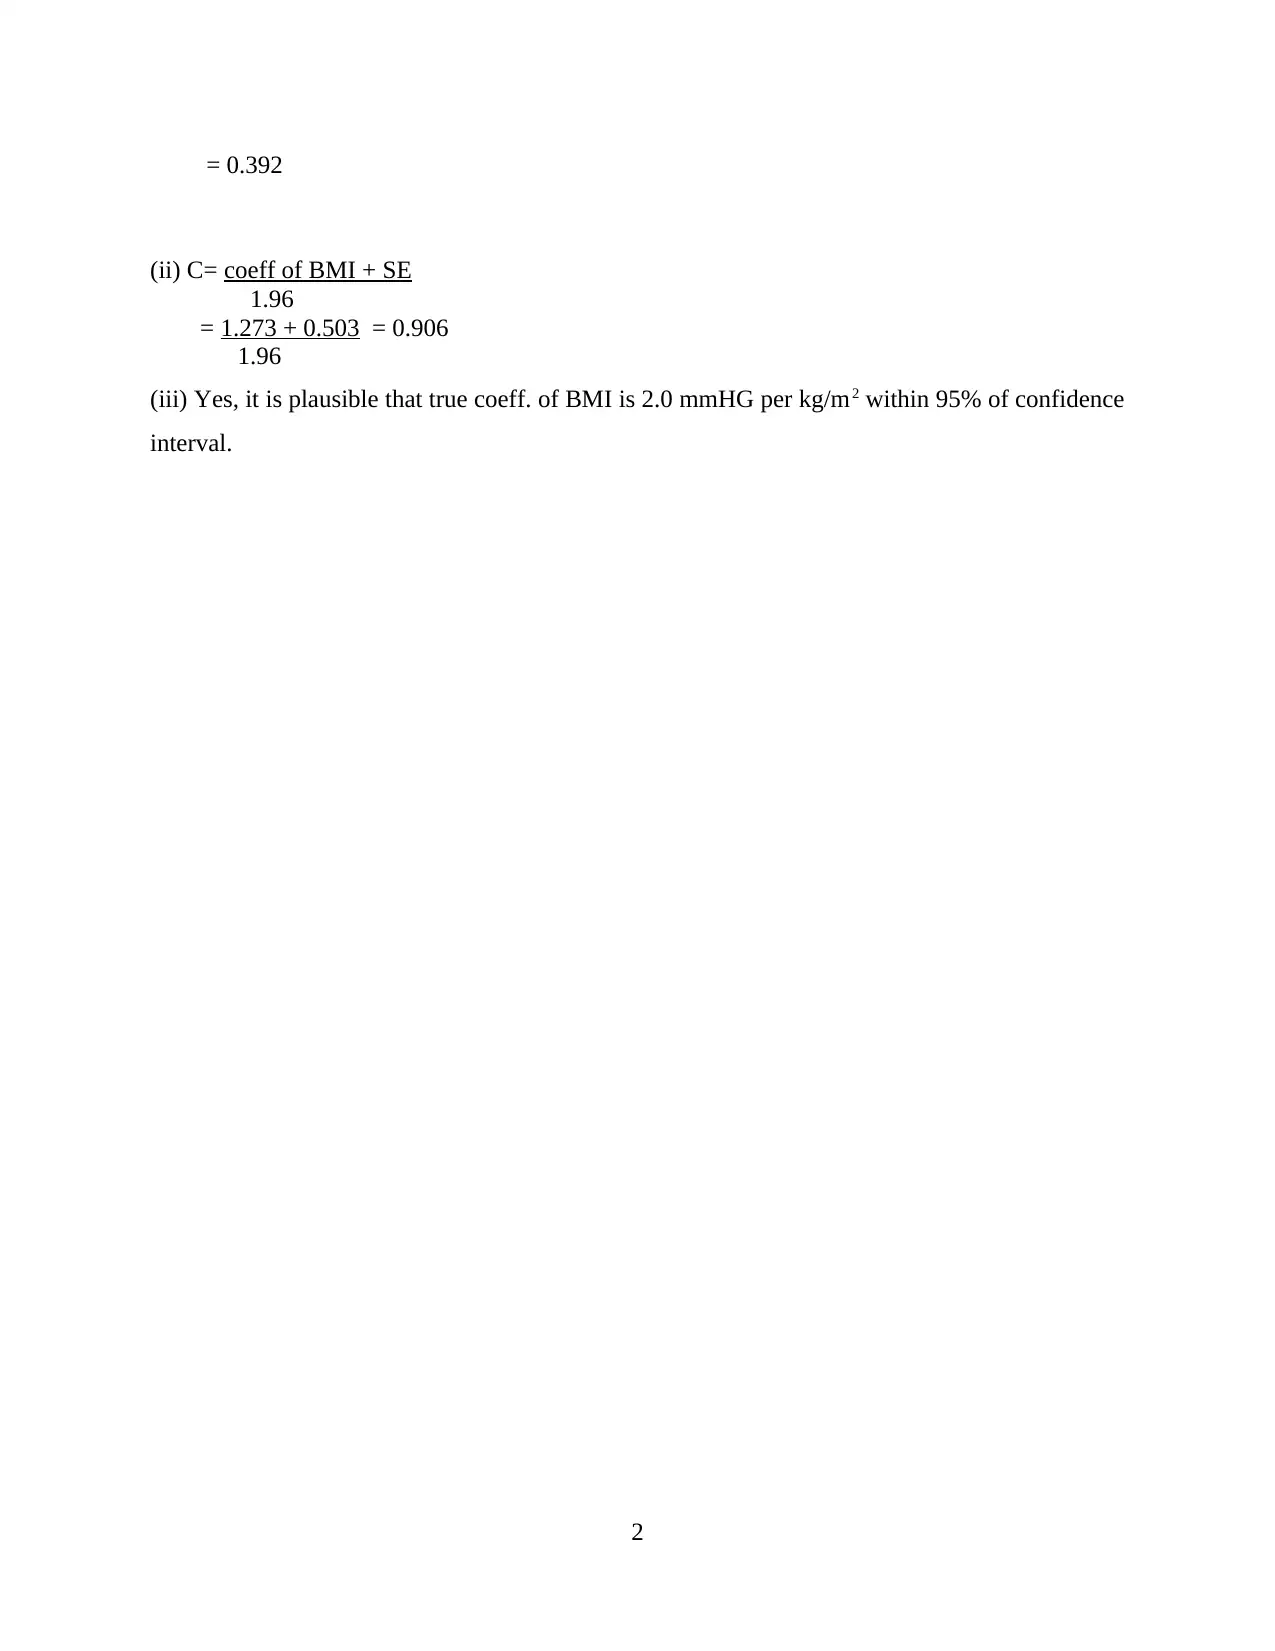
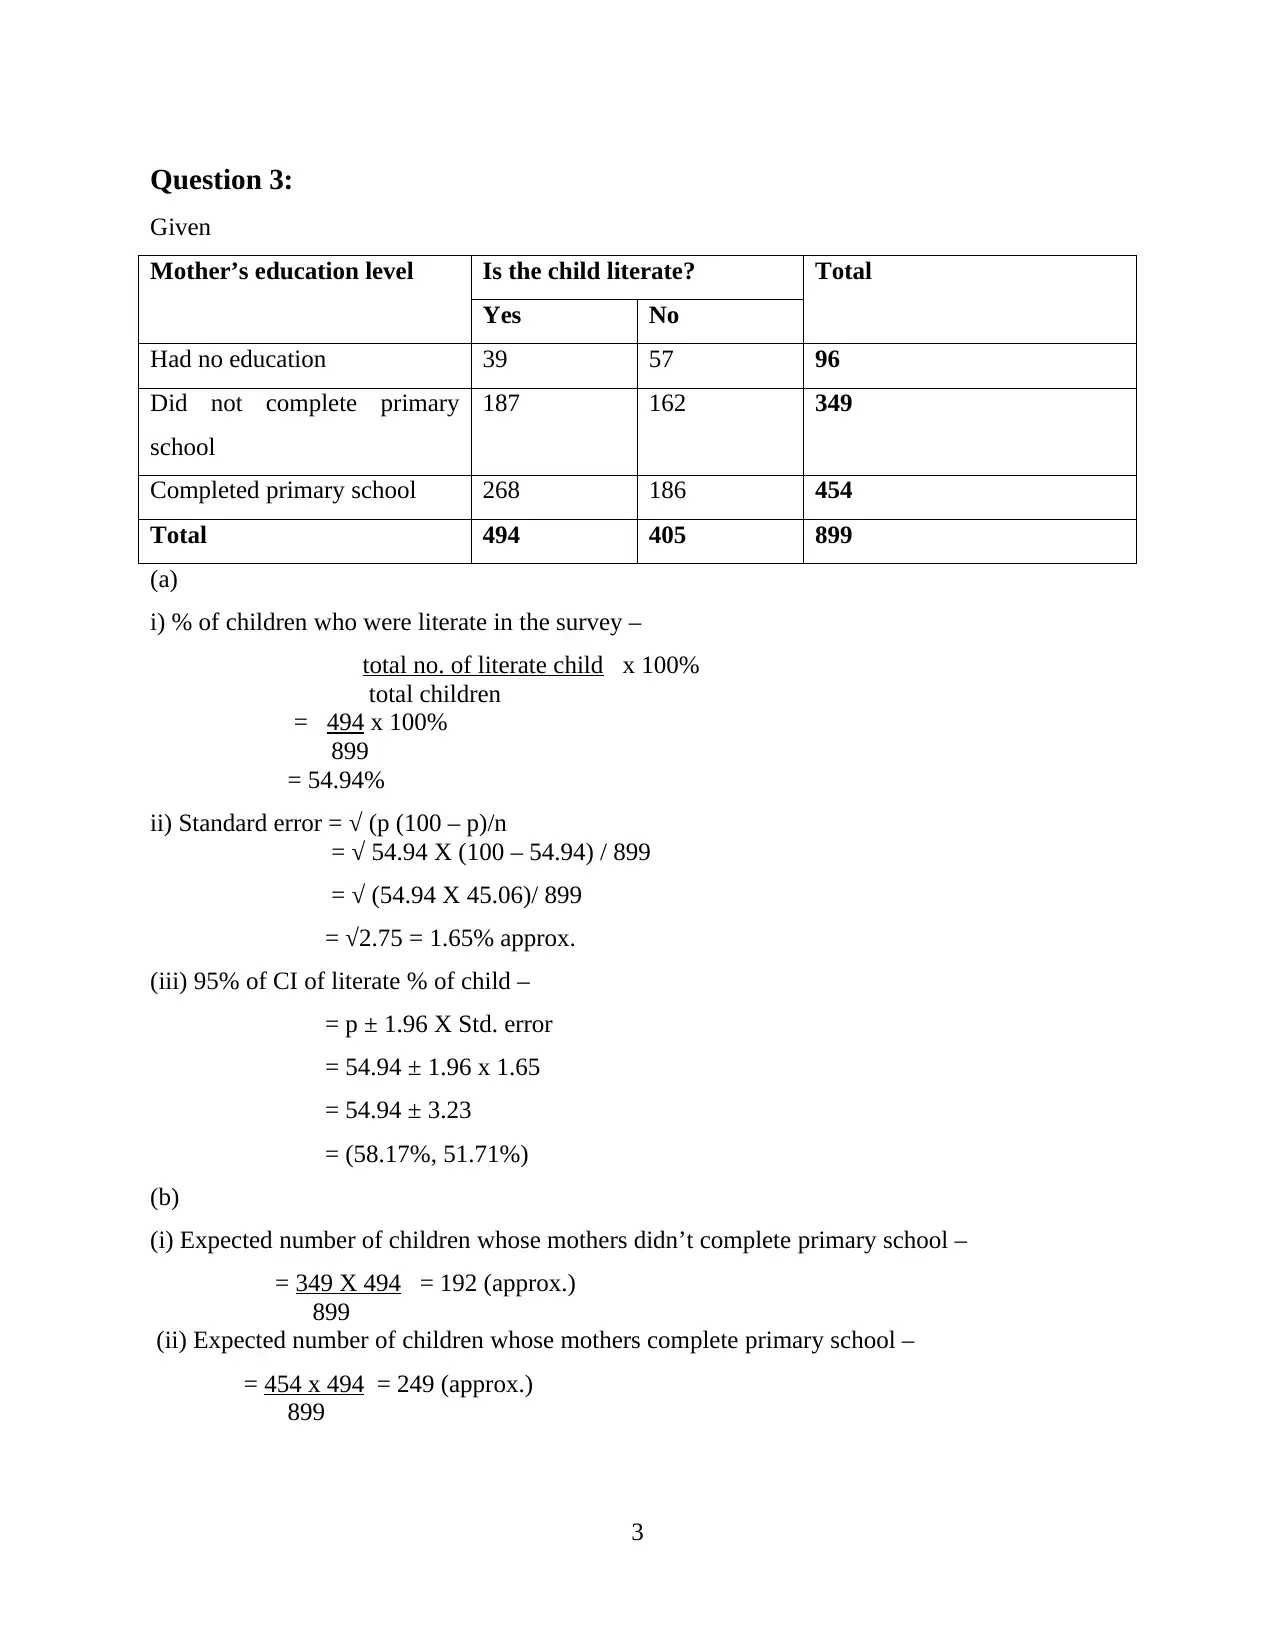
This document presents a comprehensive solution to a medical statistics assignment for a Public Health course (PHM102). The solution addresses two main questions. The first question involves analyzing the relationship between diastolic blood pressure (DBP) and Body Mass Index (BMI) using Pearson's correlation coefficient and a simple linear regression model, including the interpretation of the R-squared value. It also covers multiple linear regression, predicting DBP values, and interpreting coefficients. The second question delves into the analysis of literacy rates among children based on their mother's education level, utilizing percentages, standard errors, and confidence intervals. It also includes expected values using a chi-square test, calculating degrees of freedom, and interpreting p-values to determine the association between maternal education and child literacy, with discussions on the appropriateness of the chi-square test and the implications of the results.
tabler-icon-diamond-filled.svg

Contribute Materials

Your contribution can guide someone’s learning journey. Share your documents today.
Document Page
Medical Statistics
tabler-icon-diamond-filled.svg

Secure Best Marks with AI Grader

Need help grading? Try our AI Grader for instant feedback on your assignments.
Document Page
Question 2:
Given – Sample size = 29 adult women
(a) Given that Pearson’s correlation coefficient for DBP-BMI association to be 0.526
Then, R-squared value for simple linear regression model will be square of correlation
coefficient
i.e. R2 = (0.526)2 = 0.276 or 27.6%
so, it is interpreted from this result that there is a weak effect of BMI on diastolic blood pressure.
(b)
DBP Coef. Std. Err. t P>[t] 95% Conf. of
Interval
BMI 1273 0.503 A 0.0176 B C
Smoke -9.411 4.434 -2.12 ? ? ?
Cons 46.686 12.516 3.73 0.0009 ? ?
(b)
(i) Equation of multiple linear regression line
^Y = 46.686 (cons) + 1273 (BMI) – 9.411 (Smoke)
(ii) Predicted value of DBP for non-smoking women can be calculated by using above multiple
regression line –
Y^ = 46.686 + 1.273 X 21.0
= 46.686 + 26.733 = 73.419 mmHg
(iii) Coefficient of BMI which is 1.273mmHg reflect that group of women with BMI are approx.
1kg square meter apart
(iv) Coefficient of smoke which is 9.411mmHg indicates that women who were non-smokers
having BMI 9kg/m2 apart from smokers
(c) A = coeff. of BMI/ standard error
= 1.273 / 0.503 = 2.53
(e)
(i) B = coeff of BMI – SE
1.96
= 1.273 – 0.503
1.96
1
Document Page
= 0.392
(ii) C= coeff of BMI + SE
1.96
= 1.273 + 0.503 = 0.906
1.96
(iii) Yes, it is plausible that true coeff. of BMI is 2.0 mmHG per kg/m2 within 95% of confidence
interval.
2
Document Page
Question 3:
Given
Mother’s education level Is the child literate? Total
Yes No
Had no education 39 57 96
Did not complete primary
school
187 162 349
Completed primary school 268 186 454
Total 494 405 899
(a)
i) % of children who were literate in the survey –
total no. of literate child x 100%
total children
= 494 x 100%
899
= 54.94%
ii) Standard error = √ (p (100 – p)/n
= √ 54.94 X (100 – 54.94) / 899
= √ (54.94 X 45.06)/ 899
= √2.75 = 1.65% approx.
(iii) 95% of CI of literate % of child –
= p ± 1.96 X Std. error
= 54.94 ± 1.96 x 1.65
= 54.94 ± 3.23
= (58.17%, 51.71%)
(b)
(i) Expected number of children whose mothers didn’t complete primary school –
= 349 X 494 = 192 (approx.)
899
(ii) Expected number of children whose mothers complete primary school –
= 454 x 494 = 249 (approx.)
899
3
tabler-icon-diamond-filled.svg

Secure Best Marks with AI Grader

Need help grading? Try our AI Grader for instant feedback on your assignments.
Document Page
(iii) Expected number of children whose mothers had no education –
= 96 x 494 = 52 (approx.)
899
(c)
Degrees of freedom = (n – 1) (r – 1)
= (3 – 1) (2 – 1) = 2
(ii) p-value can be calculated by using 2-sided ANOVA at 2 degrees of freedom
So, using A5 table, p-value will be lie between 0.001 to 0.005
(iii) It has been concluded from this test that null hypothesis of no true association between
mother’s education and child’s literacy in the population is rejected.
(d)
(i) Maternal education level is an ordered categorical variable
(ii) If Chi-square test will be applied on given scenario, then it will give better result.
(iii) If test obtained p-value of 0.0013 then again null hypothesis will be rejected i.e. proportion
of children of educated mother is relatively higher.
4
chevron_up_icon
1 out of 5
circle_padding
hide_on_mobile
zoom_out_icon
logo.png

Your All-in-One AI-Powered Toolkit for Academic Success.

Available 24*7 on WhatsApp / Email

[object Object]