Data Analytics: Bayesian Network Coursework ECS648U/ECS784U/ECS784P
VerifiedAdded on 2022/01/21
|14
|4150
|209
Project
AI Summary
This coursework assignment for a Data Analytics module (ECS648U/ECS784U/ECS784P) requires students to implement and analyze Bayesian networks using the Bayesys software. The assignment involves setting up the Bayesys environment, selecting or collating a dataset, preparing the data for structure learning (including discretization and handling missing values), and creating a knowledge-based causal graph. Students are then tasked with running structure learning algorithms (SaiyanH, HC, and TABU) and evaluating the results, including comparing the learned graphs to the knowledge graph. The coursework includes answering questions about the research area, dataset selection, the process of creating the knowledge graph, and the performance of different algorithms, with a focus on understanding and applying Bayesian network concepts to real-world data analysis problems. The assignment is worth 50 marks and has a submission deadline, with late submission penalties and guidelines for extenuating circumstances. The student must submit a single PDF file containing all answers to the questions.
1
Bayesian coursework specification for 2021
Data Analytics ECS648U/ ECS784U/ ECS784P
Revised on 25/02/2021 by Dr Anthony Constantinou and Dr Neville Kenneth Kitson.
1. Important Dates
• Release date: Thursday 25th February 2021 at 10:00 AM.
• Submission deadline: Wednesday, 28th April 2021 at 10:00 AM.
• Late submission deadline (cumulative penalty applies): Within 7 days after deadline.
General information:
i. When submitting coursework online you receive an automated e-mail as proof of
submission. Turnitin receipt does not constitute proof of submission. Some students
will sometimes upload their coursework and not hit the submit button. Make sure you
fully complete the submission process.
ii. A penalty will be applied automatically by the system for late submissions.
a. Your lecturer cannot remove the penalty!
b. Penalties can only be challenged via submission of an Extenuating
Circumstances (EC) form which can be found on your Student Support page.
All the information you need to know is on that page; including how to submit
an EC claim along with the deadline dates and full guidelines.
c. If you submit an EC form, your case will be reviewed by a panel and the panel
will make a decision on the penalty and inform the Module Organiser.
iii. If you miss both the submission deadline and the late submission deadline, you will
automatically receive a score of 0. Extensions can only be granted through approval
of an EC claim.
iv. Submissions via e-mail are not accepted.
v. It is recommended by the School that we set the deadline at 10:00 AM. Do not wait
until the very last moment to submit the coursework.
vi. Your submission should be a single PDF file.
vii. For more details on submission regulations, please refer to your relevant handbook.
Paraphrase This Document
Need a fresh take? Get an instant paraphrase of this document with our AI Paraphraser
2
2. Coursework overview
• The coursework is based on the Bayesian material and must be completed individually
(group submissions will not be accepted).
• To complete the coursework, follow the tasks below and answer ALL questions
enumerated in Section 3. It is recommended that you read the full document before you
start completing the tasks enumerated below.
• What follows has been tested on Windows and MAC operating systems. There is a
compatibility issue with MAC OS (and likely to extend to Linux) which is covered in
the Bayesys manual (details below), but which does not influence the coursework
submission requirements.
Task 1: Set up and reading
a) Visit http://bayesian-ai.eecs.qmul.ac.uk/bayesys/
b) Download the Bayesys user manual.
c) Set up the project by following the steps in Section 1 of the manual.
d) Read Section 2 of the manual.
e) Read Section 3.
f) Read Section 4.
g) Skip Section 5.
h) Read Section 6 and repeat the example.
i. MAC and Linux users will not be able to view the PDF graphs shown in Fig
6.1; i.e., the compatibility issue involves the PDF file generator.
ii. Skip subsections 6.3, 6.3.1, and 6.4.
i) Skip Section 7.
j) Skip Section 8.
k) Read Section 9.
l) Skip the appendices.
Task 2: Determine research area and collate data
You are free to choose or collate your own dataset. You should also determine the dataset
size, both in terms of the number of variables and the sample size, relevant to the problem
you are analysing. Some areas might require more data than others, and it is up to you to
make this decision.
3
You should address a data-related problem in your professional field or a field you are
interested in. If you are motivated in the subject matter the project will be more fun for you
and you will likely produce a better report. Section 5 provides a list of data sources you could
consider.
You are allowed to reuse the dataset you prepared during the Python coursework, as long as
a) your Python coursework submission was NOT a group submission, and b) you consider
the dataset to be suitable for Bayesian network structure learning (refer to Q1 in Section 3).
Lastly, you are not allowed to reuse datasets from the Bayesys repository for this
coursework.
Task 3: Prepare your dataset for structure learning
a) The Bayesys structure learning system assumes the input data are discrete; e.g.,
low/medium/high or Yellow/Blue/Green, rather than a continuous range of numbers.
If you have a continuous variable in your dataset with integers ranging, for example,
from 1 to 100, the algorithm will assume that this variable has 100 different states
(and many more if the values are not integer). This will make the dimensionality of
the model unmanageable, leading to poor accuracy and high runtime; if this is not
clear why, refer to the Conditional Probability Tables (CPTs) in the lecture slides and
relevant book material.
You should discretise continuous variables to reduce the number of states to
reasonable levels. For example, you could discretise the variable discussed above,
with values ranging from 1 to 100, into the five states {“1to20”, “21to40”, “41to60”,
“61to80”, “81to100”}. If a continuous variable incorporates a small number of
different values (e.g., less than 10), it may not need discretisation.
It is up to you to determine whether a variable requires discretisation, as well
as the level of discretisation. You are free to follow any approach you wish to
discretise the variable, including discretising the variables manually as discussed in
the above example. The structure learning accuracy is not expected to be strongly
influenced as long as the dimensionality of the data is reasonable with respect to its
sample size.
b) Your dataset must not have missing values (i.e., empty cells). Replace ALL empty
cells with the value ‘missing’ (or use a different relevant name). This forces the
algorithm to consider all missing values as an additional state. If missing data follows
a pattern, this may or may not help the algorithm to produce a more accurate graph.
c) Rename your dataset to trainingData.csv and place it in folder Input.
⊘ This is a preview!⊘
Do you want full access?
Subscribe today to unlock all pages.
Trusted by 1+ million students worldwide
4
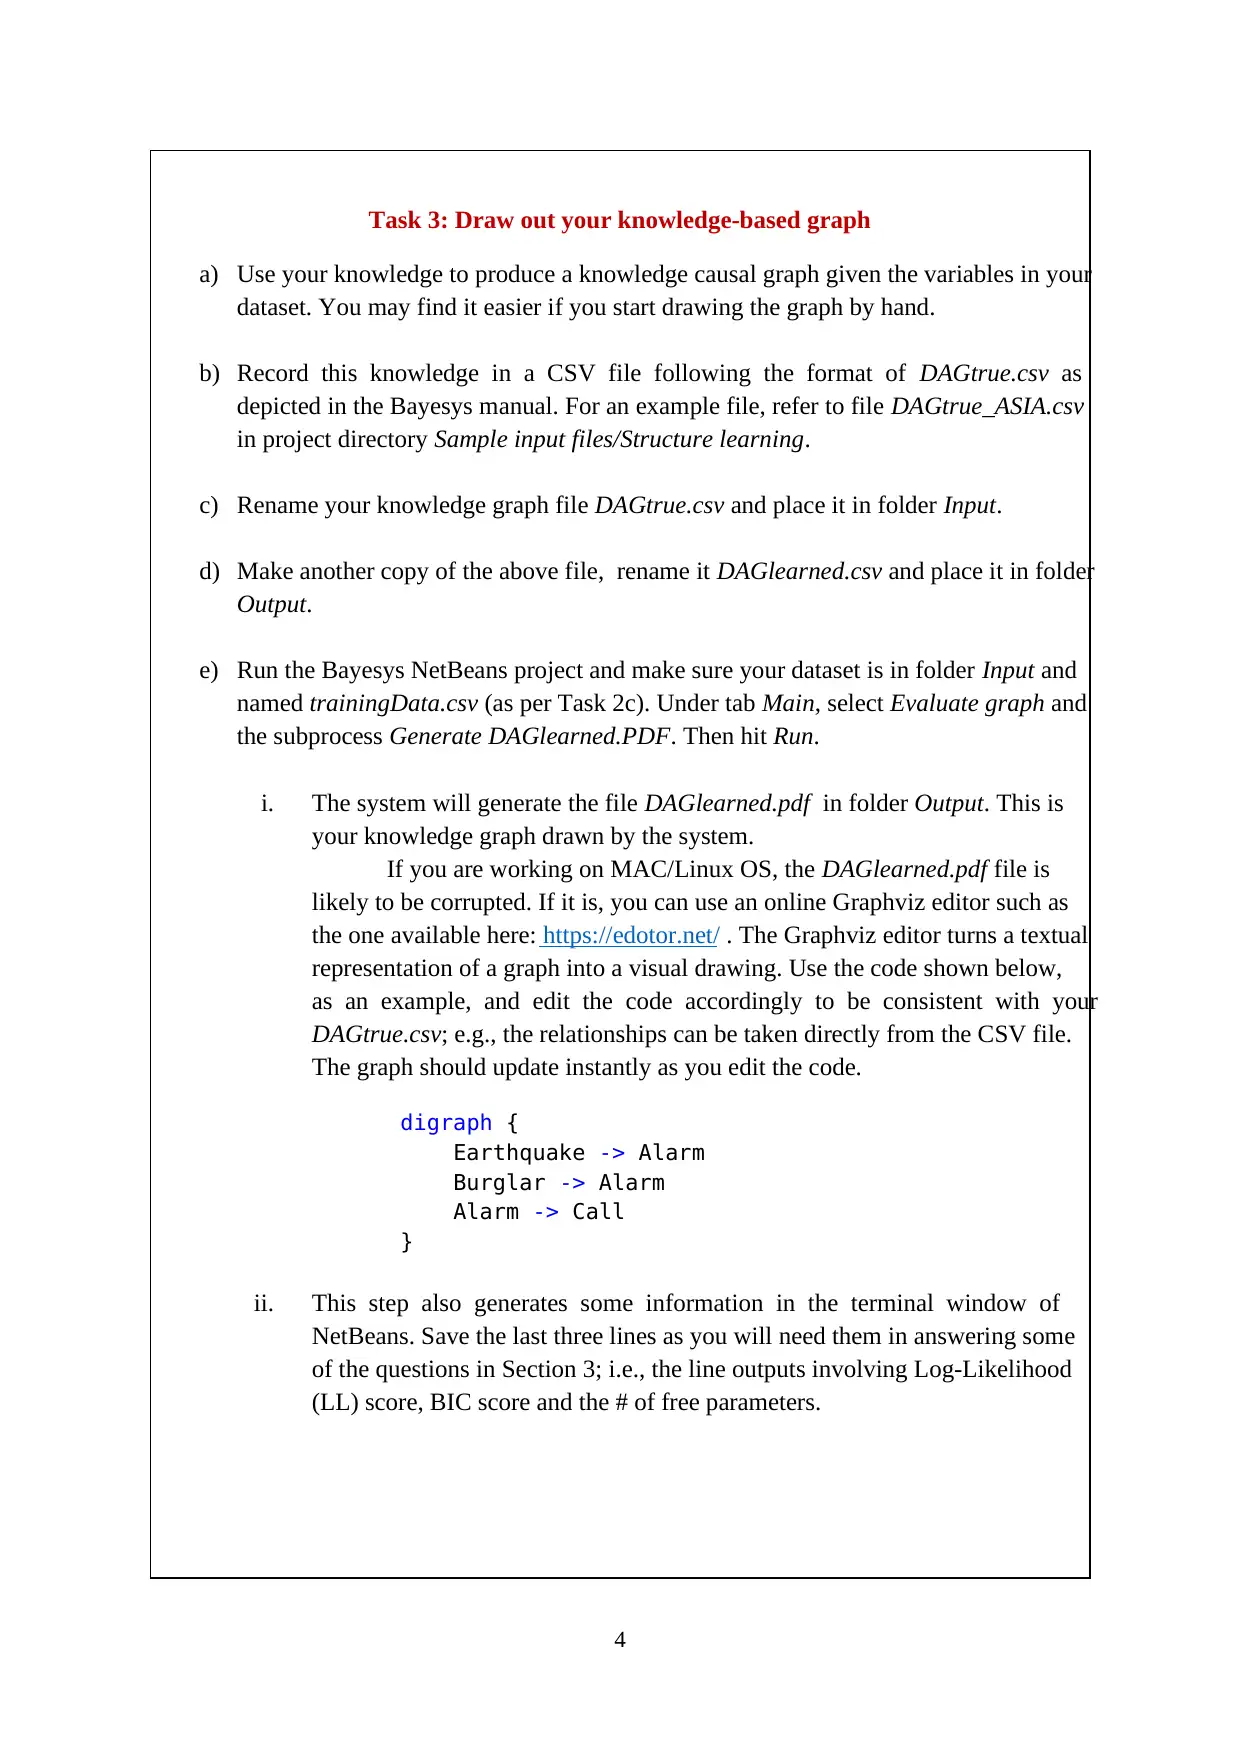
Task 3: Draw out your knowledge-based graph
a) Use your knowledge to produce a knowledge causal graph given the variables in your
dataset. You may find it easier if you start drawing the graph by hand.
b) Record this knowledge in a CSV file following the format of DAGtrue.csv as
depicted in the Bayesys manual. For an example file, refer to file DAGtrue_ASIA.csv
in project directory Sample input files/Structure learning.
c) Rename your knowledge graph file DAGtrue.csv and place it in folder Input.
d) Make another copy of the above file, rename it DAGlearned.csv and place it in folder
Output.
e) Run the Bayesys NetBeans project and make sure your dataset is in folder Input and
named trainingData.csv (as per Task 2c). Under tab Main, select Evaluate graph and
the subprocess Generate DAGlearned.PDF. Then hit Run.
i. The system will generate the file DAGlearned.pdf in folder Output. This is
your knowledge graph drawn by the system.
If you are working on MAC/Linux OS, the DAGlearned.pdf file is
likely to be corrupted. If it is, you can use an online Graphviz editor such as
the one available here: https://edotor.net/ . The Graphviz editor turns a textual
representation of a graph into a visual drawing. Use the code shown below,
as an example, and edit the code accordingly to be consistent with your
DAGtrue.csv; e.g., the relationships can be taken directly from the CSV file.
The graph should update instantly as you edit the code.
digraph {
Earthquake -> Alarm
Burglar -> Alarm
Alarm -> Call
}
ii. This step also generates some information in the terminal window of
NetBeans. Save the last three lines as you will need them in answering some
of the questions in Section 3; i.e., the line outputs involving Log-Likelihood
(LL) score, BIC score and the # of free parameters.
Paraphrase This Document
Need a fresh take? Get an instant paraphrase of this document with our AI Paraphraser
5
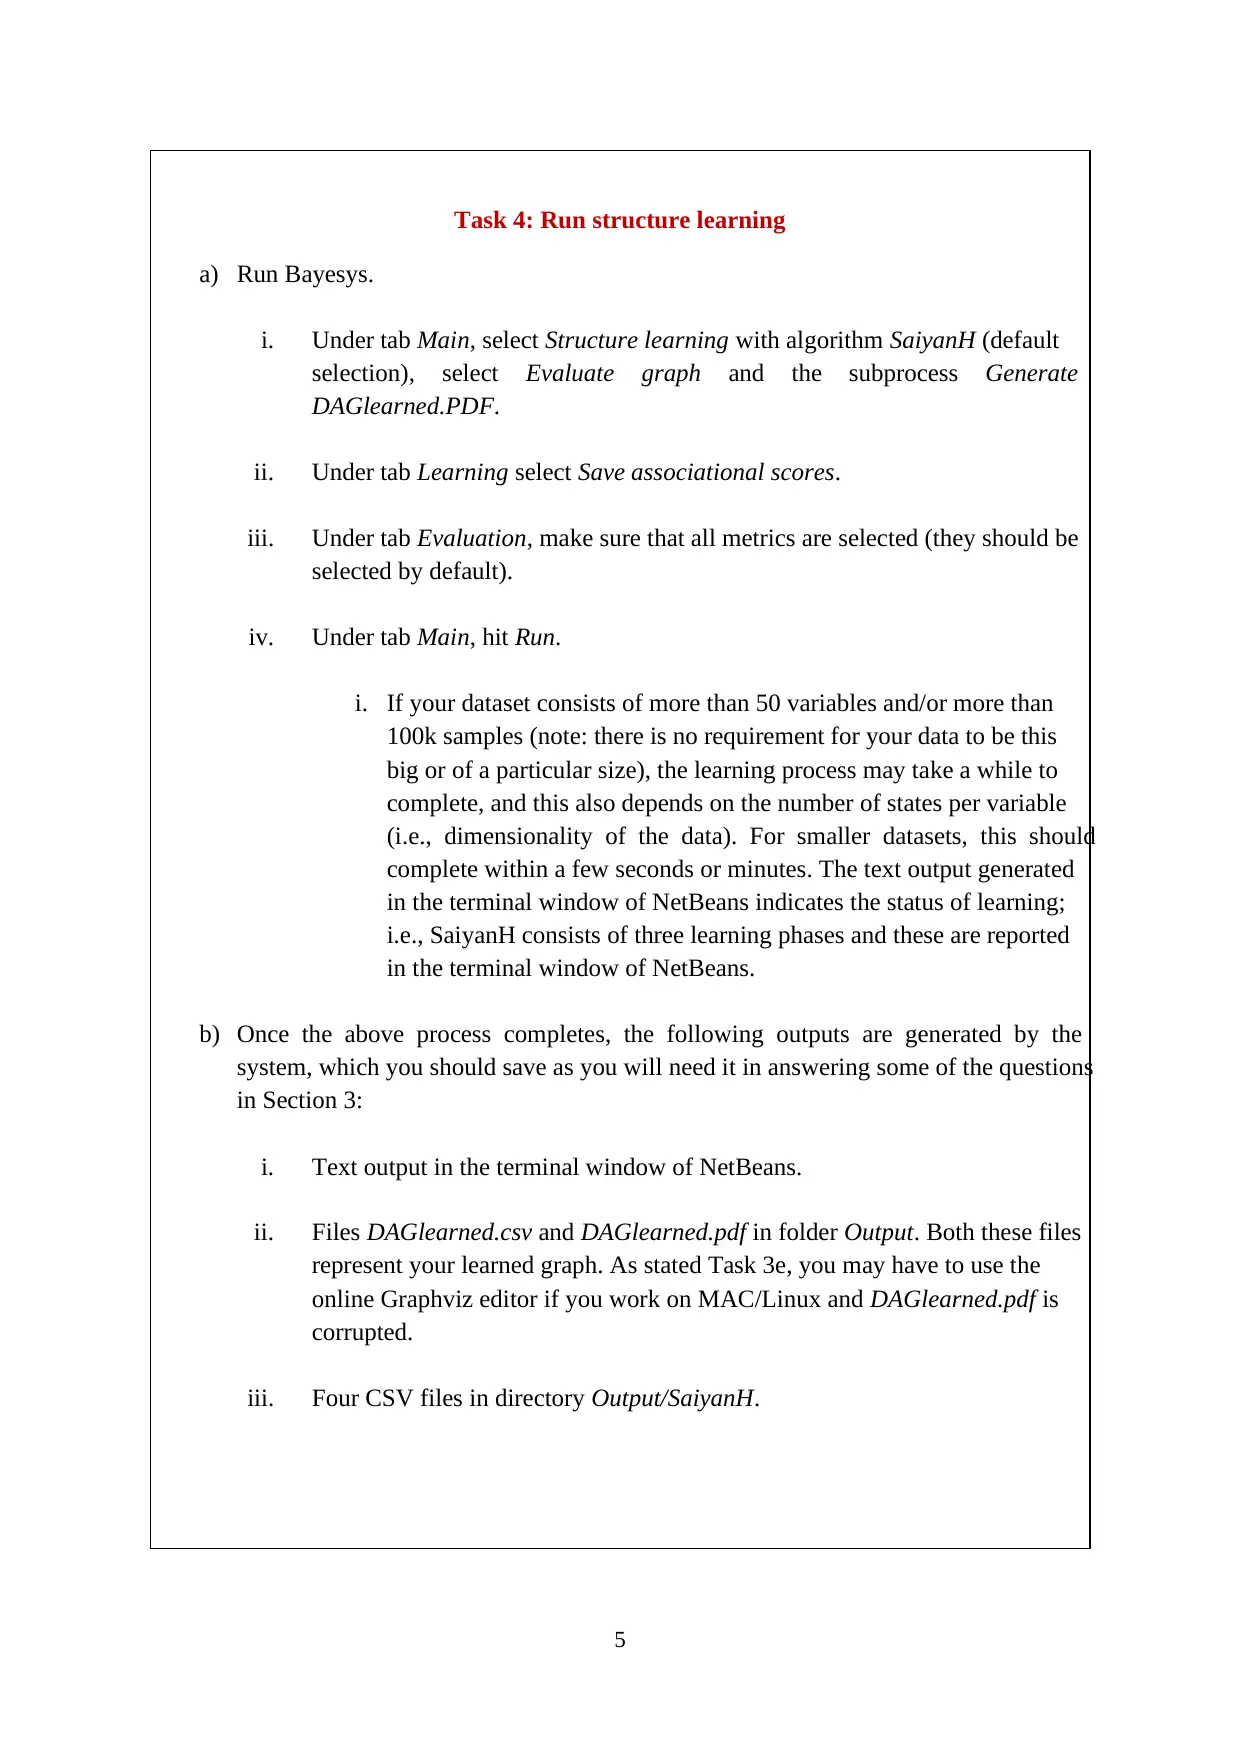
Task 4: Run structure learning
a) Run Bayesys.
i. Under tab Main, select Structure learning with algorithm SaiyanH (default
selection), select Evaluate graph and the subprocess Generate
DAGlearned.PDF.
ii. Under tab Learning select Save associational scores.
iii. Under tab Evaluation, make sure that all metrics are selected (they should be
selected by default).
iv. Under tab Main, hit Run.
i. If your dataset consists of more than 50 variables and/or more than
100k samples (note: there is no requirement for your data to be this
big or of a particular size), the learning process may take a while to
complete, and this also depends on the number of states per variable
(i.e., dimensionality of the data). For smaller datasets, this should
complete within a few seconds or minutes. The text output generated
in the terminal window of NetBeans indicates the status of learning;
i.e., SaiyanH consists of three learning phases and these are reported
in the terminal window of NetBeans.
b) Once the above process completes, the following outputs are generated by the
system, which you should save as you will need it in answering some of the questions
in Section 3:
i. Text output in the terminal window of NetBeans.
ii. Files DAGlearned.csv and DAGlearned.pdf in folder Output. Both these files
represent your learned graph. As stated Task 3e, you may have to use the
online Graphviz editor if you work on MAC/Linux and DAGlearned.pdf is
corrupted.
iii. Four CSV files in directory Output/SaiyanH.
6
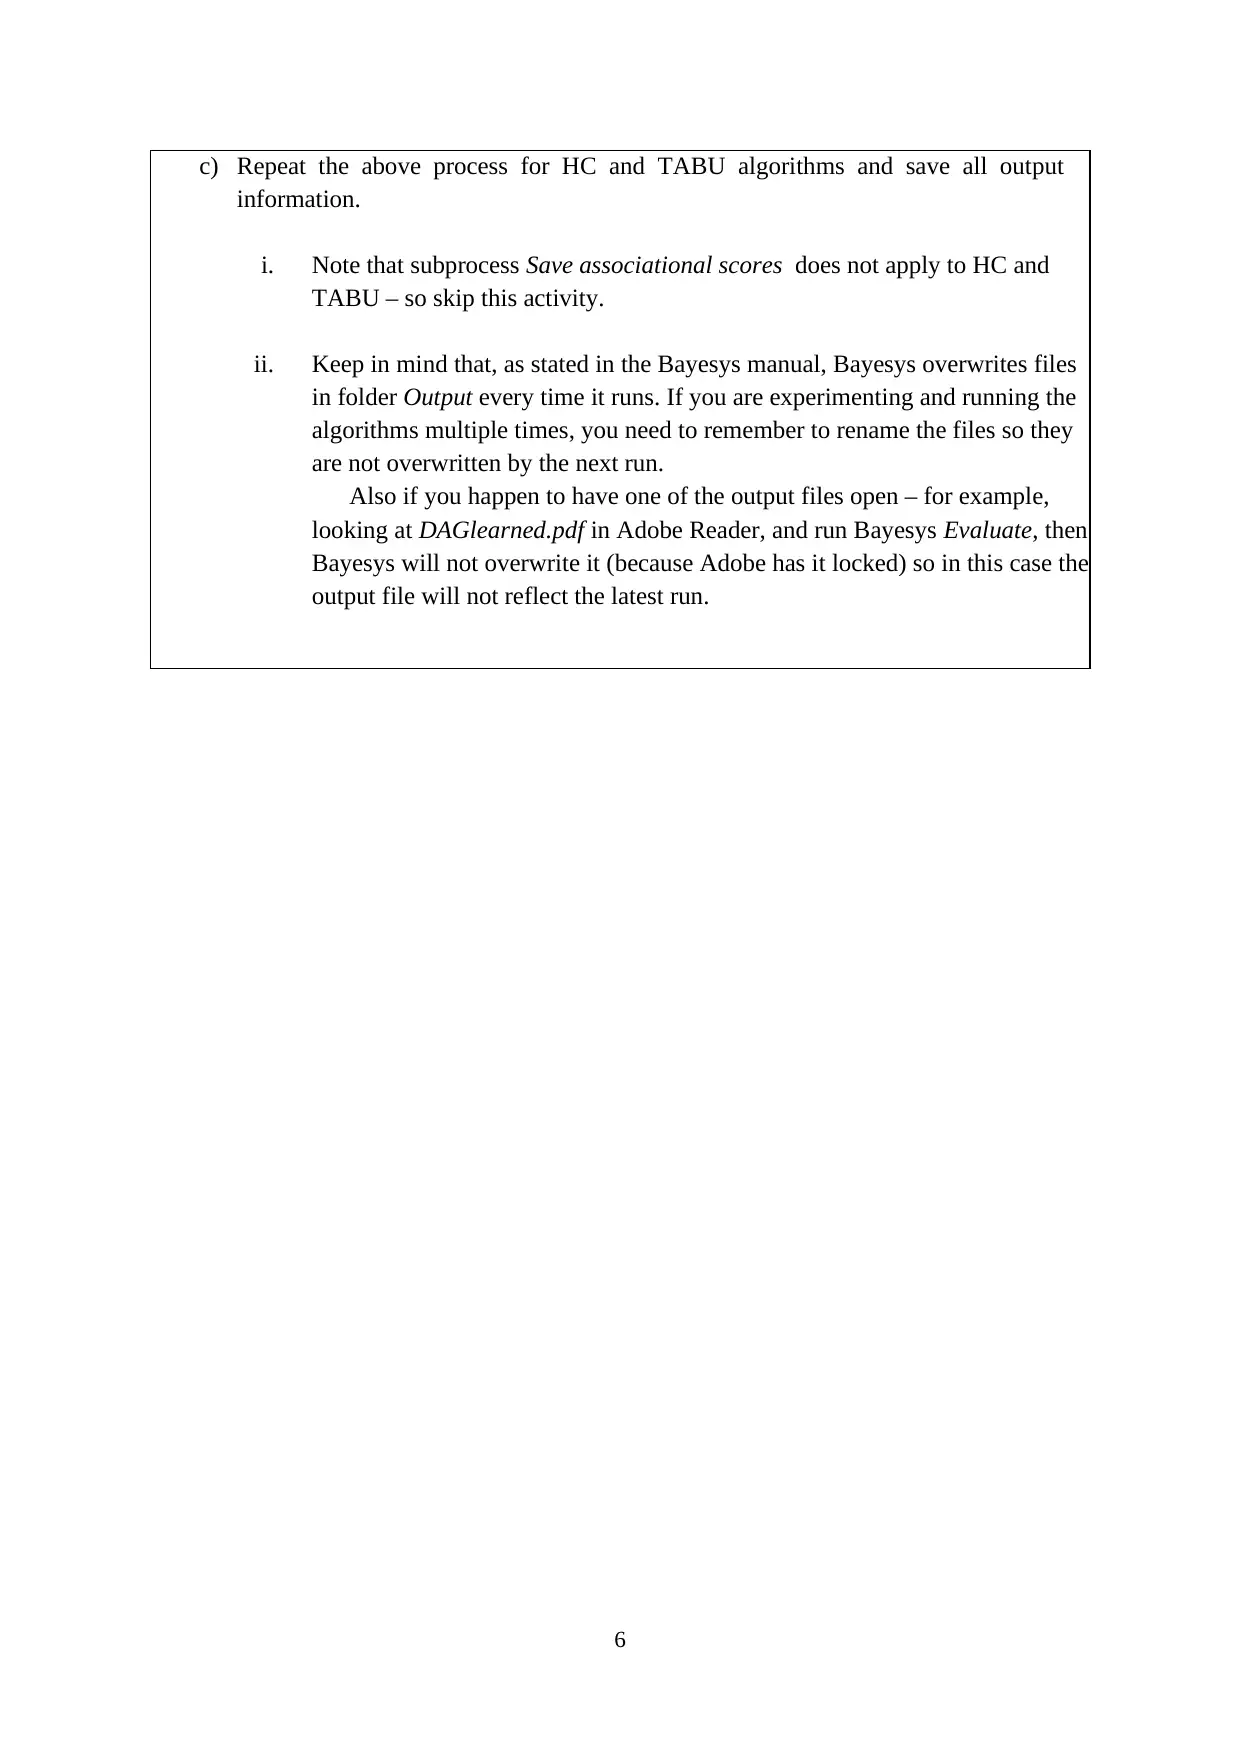
c) Repeat the above process for HC and TABU algorithms and save all output
information.
i. Note that subprocess Save associational scores does not apply to HC and
TABU – so skip this activity.
ii. Keep in mind that, as stated in the Bayesys manual, Bayesys overwrites files
in folder Output every time it runs. If you are experimenting and running the
algorithms multiple times, you need to remember to rename the files so they
are not overwritten by the next run.
Also if you happen to have one of the output files open – for example,
looking at DAGlearned.pdf in Adobe Reader, and run Bayesys Evaluate, then
Bayesys will not overwrite it (because Adobe has it locked) so in this case the
output file will not reflect the latest run.
⊘ This is a preview!⊘
Do you want full access?
Subscribe today to unlock all pages.
Trusted by 1+ million students worldwide
7
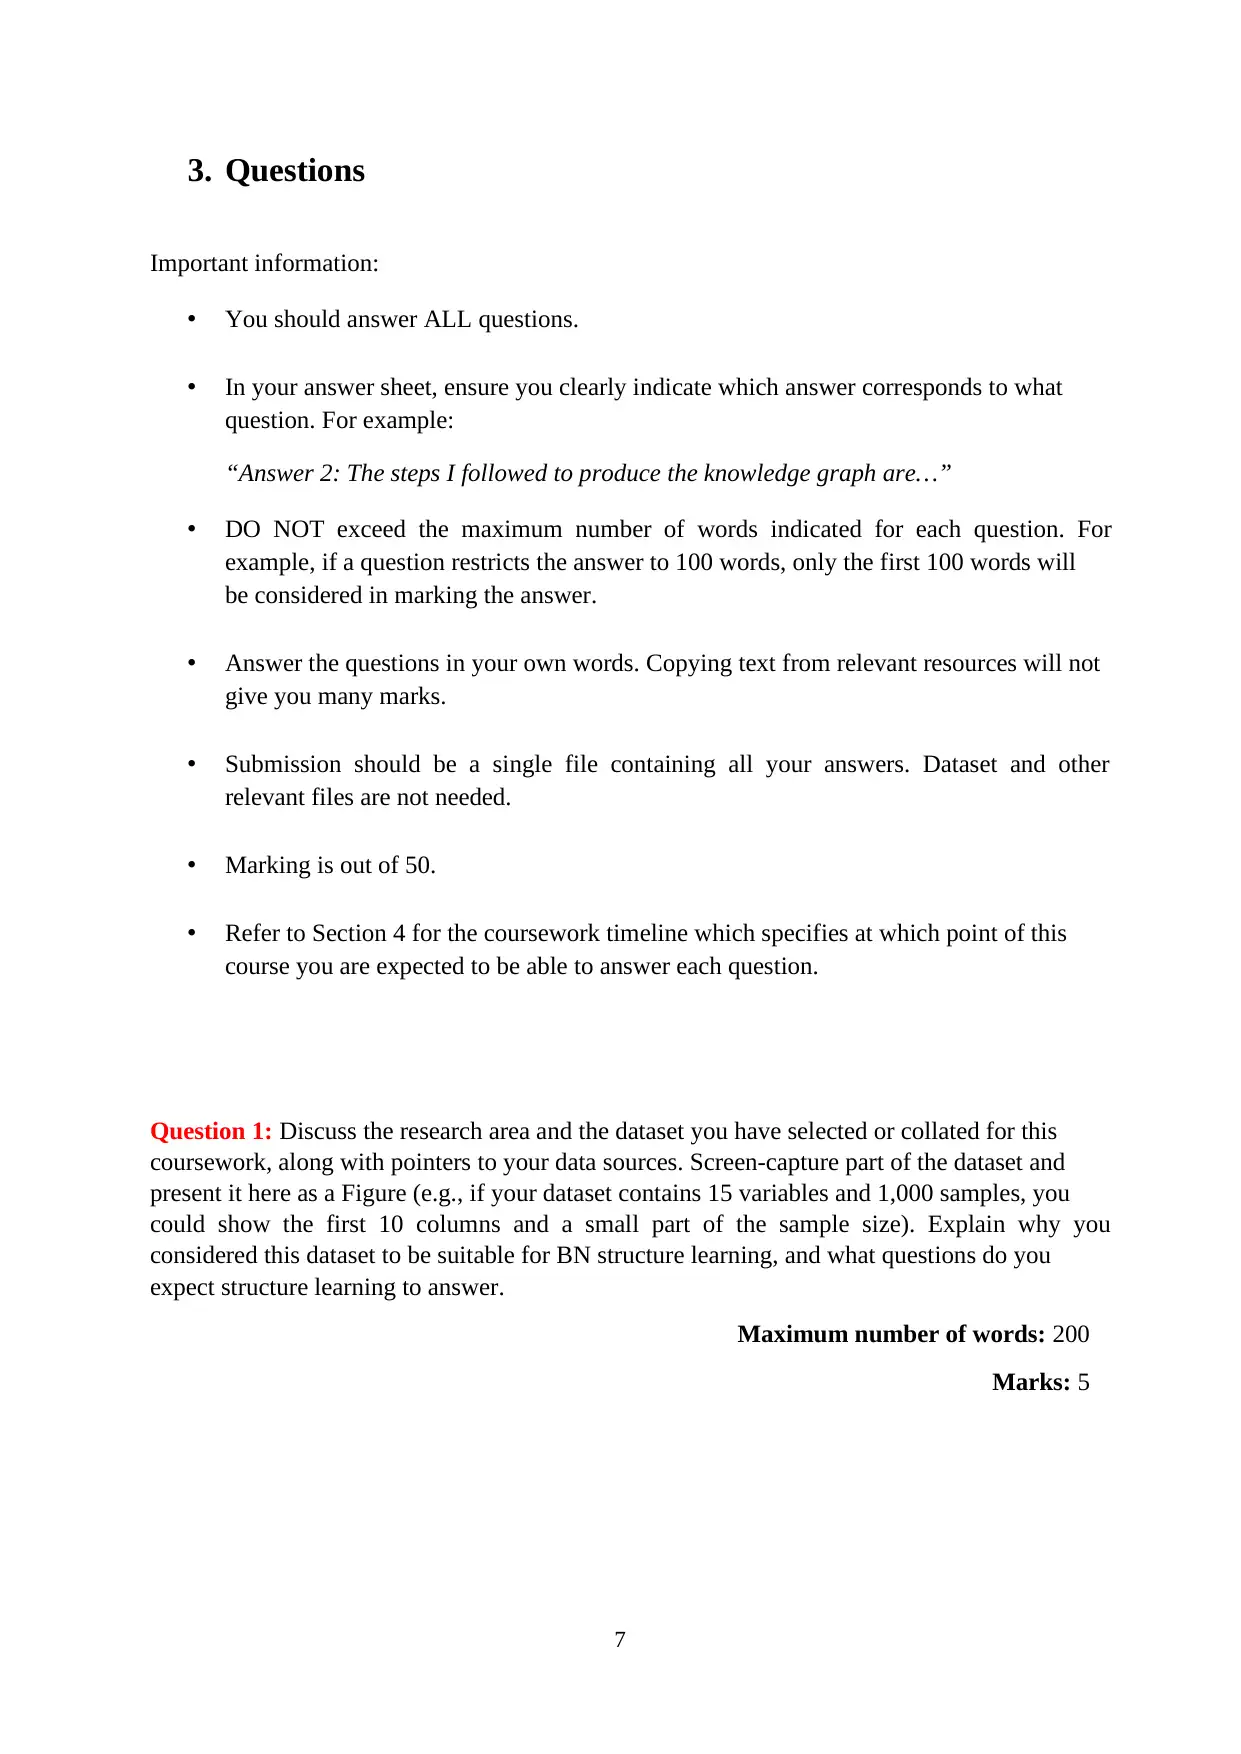
3. Questions
Important information:
• You should answer ALL questions.
• In your answer sheet, ensure you clearly indicate which answer corresponds to what
question. For example:
“Answer 2: The steps I followed to produce the knowledge graph are…”
• DO NOT exceed the maximum number of words indicated for each question. For
example, if a question restricts the answer to 100 words, only the first 100 words will
be considered in marking the answer.
• Answer the questions in your own words. Copying text from relevant resources will not
give you many marks.
• Submission should be a single file containing all your answers. Dataset and other
relevant files are not needed.
• Marking is out of 50.
• Refer to Section 4 for the coursework timeline which specifies at which point of this
course you are expected to be able to answer each question.
Question 1: Discuss the research area and the dataset you have selected or collated for this
coursework, along with pointers to your data sources. Screen-capture part of the dataset and
present it here as a Figure (e.g., if your dataset contains 15 variables and 1,000 samples, you
could show the first 10 columns and a small part of the sample size). Explain why you
considered this dataset to be suitable for BN structure learning, and what questions do you
expect structure learning to answer.
Maximum number of words: 200
Marks: 5
Paraphrase This Document
Need a fresh take? Get an instant paraphrase of this document with our AI Paraphraser
8
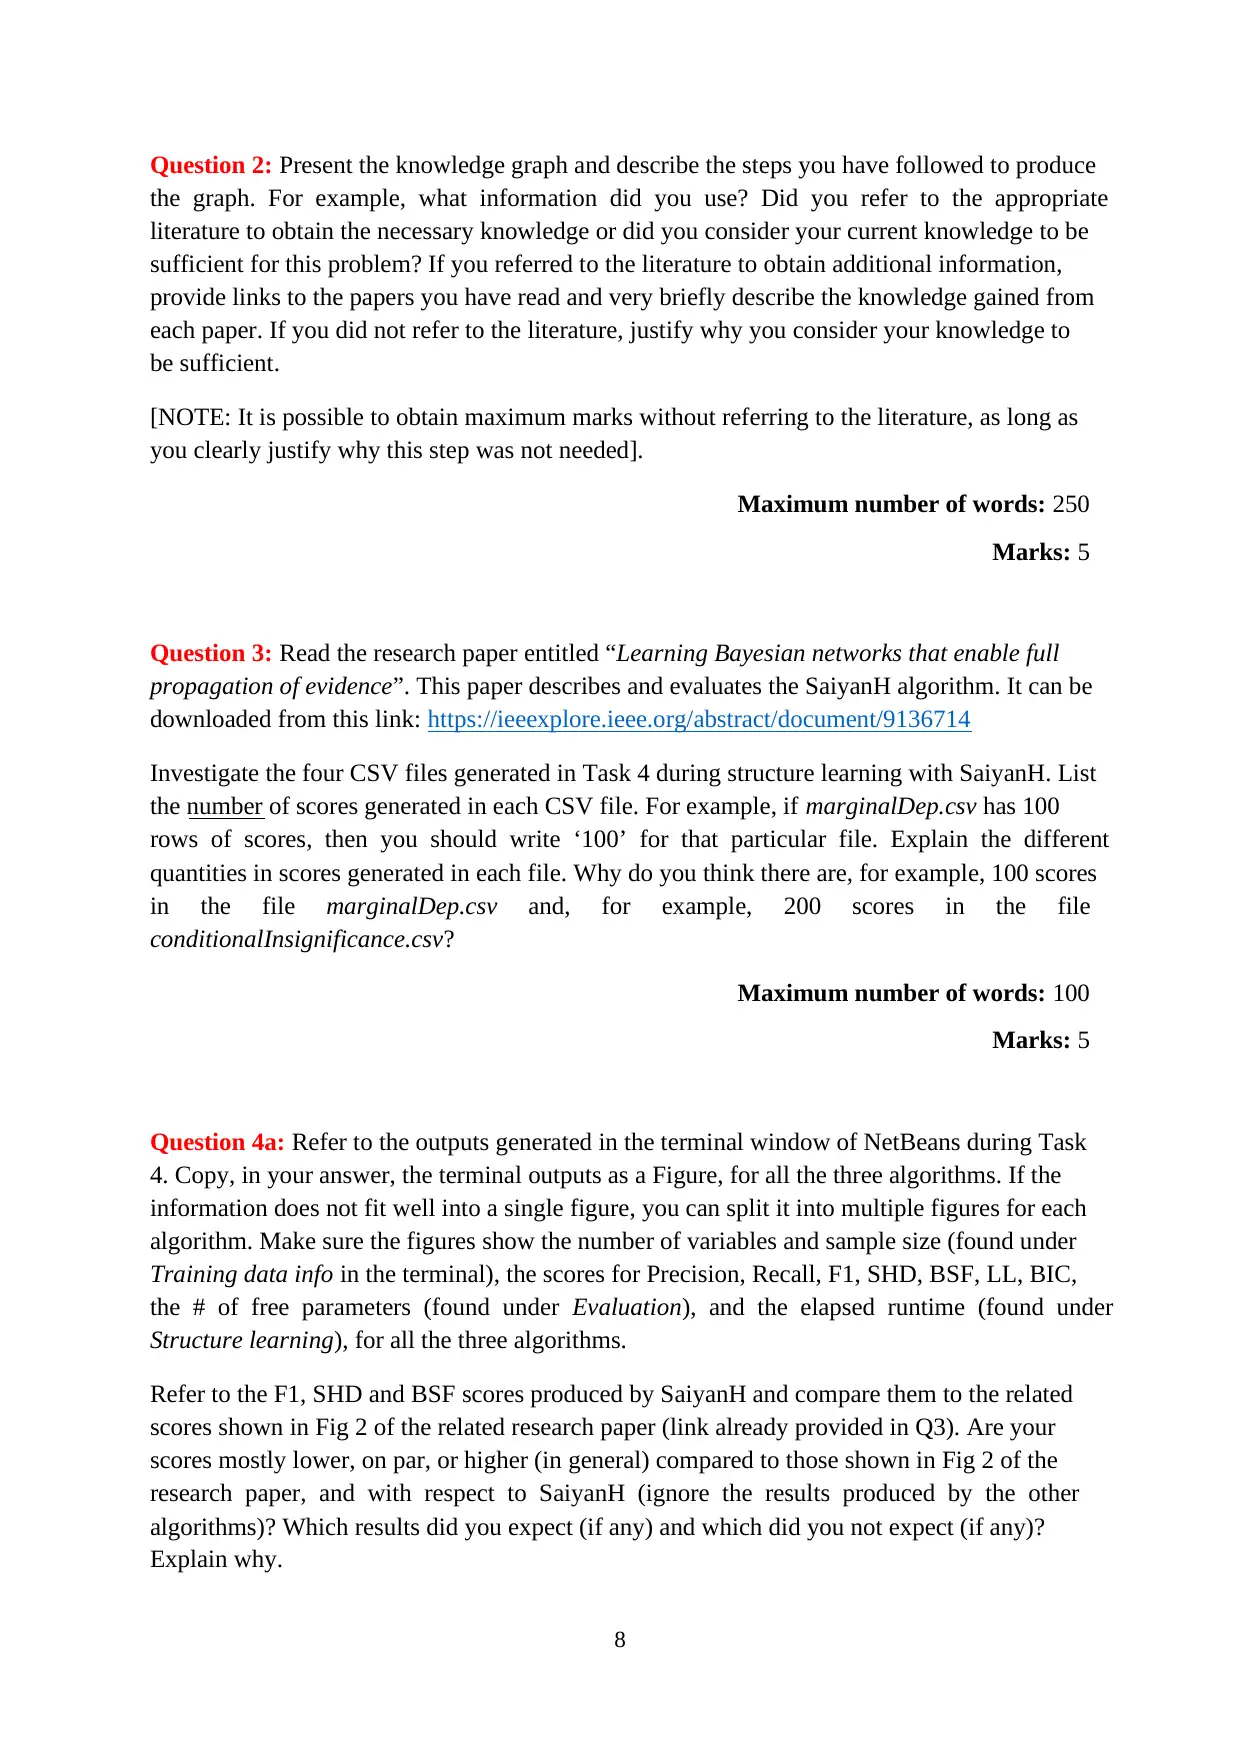
Question 2: Present the knowledge graph and describe the steps you have followed to produce
the graph. For example, what information did you use? Did you refer to the appropriate
literature to obtain the necessary knowledge or did you consider your current knowledge to be
sufficient for this problem? If you referred to the literature to obtain additional information,
provide links to the papers you have read and very briefly describe the knowledge gained from
each paper. If you did not refer to the literature, justify why you consider your knowledge to
be sufficient.
[NOTE: It is possible to obtain maximum marks without referring to the literature, as long as
you clearly justify why this step was not needed].
Maximum number of words: 250
Marks: 5
Question 3: Read the research paper entitled “Learning Bayesian networks that enable full
propagation of evidence”. This paper describes and evaluates the SaiyanH algorithm. It can be
downloaded from this link: https://ieeexplore.ieee.org/abstract/document/9136714
Investigate the four CSV files generated in Task 4 during structure learning with SaiyanH. List
the number of scores generated in each CSV file. For example, if marginalDep.csv has 100
rows of scores, then you should write ‘100’ for that particular file. Explain the different
quantities in scores generated in each file. Why do you think there are, for example, 100 scores
in the file marginalDep.csv and, for example, 200 scores in the file
conditionalInsignificance.csv?
Maximum number of words: 100
Marks: 5
Question 4a: Refer to the outputs generated in the terminal window of NetBeans during Task
4. Copy, in your answer, the terminal outputs as a Figure, for all the three algorithms. If the
information does not fit well into a single figure, you can split it into multiple figures for each
algorithm. Make sure the figures show the number of variables and sample size (found under
Training data info in the terminal), the scores for Precision, Recall, F1, SHD, BSF, LL, BIC,
the # of free parameters (found under Evaluation), and the elapsed runtime (found under
Structure learning), for all the three algorithms.
Refer to the F1, SHD and BSF scores produced by SaiyanH and compare them to the related
scores shown in Fig 2 of the related research paper (link already provided in Q3). Are your
scores mostly lower, on par, or higher (in general) compared to those shown in Fig 2 of the
research paper, and with respect to SaiyanH (ignore the results produced by the other
algorithms)? Which results did you expect (if any) and which did you not expect (if any)?
Explain why.
9
Maximum number of words: 200
Marks: 5
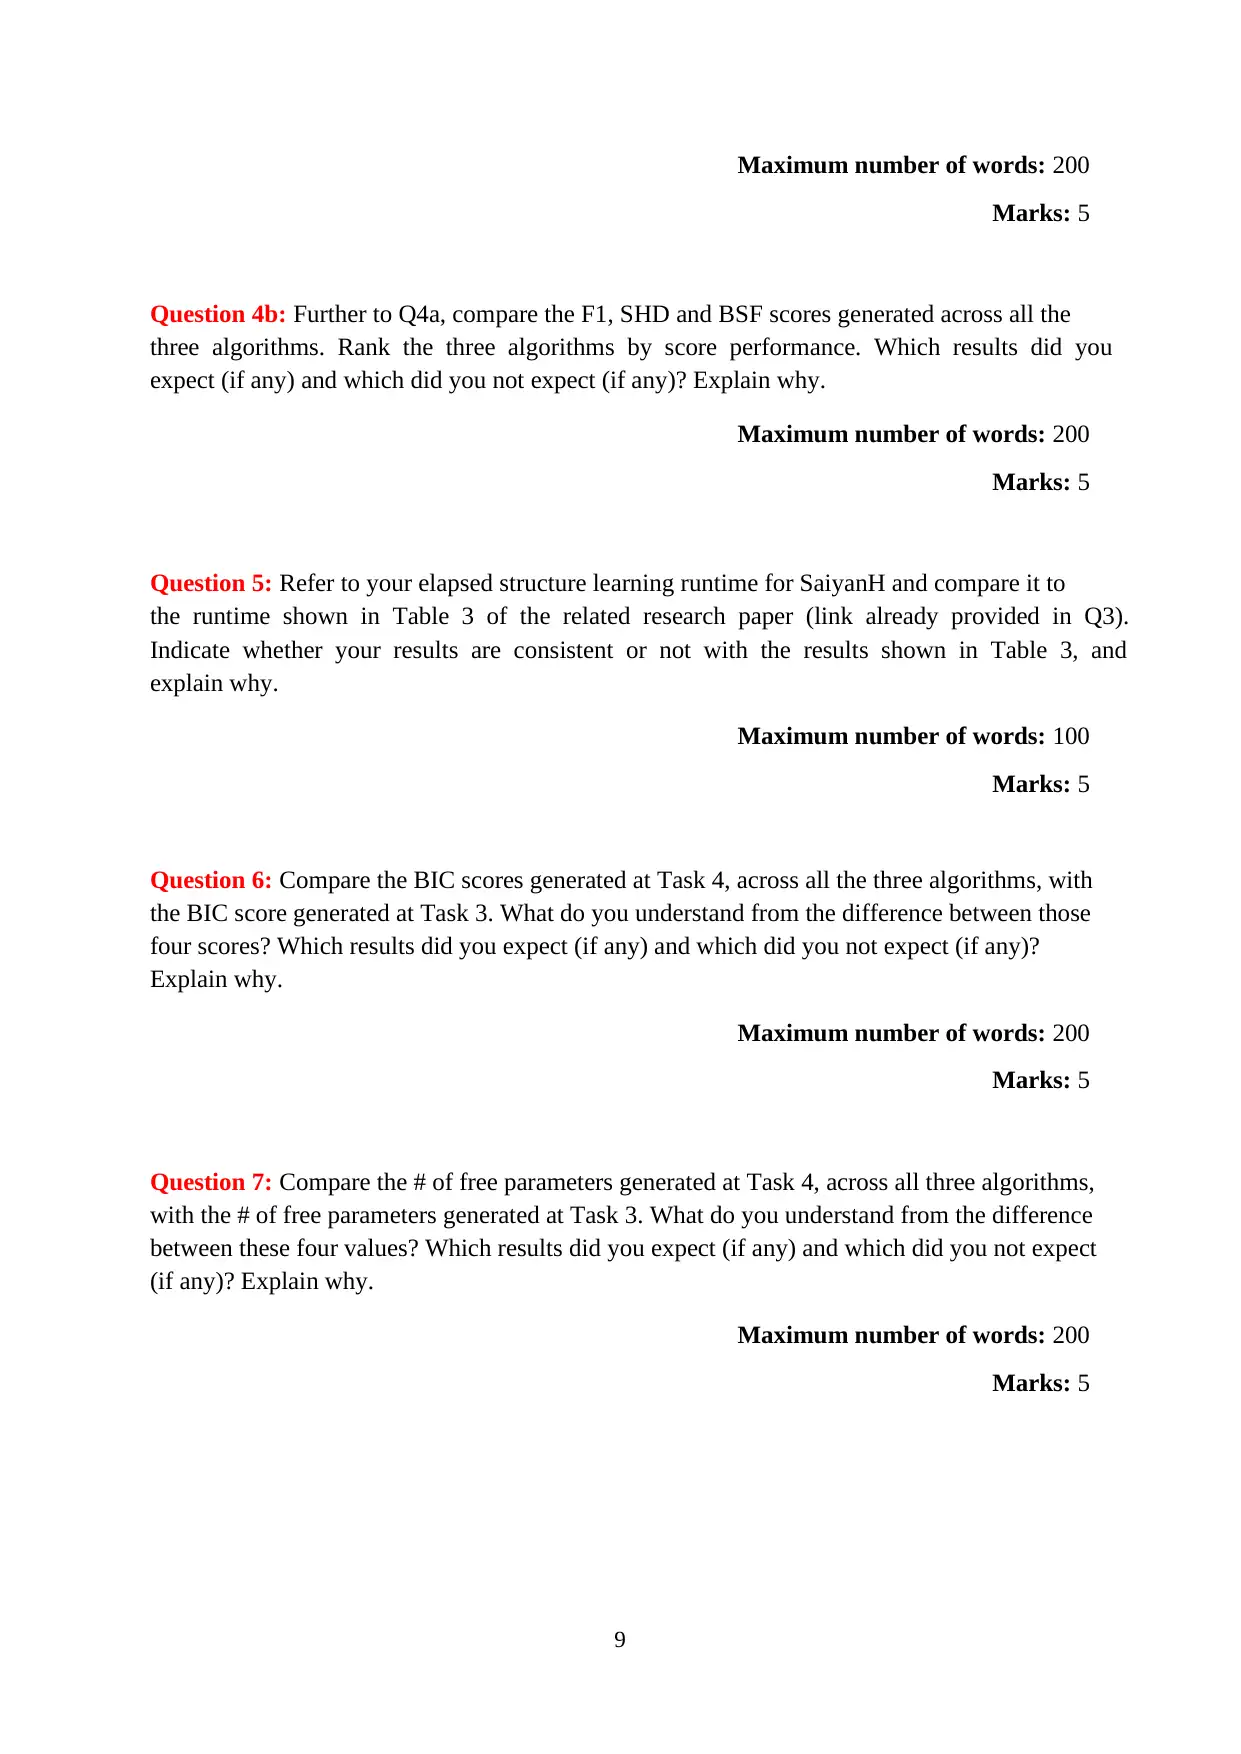
Question 4b: Further to Q4a, compare the F1, SHD and BSF scores generated across all the
three algorithms. Rank the three algorithms by score performance. Which results did you
expect (if any) and which did you not expect (if any)? Explain why.
Maximum number of words: 200
Marks: 5
Question 5: Refer to your elapsed structure learning runtime for SaiyanH and compare it to
the runtime shown in Table 3 of the related research paper (link already provided in Q3).
Indicate whether your results are consistent or not with the results shown in Table 3, and
explain why.
Maximum number of words: 100
Marks: 5
Question 6: Compare the BIC scores generated at Task 4, across all the three algorithms, with
the BIC score generated at Task 3. What do you understand from the difference between those
four scores? Which results did you expect (if any) and which did you not expect (if any)?
Explain why.
Maximum number of words: 200
Marks: 5
Question 7: Compare the # of free parameters generated at Task 4, across all three algorithms,
with the # of free parameters generated at Task 3. What do you understand from the difference
between these four values? Which results did you expect (if any) and which did you not expect
(if any)? Explain why.
Maximum number of words: 200
Marks: 5
Maximum number of words: 200
Marks: 5
Question 4b: Further to Q4a, compare the F1, SHD and BSF scores generated across all the
three algorithms. Rank the three algorithms by score performance. Which results did you
expect (if any) and which did you not expect (if any)? Explain why.
Maximum number of words: 200
Marks: 5
Question 5: Refer to your elapsed structure learning runtime for SaiyanH and compare it to
the runtime shown in Table 3 of the related research paper (link already provided in Q3).
Indicate whether your results are consistent or not with the results shown in Table 3, and
explain why.
Maximum number of words: 100
Marks: 5
Question 6: Compare the BIC scores generated at Task 4, across all the three algorithms, with
the BIC score generated at Task 3. What do you understand from the difference between those
four scores? Which results did you expect (if any) and which did you not expect (if any)?
Explain why.
Maximum number of words: 200
Marks: 5
Question 7: Compare the # of free parameters generated at Task 4, across all three algorithms,
with the # of free parameters generated at Task 3. What do you understand from the difference
between these four values? Which results did you expect (if any) and which did you not expect
(if any)? Explain why.
Maximum number of words: 200
Marks: 5
⊘ This is a preview!⊘
Do you want full access?
Subscribe today to unlock all pages.
Trusted by 1+ million students worldwide
10
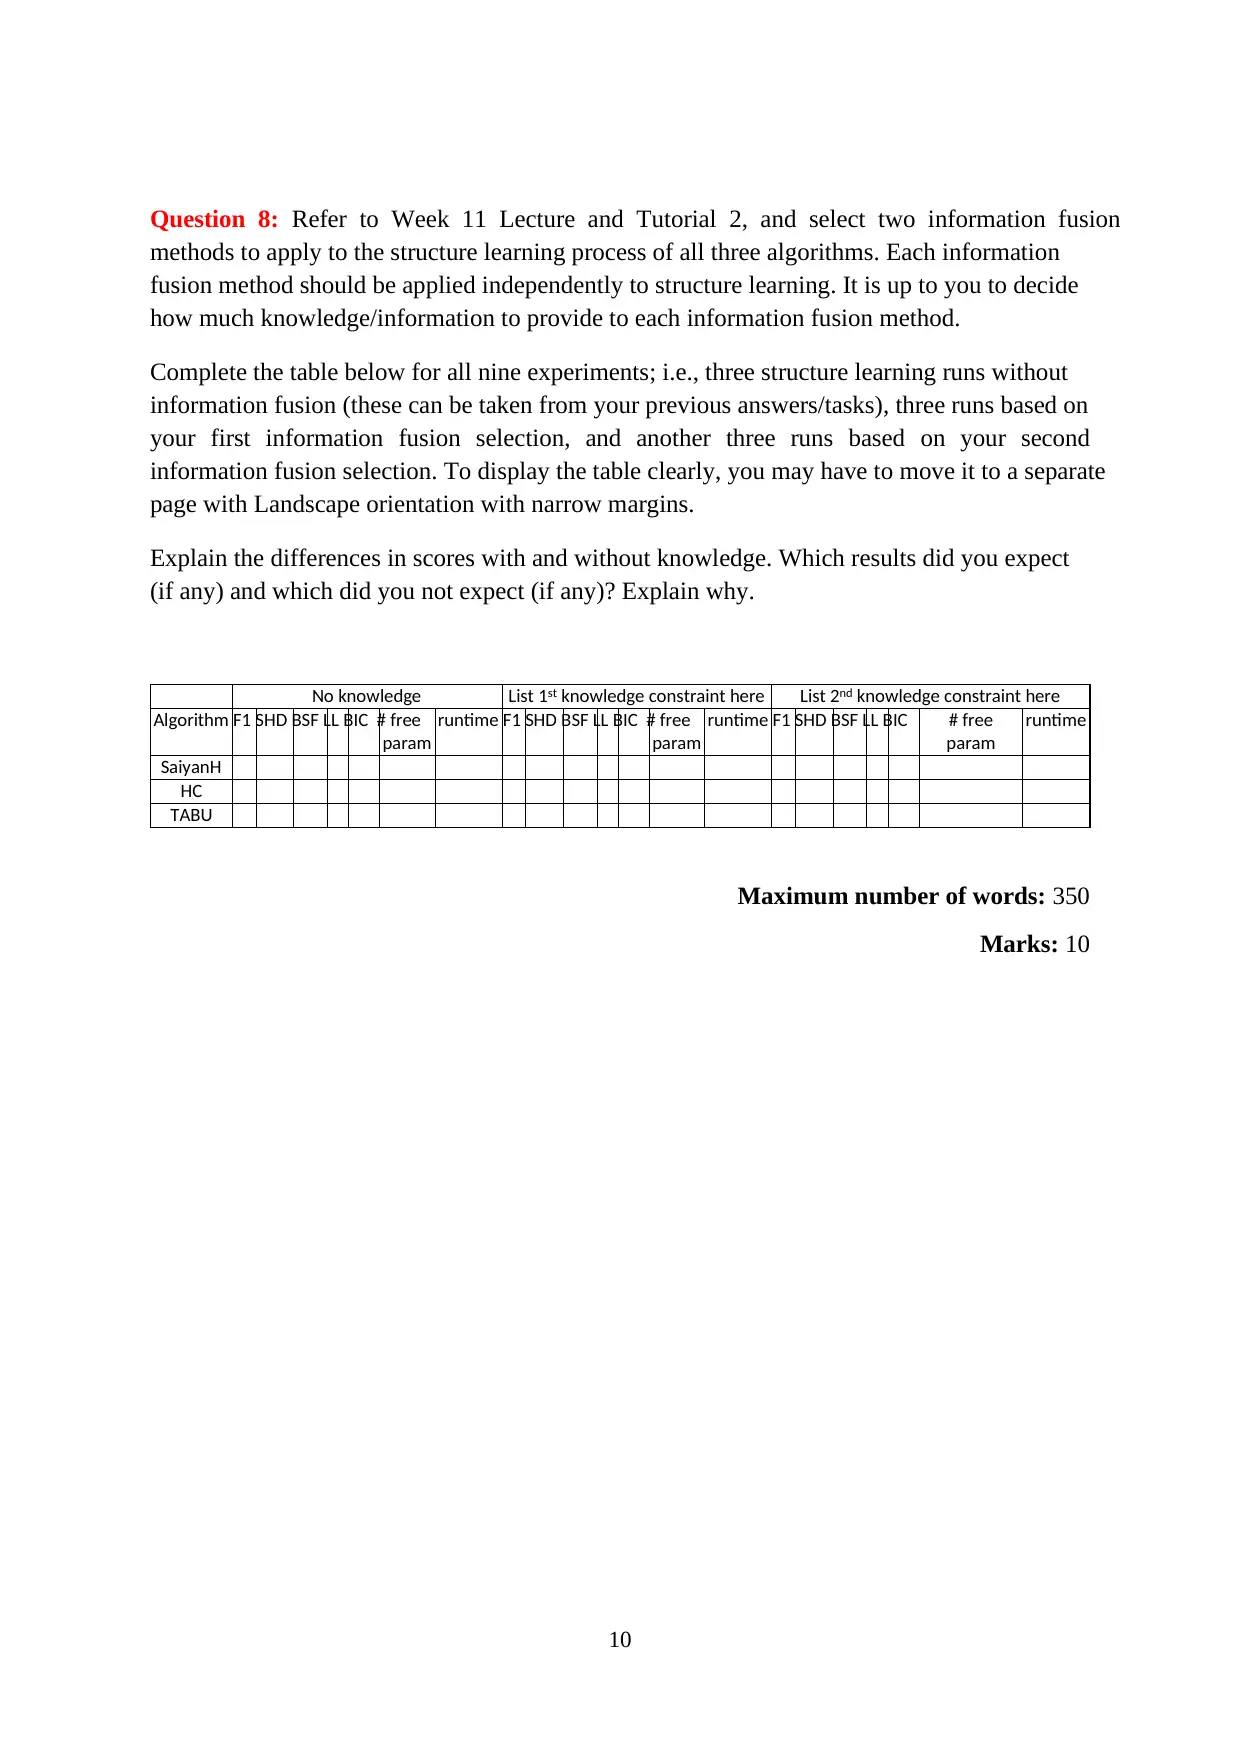
Question 8: Refer to Week 11 Lecture and Tutorial 2, and select two information fusion
methods to apply to the structure learning process of all three algorithms. Each information
fusion method should be applied independently to structure learning. It is up to you to decide
how much knowledge/information to provide to each information fusion method.
Complete the table below for all nine experiments; i.e., three structure learning runs without
information fusion (these can be taken from your previous answers/tasks), three runs based on
your first information fusion selection, and another three runs based on your second
information fusion selection. To display the table clearly, you may have to move it to a separate
page with Landscape orientation with narrow margins.
Explain the differences in scores with and without knowledge. Which results did you expect
(if any) and which did you not expect (if any)? Explain why.
No knowledge List 1st knowledge constraint here List 2nd knowledge constraint here
Algorithm F1 SHD BSF LL BIC # free
param
runtime F1 SHD BSF LL BIC # free
param
runtime F1 SHD BSF LL BIC # free
param
runtime
SaiyanH
HC
TABU
Maximum number of words: 350
Marks: 10
Paraphrase This Document
Need a fresh take? Get an instant paraphrase of this document with our AI Paraphraser
11
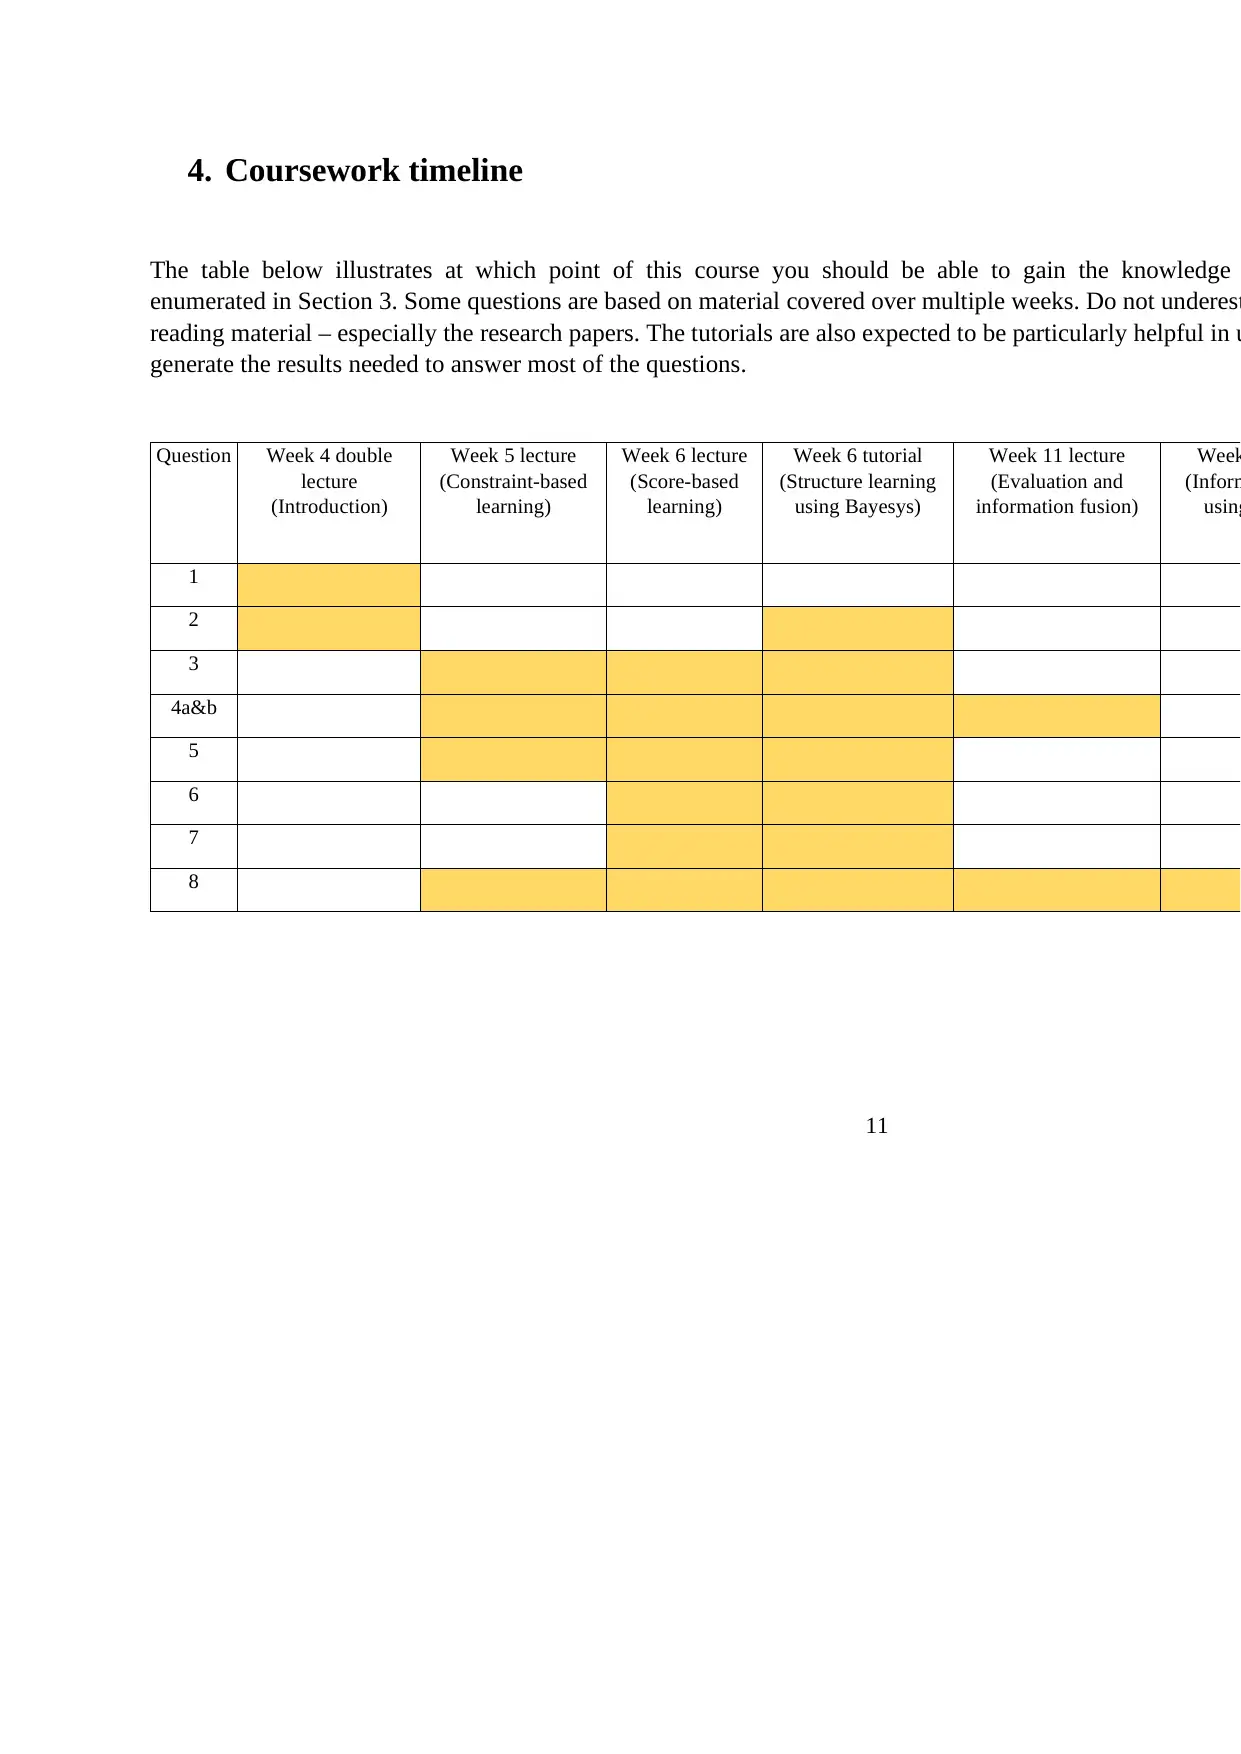
4. Coursework timeline
The table below illustrates at which point of this course you should be able to gain the knowledge
enumerated in Section 3. Some questions are based on material covered over multiple weeks. Do not underest
reading material – especially the research papers. The tutorials are also expected to be particularly helpful in u
generate the results needed to answer most of the questions.
Question Week 4 double
lecture
(Introduction)
Week 5 lecture
(Constraint-based
learning)
Week 6 lecture
(Score-based
learning)
Week 6 tutorial
(Structure learning
using Bayesys)
Week 11 lecture
(Evaluation and
information fusion)
Week
(Inform
using
1
2
3
4a&b
5
6
7
8
12
5. Data sources
Using public data is the most common choice. If you have access to private data, that is also
an option, though you will have to be careful about what results you can release. Some sources
of publicly available data are listed below (you don`t have to use these sources).
• UK Covid Data
https://coronavirus.data.gov.uk/
Official UK COVID data
• Data.gov
http://data.gov
This is the resource for most government-related data.
• Socrata
http://www.socrata.com/resources/
Socrata is a good place to explore government-related data. Furthermore, it provides
some visualization tools for exploring data.
• US Census Bureau
http://www.census.gov/data.html
This site provides information about US citizens covering population data, geographic
data, and education.
• UN3ta
https://data.un.org/
UN data is an Internet-based data service which brings UN statistical databases.
• European Union Open Data Portal
http://open-data.europa.eu/en/data/
This site provides a lot of data from European Union institutions.
• Data.gov.uk
http://data.gov.uk/
This site of the UK Government includes the British National Bibliography: metadata
on all UK books and publications since 1950.
• The CIA World Factbook
https://www.cia.gov/library/publications/the-world-factbook/
This site of the Central Intelligence Agency provides a lot of information on history,
population, economy, government, infrastructure, and military of 267 countries.
• Health Data
Healthdata.gov
https://www.healthdata.gov/
This site provides medical data about epidemiology and population statistics.
⊘ This is a preview!⊘
Do you want full access?
Subscribe today to unlock all pages.
Trusted by 1+ million students worldwide
1 out of 14


Your All-in-One AI-Powered Toolkit for Academic Success.
+13062052269
info@desklib.com
Available 24*7 on WhatsApp / Email
![[object Object]](/_next/static/media/star-bottom.7253800d.svg)
Unlock your academic potential
Copyright © 2020–2026 A2Z Services. All Rights Reserved. Developed and managed by ZUCOL.