Case Study: Analyzing Market Trends and BBQfun Company Performance
VerifiedAdded on 2022/10/01
|16
|2691
|1
Case Study
AI Summary
This report presents a comprehensive analysis of market trends, developments, and their potential impact on the BBQfun Company. The analysis focuses on internal and external sources of information, including business objectives, marketing performance, comparative market data, technological advancements, demographic changes, social and cultural factors, economic trends, government activities, industry trends, and supplier data. The report evaluates the effectiveness of marketing analytics software and statistical analysis, particularly the correlation between sales forecasts and marketing expenses. It examines customer data from Brisbane City and Sunshine City to assess spending power and inform marketing strategies. The report also reviews BBQfun's current business performance, including sales data for various products, to identify key strengths and areas for improvement. The findings and recommendations aim to assist BBQfun's management in making informed decisions to enhance the company's performance and capitalize on market opportunities.
INTERPRET MARKET TRENDS AND DEVELOPMENTS
ASSESSMENT 1
STUDENT NAME
STUDENT NUMBER ASSESSOR’S NAME
CASE STUDY
ASSESSMENT DUE DATE: 5.00 pm, <insert date>
ASSESSMENT TYPE: Individual assessment
ASSESSMENT FORMAT: Case Study Analysis
1. Introduction
ASSESSMENT 1
STUDENT NAME
STUDENT NUMBER ASSESSOR’S NAME
CASE STUDY
ASSESSMENT DUE DATE: 5.00 pm, <insert date>
ASSESSMENT TYPE: Individual assessment
ASSESSMENT FORMAT: Case Study Analysis
1. Introduction
Paraphrase This Document
Need a fresh take? Get an instant paraphrase of this document with our AI Paraphraser
This report is a detailed analysis of the trends, market developments and their potential impacts
to the BBQfun Company. The report is addressed to the management of BBQfun Company to
help them make major decisions affecting the operations of the company (Davis, 2017). The
report identifies potential threats and opportunities for the Company while reviewing
comparative business performance.
2. Environmental scan
(a) Explain internal and external sources of information relevant to BBQfun for
forecasting market trends including:
business and strategic objectives
The strategic objectives of BBQfun can aid in helping the business look at its current position
and the past in order to predict the future. The business state and strategic objectives
apply in helping in budgeting and sales prediction (Kotler, 2010). During analysis market
trends are considered to gauge the potential of the business.
marketing and other business performance
The current performance of the BBQfun and its marketing strategies can aid in forecasting its
future performance and its potential in terms of sales. The potential market impact on the
business can be predicted from past trends (Cooper, 2009).
comparative market information
Information on the BBQfun’s past play a major role in forecasting trends on its performance.
The business uses comparative market information to gauge its current position in
relation to other businesses and predict its position in future while considering the
strategies which have been put in place to improve its performance (Fergusson, 2008).
changes in technology
There are many technological changes which happen around the world, these changes highly
impact businesses and in this case the BBQfun since it has to stay afloat with
competition. The company must ensure that it embraces the latest technology in almost
all its aspects in order to ensure it is operating at its optimum (George, 2014).
demographic changes
the structure and age of a population impacts greatly on the performance of a business in this
case the business focusses mostly on the age of 20 to 50 which has the highest number of
people. Analysis should be done on potential changes on the society’s age structure and
be used in decision making.
social and cultural factors
when making a decision on the marketing strategies to embrace and how to improve sales the
social and cultural factors of the population which constute the highest percentage of the
business must be put into consideration to aid in making the right decisions.
economic trends
The overall direction in which the economy of Australia is moving must be studied and put
into great consideration in order to make effective and accurate plans.
government activities and legislative changes
Government activities and legislative changes affect businesses directly thus in its
operation the BBQfun must monitor keenly any government activities and legislation
which may impact their operations both currently and in the future (Crafford, 2014).
industry trends
The trends in the industry related to technological advancements, new product development,
and employment and consumer behaviour must be put into perspective in order to
forecast the future performance of the BBQfun (George, 2014).
supplier data
All supplier’s data must be studied carefully to help in making major decision that will
impact the overall performance of the business.
3. Software applications
Marketing analytics software contain processes and tools that enable the user to maximize
marketing performance by measuring, analysing, understanding and determining the user ‘s
marketing programs. The tools in the marketing analysis software are a merger of marketing
automation, mobile marketing solutions, business intelligence and social media marketing
solutions. The software have various distinct strengths to help gauge marketing performance
(Davis, 2017).
Open Source
a. Salesforce Einstein
⊘ This is a preview!⊘
Do you want full access?
Subscribe today to unlock all pages.
Trusted by 1+ million students worldwide
It enables the user to deeply understand their customers by gathering and processing information
to deliver reliable predictions. It comes with “myEinstein” a platform used to develop predictive
and intelligent applications to customize solutions for specific business requirements. It connects
calendars and emails to the platform thus enhancing productivity (George, 2014).
b. Percolate
It has robust tools for content management, analysis, inspiration and distribution while allowing
the publishing of content to different channels. It has the capabilities of social relationship
management, content management and marketing analytics (George, 2014).
c. Nielsen Marketing Cloud
The software is developed to help companies connect more deeply with their clients through its
tools for media planning, data analytics, data management and marketing activation. It has an
effective one to one messaging and a robust ROI analysis (George, 2014). It can purchase intent
metrics and track consideration in real time.
d. Visual IQ
It enables businesses to understand the marketing performance in a combination of unique
customer profiles by enabling the analysis of the behaviour and attributes of the audience and
optimizing budgets to improve the general customer experience (George, 2014).
Proprietary Packages
a. Looker
This is a business intelligent software focussing on data discovery, the software helps companies
in decision making through its ability to access data in real time. It easily assimilates with any
SQL database and allows the user to share generated reports on the fly with others. The software
enables the user to develop tables and charts to help in interpreting their data. It has self-service
properties e.g. creation of visualizations, pivoting, creation of dashboards and filtering (Crafford,
2014).
b. HubSpot Marketing
Brings all the marketing efforts of the users together to aid in growing conversions and
increasing traffic. The software helps the user to create websites with a drag and drop feature in
it, it also enables them to distribute dynamic and static HTML messages, build landing pages for
campaigns and integrate data or information from other sources. The system has social
suggestions and an SEO to drive traffic and other properties for message personalization
(George, 2014).
c. Marketo
Paraphrase This Document
Need a fresh take? Get an instant paraphrase of this document with our AI Paraphraser
This is a cloud based software that majors in marketing management, marketing and customer
engagement. It contains properties for digitals ads, marketing analytics, account based
marketing, web, social and content marketing. It enables users to create professional HTML
emails and does integrations with top CRM platforms (George, 2014).
4. Statistical analysis
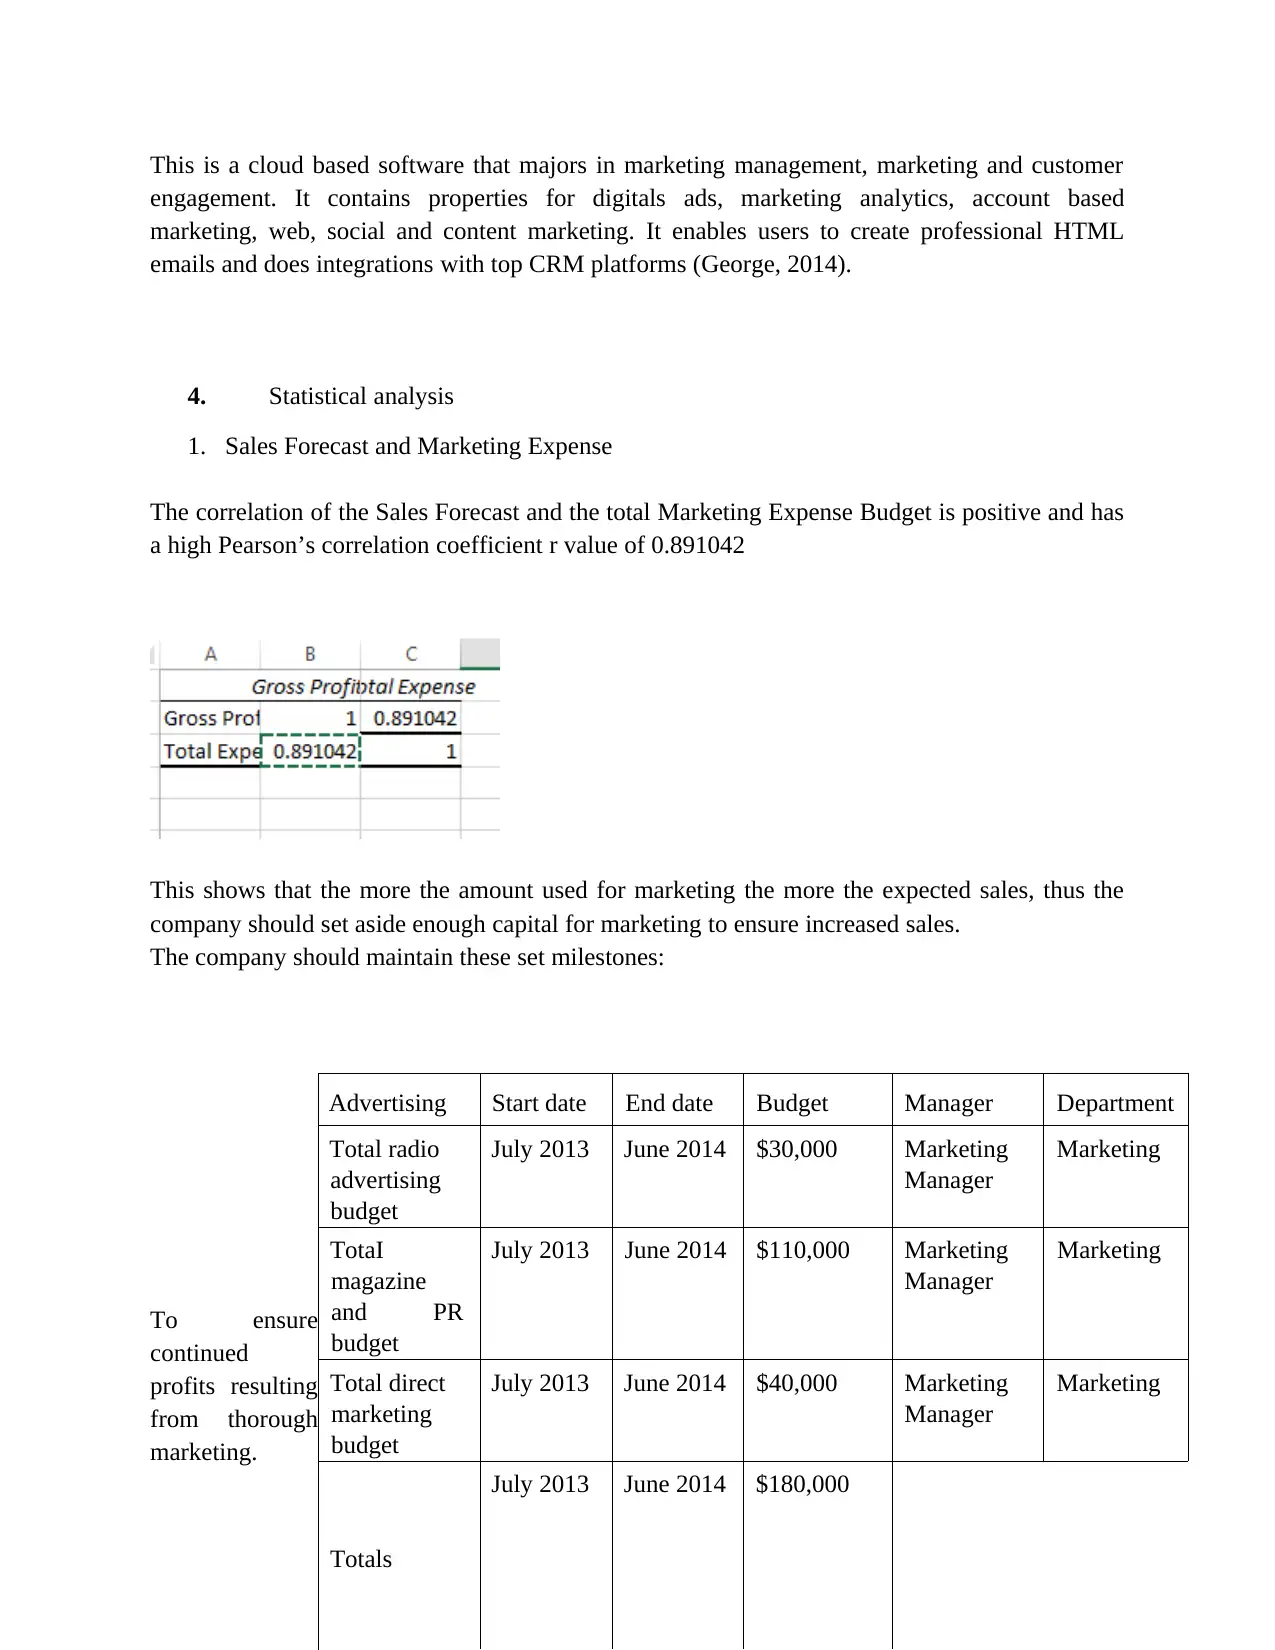
1. Sales Forecast and Marketing Expense
The correlation of the Sales Forecast and the total Marketing Expense Budget is positive and has
a high Pearson’s correlation coefficient r value of 0.891042
This shows that the more the amount used for marketing the more the expected sales, thus the
company should set aside enough capital for marketing to ensure increased sales.
The company should maintain these set milestones:
To ensure
continued
profits resulting
from thorough
marketing.
Advertising Start date End date Budget Manager Department
Total radio
advertising
budget
July 2013 June 2014 $30,000 Marketing
Manager
Marketing
TotaI
magazine
and PR
budget
July 2013 June 2014 $110,000 Marketing
Manager
Marketing
Total direct
marketing
budget
July 2013 June 2014 $40,000 Marketing
Manager
Marketing
Totals
July 2013 June 2014 $180,000
engagement. It contains properties for digitals ads, marketing analytics, account based
marketing, web, social and content marketing. It enables users to create professional HTML
emails and does integrations with top CRM platforms (George, 2014).
4. Statistical analysis
1. Sales Forecast and Marketing Expense
The correlation of the Sales Forecast and the total Marketing Expense Budget is positive and has
a high Pearson’s correlation coefficient r value of 0.891042
This shows that the more the amount used for marketing the more the expected sales, thus the
company should set aside enough capital for marketing to ensure increased sales.
The company should maintain these set milestones:
To ensure
continued
profits resulting
from thorough
marketing.
Advertising Start date End date Budget Manager Department
Total radio
advertising
budget
July 2013 June 2014 $30,000 Marketing
Manager
Marketing
TotaI
magazine
and PR
budget
July 2013 June 2014 $110,000 Marketing
Manager
Marketing
Total direct
marketing
budget
July 2013 June 2014 $40,000 Marketing
Manager
Marketing
Totals
July 2013 June 2014 $180,000
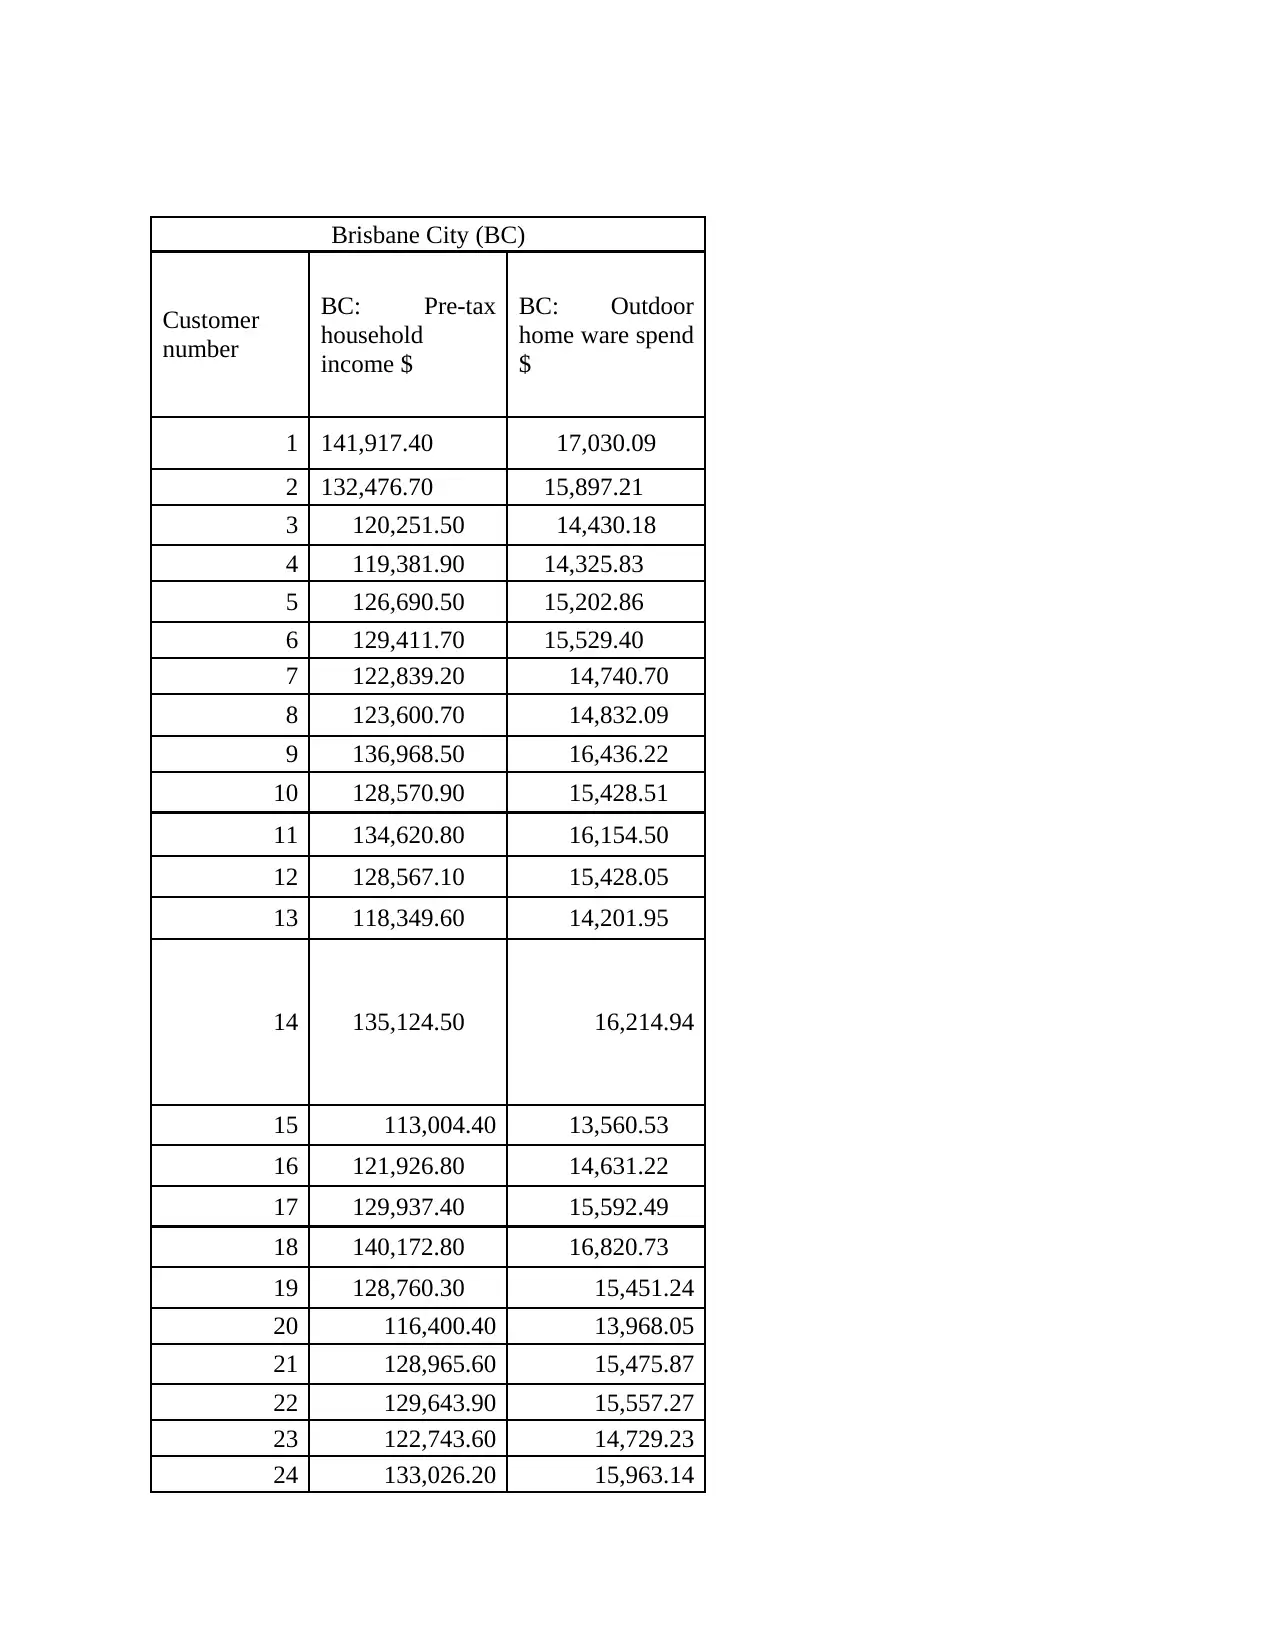
Brisbane City (BC)
Customer
number
BC: Pre-tax
household
income $
BC: Outdoor
home ware spend
$
1 141,917.40 17,030.09
2 132,476.70 15,897.21
3 120,251.50 14,430.18
4 119,381.90 14,325.83
5 126,690.50 15,202.86
6 129,411.70 15,529.40
7 122,839.20 14,740.70
8 123,600.70 14,832.09
9 136,968.50 16,436.22
10 128,570.90 15,428.51
11 134,620.80 16,154.50
12 128,567.10 15,428.05
13 118,349.60 14,201.95
14 135,124.50 16,214.94
15 113,004.40 13,560.53
16 121,926.80 14,631.22
17 129,937.40 15,592.49
18 140,172.80 16,820.73
19 128,760.30 15,451.24
20 116,400.40 13,968.05
21 128,965.60 15,475.87
22 129,643.90 15,557.27
23 122,743.60 14,729.23
24 133,026.20 15,963.14
⊘ This is a preview!⊘
Do you want full access?
Subscribe today to unlock all pages.
Trusted by 1+ million students worldwide

25 121,658.30 14,599.00.
26 134,905.40 16,188.65
27 124,530.10 14,943.61
28 117,690.10 14,122.81
29 109,617.00 13,154.04
30 119,613.10 14,353.57
31 115,141.90 13,817.03
32 119,711.40 14,365.36
33 133,159.30 15,979.11
34 135,789.80 16,294.77
35 120,319.70 14,438.37
36 134,554.20 16,146.51
37 112,029.70 13,443.57
38 130,243.00 15,629.15
39 136,044.30 16,325.31
40 124,939.40 14,992.73
41 137,191.20 16,462.95
42 131,718.80 15,806.25
43 116,829.10 14,019.49
44 113,549.50 13,625.93
45 136 552.10 16,386.25
46 139,752.20 16,770.27
47 122,178.70 14,661.45
48 122,000.70 14,640.08
49 153,252.00 18,390.24
50 127,501.40 15,300.17
Mean 126,883.12 15,262.45
The table shows the mean for Pre-tax household income and the Outdoor homeware spend of
Brisbane City.
Paraphrase This Document
Need a fresh take? Get an instant paraphrase of this document with our AI Paraphraser
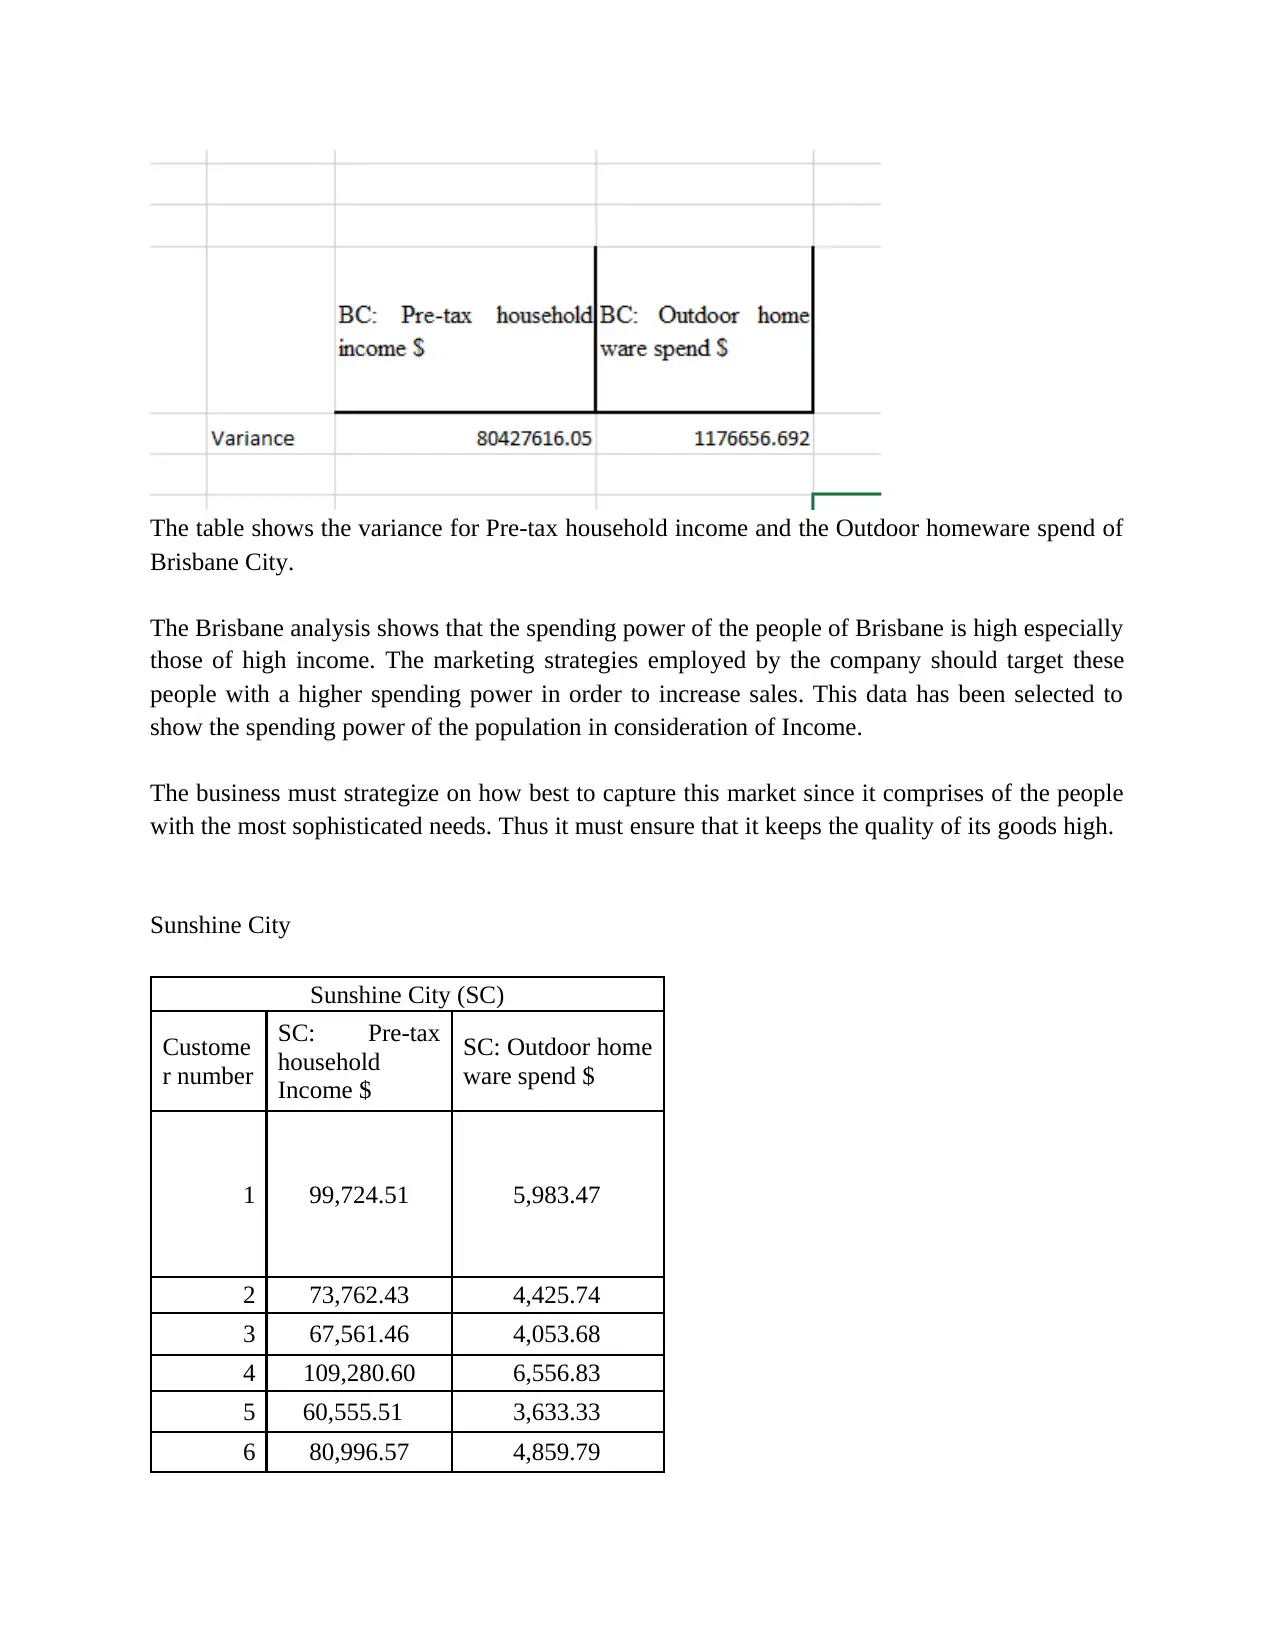
The table shows the variance for Pre-tax household income and the Outdoor homeware spend of
Brisbane City.
The Brisbane analysis shows that the spending power of the people of Brisbane is high especially
those of high income. The marketing strategies employed by the company should target these
people with a higher spending power in order to increase sales. This data has been selected to
show the spending power of the population in consideration of Income.
The business must strategize on how best to capture this market since it comprises of the people
with the most sophisticated needs. Thus it must ensure that it keeps the quality of its goods high.
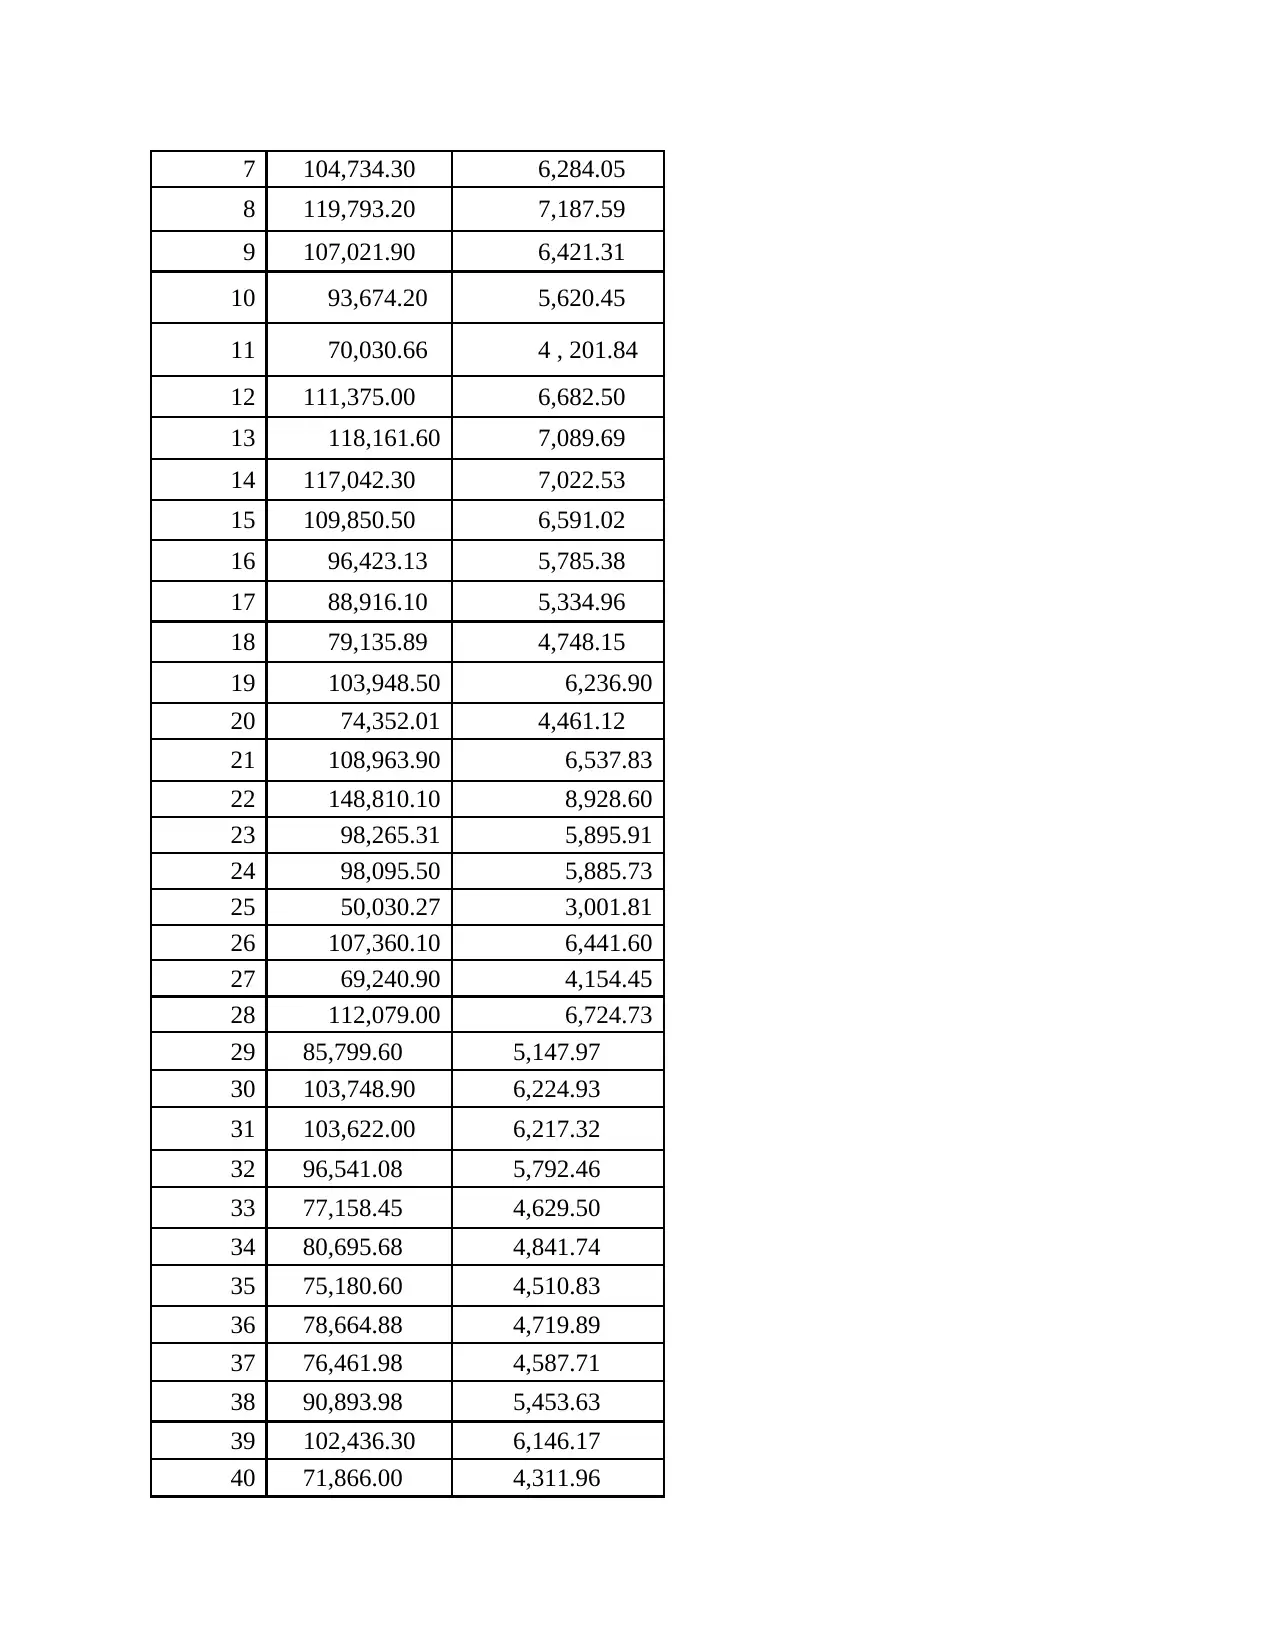
Sunshine City
Sunshine City (SC)
Custome
r number
SC: Pre-tax
household
Income $
SC: Outdoor home
ware spend $
1 99,724.51 5,983.47
2 73,762.43 4,425.74
3 67,561.46 4,053.68
4 109,280.60 6,556.83
5 60,555.51 3,633.33
6 80,996.57 4,859.79
Brisbane City.
The Brisbane analysis shows that the spending power of the people of Brisbane is high especially
those of high income. The marketing strategies employed by the company should target these
people with a higher spending power in order to increase sales. This data has been selected to
show the spending power of the population in consideration of Income.
The business must strategize on how best to capture this market since it comprises of the people
with the most sophisticated needs. Thus it must ensure that it keeps the quality of its goods high.
Sunshine City
Sunshine City (SC)
Custome
r number
SC: Pre-tax
household
Income $
SC: Outdoor home
ware spend $
1 99,724.51 5,983.47
2 73,762.43 4,425.74
3 67,561.46 4,053.68
4 109,280.60 6,556.83
5 60,555.51 3,633.33
6 80,996.57 4,859.79
7 104,734.30 6,284.05
8 119,793.20 7,187.59
9 107,021.90 6,421.31
10 93,674.20 5,620.45
11 70,030.66 4 , 201.84
12 111,375.00 6,682.50
13 118,161.60 7,089.69
14 117,042.30 7,022.53
15 109,850.50 6,591.02
16 96,423.13 5,785.38
17 88,916.10 5,334.96
18 79,135.89 4,748.15
19 103,948.50 6,236.90
20 74,352.01 4,461.12
21 108,963.90 6,537.83
22 148,810.10 8,928.60
23 98,265.31 5,895.91
24 98,095.50 5,885.73
25 50,030.27 3,001.81
26 107,360.10 6,441.60
27 69,240.90 4,154.45
28 112,079.00 6,724.73
29 85,799.60 5,147.97
30 103,748.90 6,224.93
31 103,622.00 6,217.32
32 96,541.08 5,792.46
33 77,158.45 4,629.50
34 80,695.68 4,841.74
35 75,180.60 4,510.83
36 78,664.88 4,719.89
37 76,461.98 4,587.71
38 90,893.98 5,453.63
39 102,436.30 6,146.17
40 71,866.00 4,311.96
⊘ This is a preview!⊘
Do you want full access?
Subscribe today to unlock all pages.
Trusted by 1+ million students worldwide

41 114,338.10 6,860.28
42 68,271.32 4,096.27
43 124,621.90 7,477.31
44 91,609.39 5,496.56
45 83,630.24 5,017.81
46 71,926.24 4,315.57
47 120,858.70 7,251.52
48 91,960.48 5,517.62
49 86,336.73 5,180.20
50 93,647.72 5,618.86
Mean 93,389.11 5,631.94
The table shows the mean for Pre-tax household income and the Outdoor homeware spend of
Sunshine City.
The table shows the Variance for Pre-tax household income and the Outdoor homeware spend of
Sunshine City.
The Sunshine City analysis shows that the spending power of the people of Brisbane is high
especially those of high income. The marketing strategies employed by the company should
target these people with a higher spending power in order to increase sales. This data has been
selected to show the spending power of the population in consideration of income.
Paraphrase This Document
Need a fresh take? Get an instant paraphrase of this document with our AI Paraphraser
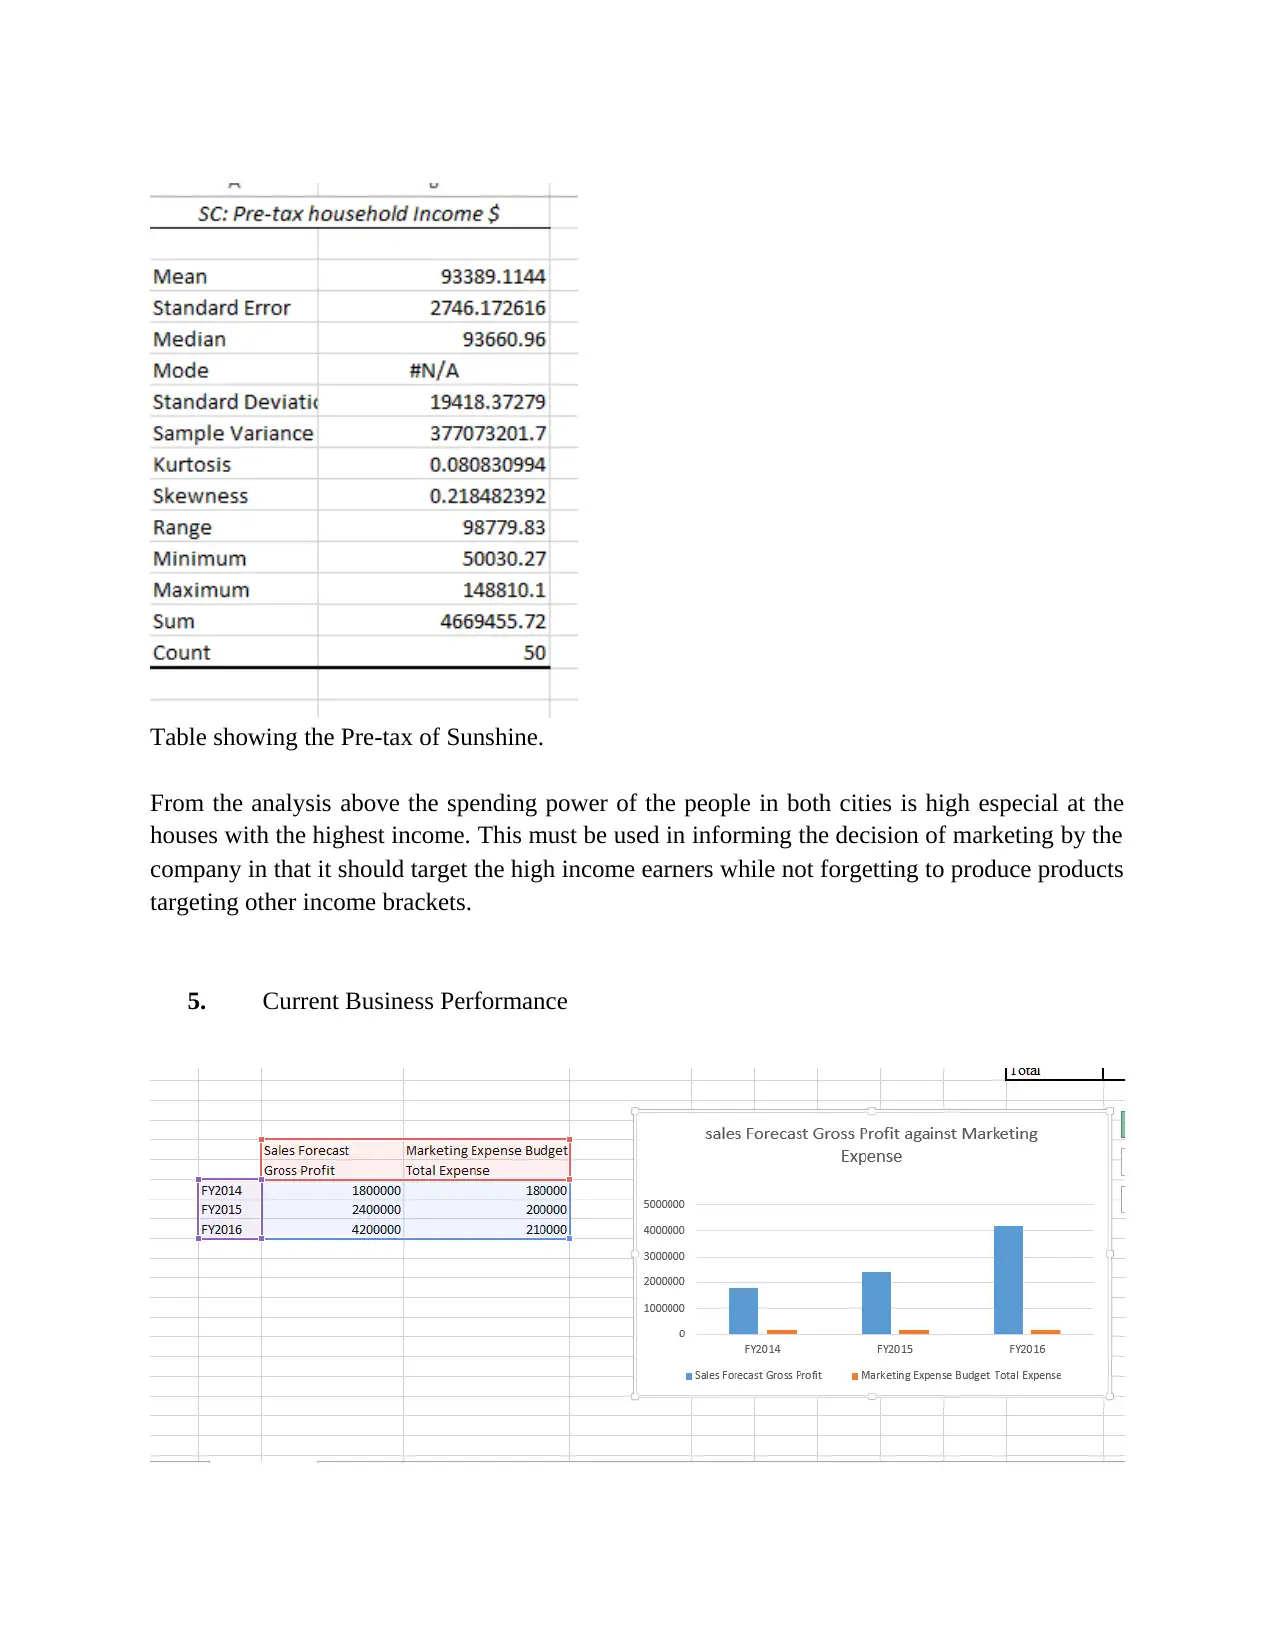
Table showing the Pre-tax of Sunshine.
From the analysis above the spending power of the people in both cities is high especial at the
houses with the highest income. This must be used in informing the decision of marketing by the
company in that it should target the high income earners while not forgetting to produce products
targeting other income brackets.
5. Current Business Performance
The table shows the Sales Forecast Gross profit against the Marketing Expense chart.
From the results in the chart the sales of the BBQfun have increased gradually over the years
owing to the increase in the funds set aside for the purpose of marketing. The company should
set aside enough resources and time to do marketing of their product since the sales increase
proportionally with a high marketing funding.
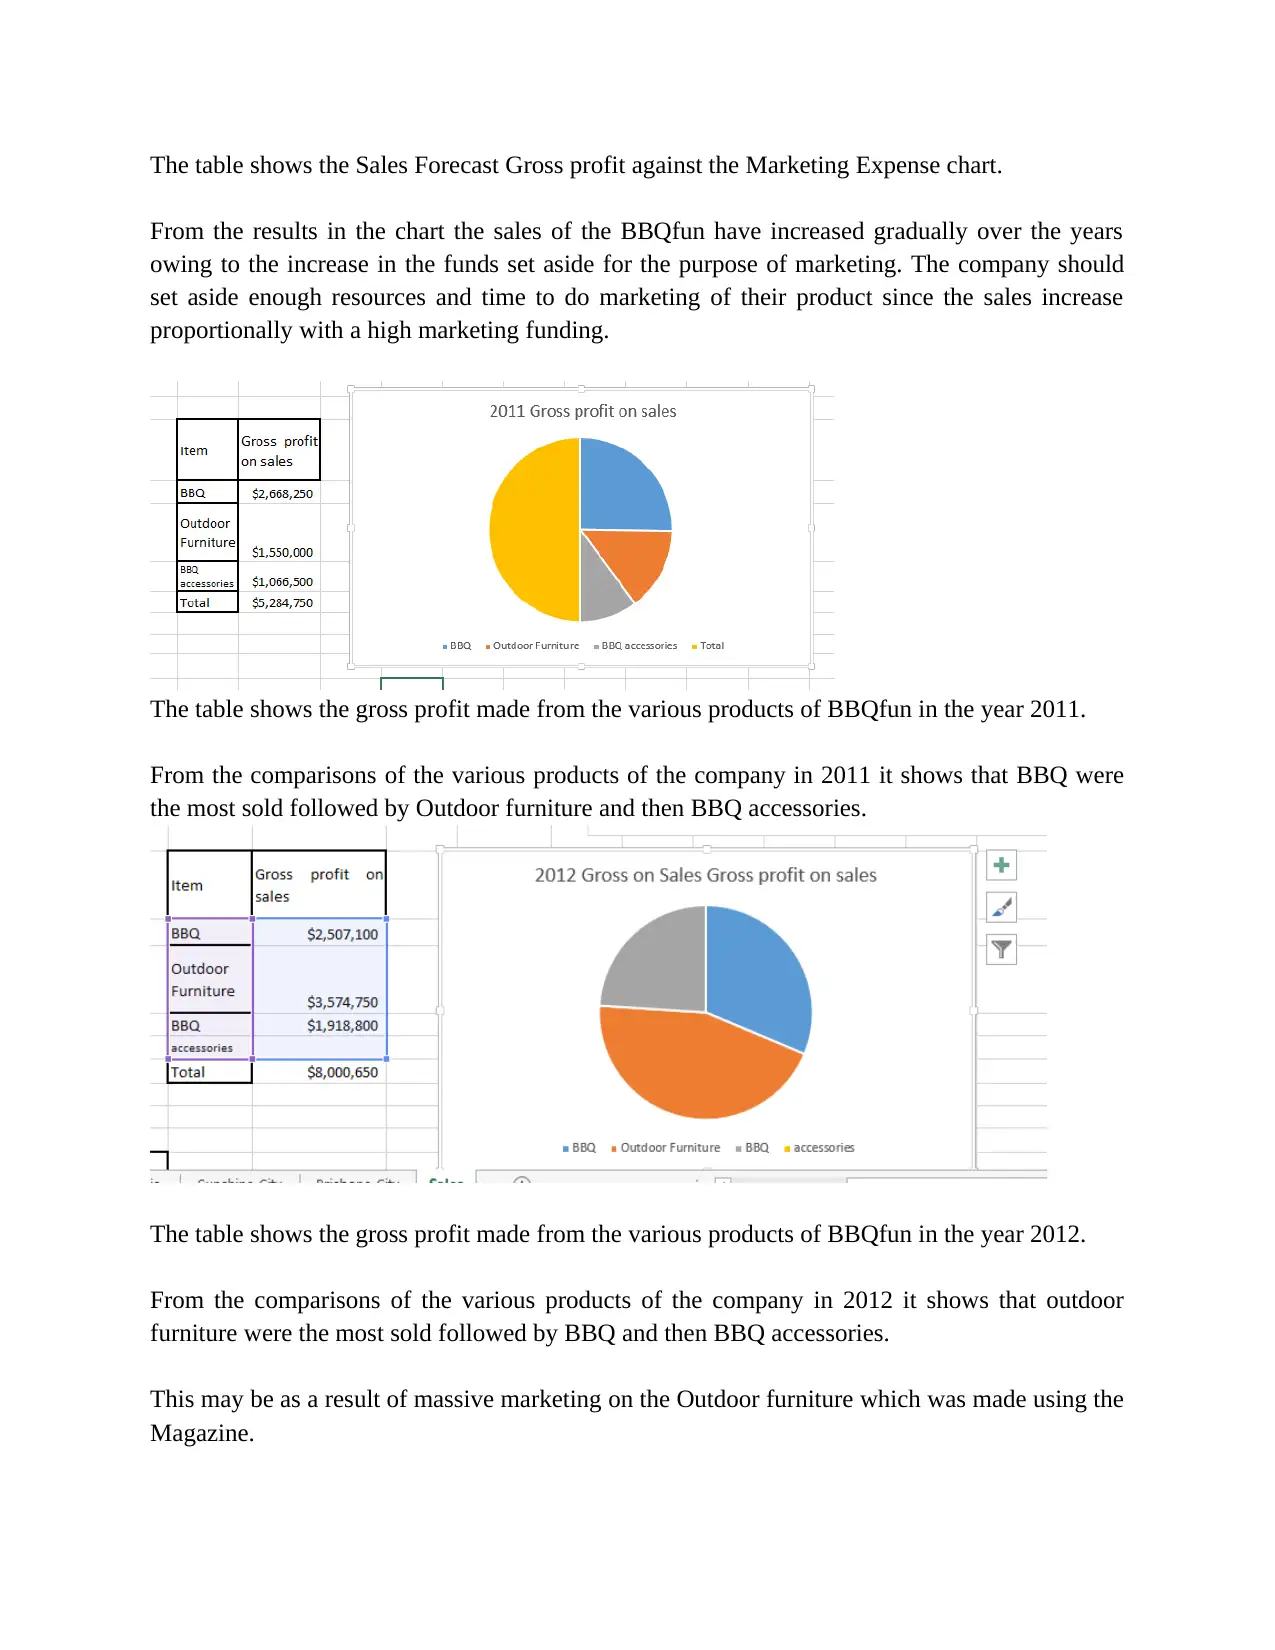
The table shows the gross profit made from the various products of BBQfun in the year 2011.
From the comparisons of the various products of the company in 2011 it shows that BBQ were
the most sold followed by Outdoor furniture and then BBQ accessories.
The table shows the gross profit made from the various products of BBQfun in the year 2012.
From the comparisons of the various products of the company in 2012 it shows that outdoor
furniture were the most sold followed by BBQ and then BBQ accessories.
This may be as a result of massive marketing on the Outdoor furniture which was made using the
Magazine.
From the results in the chart the sales of the BBQfun have increased gradually over the years
owing to the increase in the funds set aside for the purpose of marketing. The company should
set aside enough resources and time to do marketing of their product since the sales increase
proportionally with a high marketing funding.
The table shows the gross profit made from the various products of BBQfun in the year 2011.
From the comparisons of the various products of the company in 2011 it shows that BBQ were
the most sold followed by Outdoor furniture and then BBQ accessories.
The table shows the gross profit made from the various products of BBQfun in the year 2012.
From the comparisons of the various products of the company in 2012 it shows that outdoor
furniture were the most sold followed by BBQ and then BBQ accessories.
This may be as a result of massive marketing on the Outdoor furniture which was made using the
Magazine.
⊘ This is a preview!⊘
Do you want full access?
Subscribe today to unlock all pages.
Trusted by 1+ million students worldwide
1 out of 16
Related Documents


Your All-in-One AI-Powered Toolkit for Academic Success.
+13062052269
info@desklib.com
Available 24*7 on WhatsApp / Email
![[object Object]](/_next/static/media/star-bottom.7253800d.svg)
Unlock your academic potential
Copyright © 2020–2026 A2Z Services. All Rights Reserved. Developed and managed by ZUCOL.