Statistics Assignment: B.Com HRM, Semester 1, University Name

Verified

Added on  2022/12/19

|8
|855
|55
Homework Assignment
AI Summary
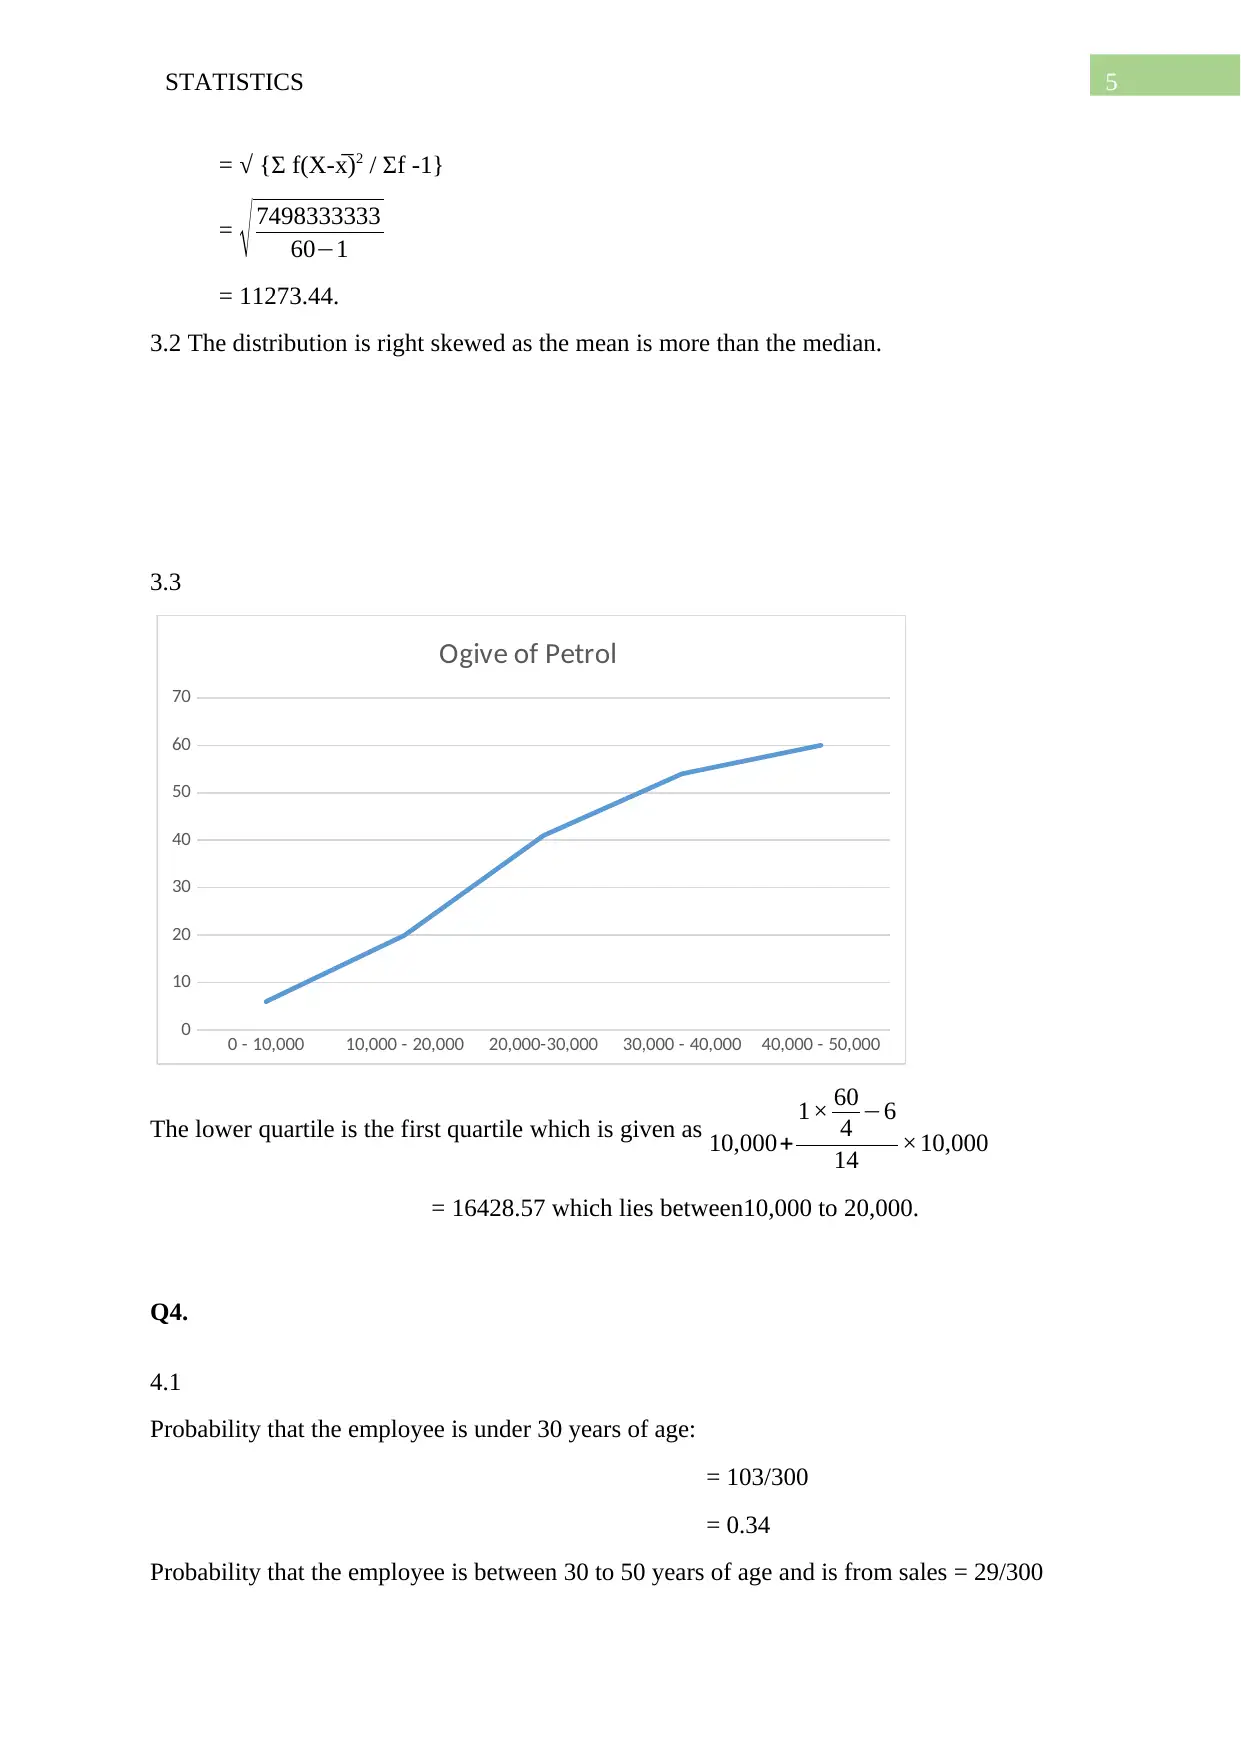
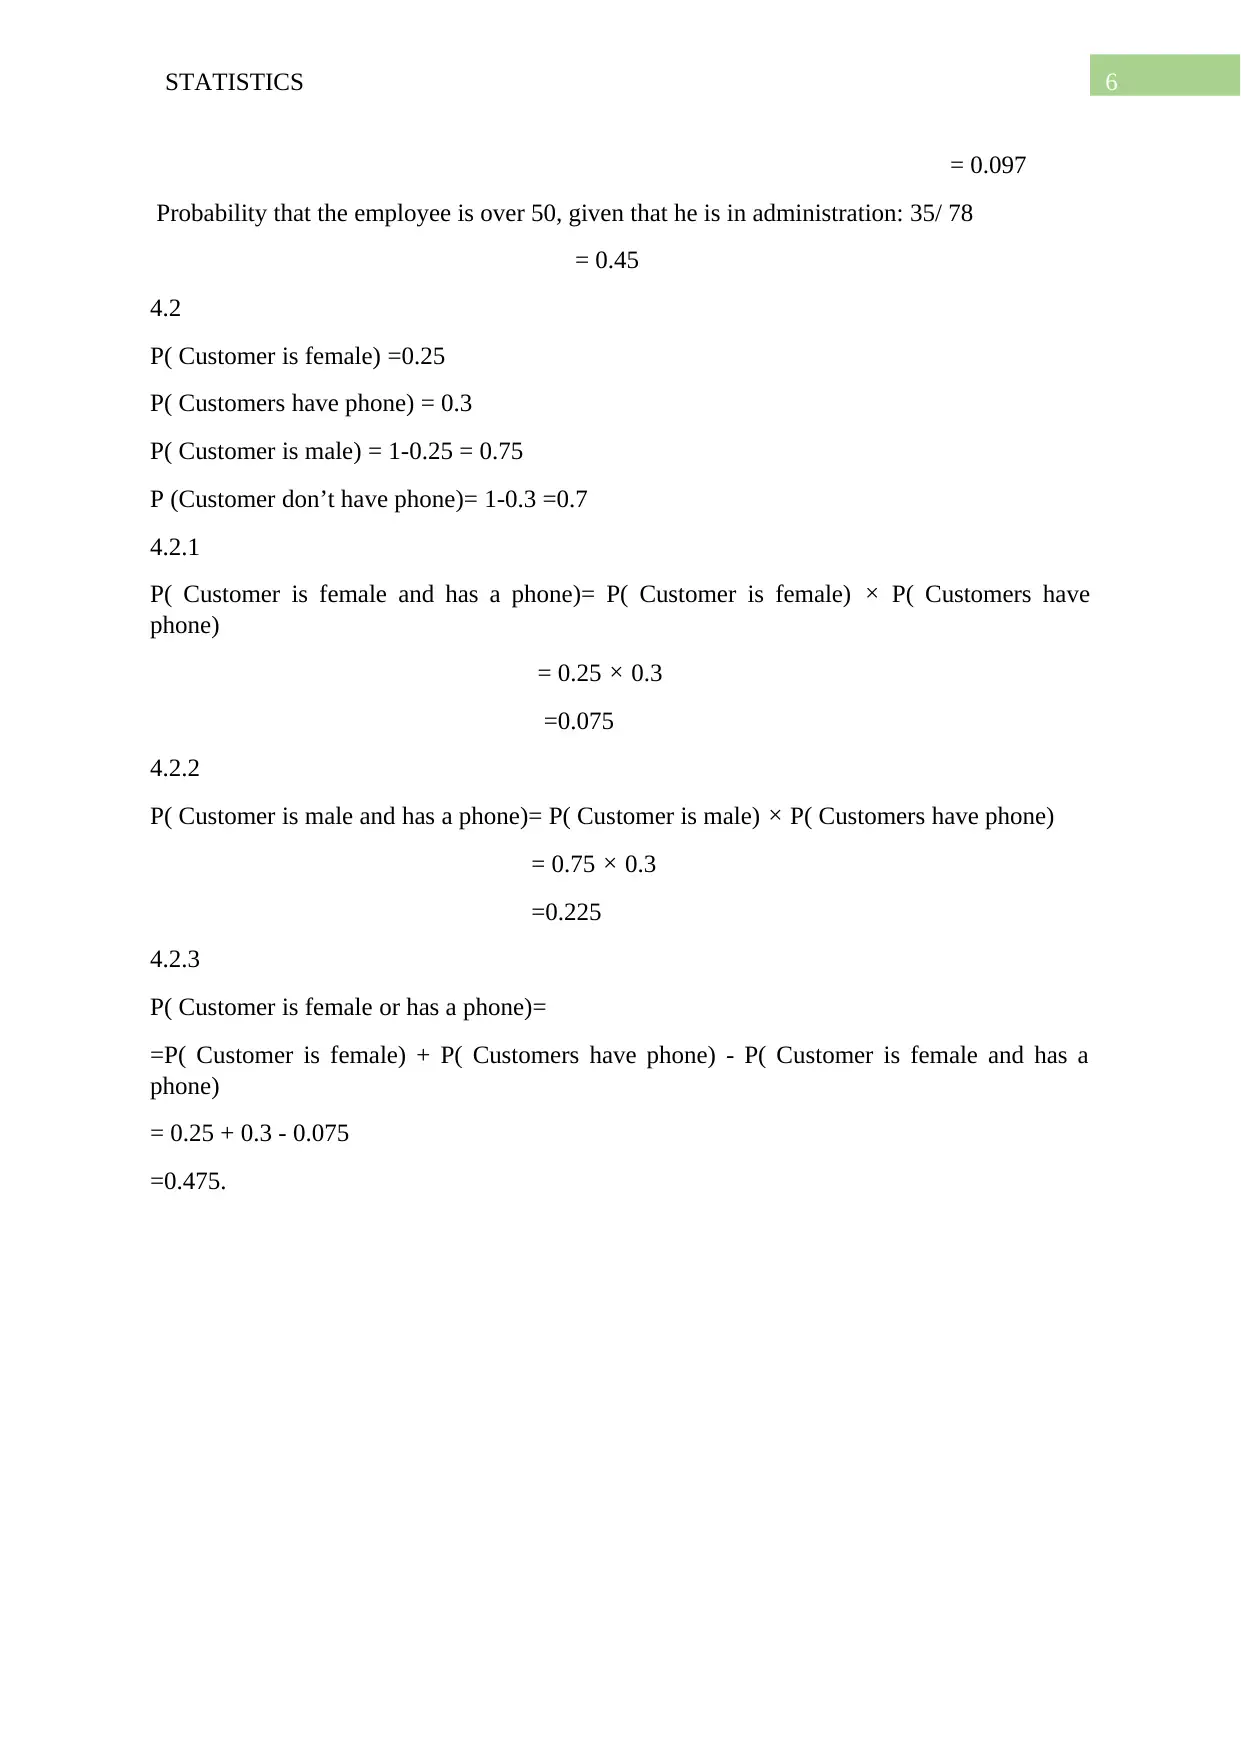
This statistics assignment solution covers a range of statistical concepts, starting with calculations involving exponents and fractions, and progressing to more complex topics. The assignment includes detailed solutions to questions on exponents, fractions, and scientific notation. Further, it delves into descriptive statistics, calculating the mean, median, interquartile range, and standard deviation for given datasets. The solution also tackles probability problems, including conditional probability and the application of probability rules. The assignment also includes the calculation of mode, deciles, and the construction of an ogive. The solutions are comprehensive, showing all the necessary steps and calculations, making it a valuable resource for students studying statistics. This assignment is beneficial for students enrolled in a B.Com HRM program.
Document Page
Running head: STATISTICS
Statistics
Name of the University:
Name of the Student:
tabler-icon-diamond-filled.svg

Paraphrase This Document

Need a fresh take? Get an instant paraphrase of this document with our AI Paraphraser
Document Page
1STATISTICS
Table of Contents
Q1...............................................................................................................................................2
Q2...............................................................................................................................................3
Q3...............................................................................................................................................4
Q4...............................................................................................................................................5
References:.................................................................................................................................7
Document Page
2STATISTICS
Q1.
1.1
1.1.1
34 × 32 ×21= 34 2
2 = 32
2 =4.5.
1.1.2
13+6-(-8)/4-(3+2)-6= 19+8
456 = 27
7 = -27/7 = -3.86.
1.1.3
3
4 + 1
3 ÷ 2
12 1
2 = 3
4 + 1
3 × 12
2 1
2 = 3
4 +2 1
2 =2+ 1
4 =2.25 .
1.1.4
4
16 × ( 23 × 1
22 ) = ( 24 )
1
4 × 232=22=4.
1.2
0.025= 25
1000 = 1
40
0.231= 231
1000
13.25= 1325
1000 =¿ 265
200 = 53
40
1.3
1.3.1
23.87 = 2.387 ×10.
0.00046 = 4.6 ×10⁴
3564.8 = 3.56483 ×10³
1.4
Unit of sugar required to make a bottle of soft drink = 50g
Unit of water required to make a bottle of soft drink= 800 ml
Unit of orange syrup required to make a bottle of soft drink= 100 g
Therefore, no of bottles the group can make is the smallest integer value of [310/50],
[6000/800] , [590/100] i.e 6, 7 and 5.9
Document Page
3STATISTICS
Therefore, the group can make 5 bottles of soft drink.
1.5
Let the the cost of the shoes be R x.
According to question:
0.55= (799.95 – x) / x
1.55 x=799.95
x=¿799.95/1.55
= 516.096
The owner of the shoe outlet can pay R 516.096 for the shoes.
1.6
4.8 percentage points increase from 26.5 to 31.3 represents the people who favored the
candidate went up by 4.8 in the sample survey.
Q2.
2.1
2.1.1
Mean of the data: 211.3793
2.1.2
Median of the data: 220
2.1.3
Interquartile Range: 285- 145 =140
2.1.4
Std Deviation: 104.3252
2.2
The weekly spending has an average of approximately R 212.
2.3
Let the value of the number removed be x.
Sum of all the six numbers = Mean ×6
tabler-icon-diamond-filled.svg

Paraphrase This Document

Need a fresh take? Get an instant paraphrase of this document with our AI Paraphraser
Document Page
4STATISTICS
= 8 ×6 = 48.
When x is removed, the sum of the remaining 5 numbers= Mean ×5
= 10×5=50.
But x is the difference between the two sums.
x=4850=2.
Q3.
3.1.1
Mean = (Σfx) / Σf)
= 1490000/60
=24833.3333
3.1.2
Median= L+ (n/2 – C) × w
f
= 24761.9
3.1.3
Mode = L+ f m ¿ f m 1
¿ ¿ ¿ ¿
=20000+ 2114
( 2114 ) + ( 2113 ) × 10000.
= 20000+4666.66
=24666.67
3.1.4 The 4 th Decile lies in the group 20,000- 30,000.
Thus, D4 = L+
¿
10 c . f
f
.w
= 20,000 +(
4 × 60
10 20
21 ) ×10,000.
= 20,000+1904.76
= 21904.76
3.1.5
Standard Deviation:
Document Page
5STATISTICS
= √ {Σ f(X-x̅)2 / Σf -1}
= 7498333333
601
= 11273.44.
3.2 The distribution is right skewed as the mean is more than the median.
3.3
0 - 10,000 10,000 - 20,000 20,000-30,000 30,000 - 40,000 40,000 - 50,000
0
10
20
30
40
50
60
70
Ogive of Petrol
The lower quartile is the first quartile which is given as 10,000+
1× 60
4 6
14 ×10,000
= 16428.57 which lies between10,000 to 20,000.
Q4.
4.1
Probability that the employee is under 30 years of age:
= 103/300
= 0.34
Probability that the employee is between 30 to 50 years of age and is from sales = 29/300
Document Page
6STATISTICS
= 0.097
Probability that the employee is over 50, given that he is in administration: 35/ 78
= 0.45
4.2
P( Customer is female) =0.25
P( Customers have phone) = 0.3
P( Customer is male) = 1-0.25 = 0.75
P (Customer don’t have phone)= 1-0.3 =0.7
4.2.1
P( Customer is female and has a phone)= P( Customer is female) × P( Customers have
phone)
= 0.25 × 0.3
=0.075
4.2.2
P( Customer is male and has a phone)= P( Customer is male) × P( Customers have phone)
= 0.75 × 0.3
=0.225
4.2.3
P( Customer is female or has a phone)=
=P( Customer is female) + P( Customers have phone) - P( Customer is female and has a
phone)
= 0.25 + 0.3 - 0.075
=0.475.
tabler-icon-diamond-filled.svg

Paraphrase This Document

Need a fresh take? Get an instant paraphrase of this document with our AI Paraphraser
Document Page
7STATISTICS
References:
Rohatgi, V.K. and Saleh, A.M.E., 2015. An introduction to probability and statistics. John
Wiley & Sons.
Nelson, S.L. and Nelson, E.C., 2014. Excel data analysis for dummies. John Wiley & Sons.
chevron_up_icon
1 out of 8
circle_padding
hide_on_mobile
zoom_out_icon
[object Object]