BE279 Applied Statistics & Forecasting: Salary Factors Analysis
VerifiedAdded on 2023/06/12
|15
|3132
|329
Report
AI Summary
This report applies statistical forecasting to analyze the relationship between faculty salary and factors like publication, position, and university using regression analysis and ANOVA. It also explores the impact of company size and cooperation on innovation within UK companies, employing factor analysis, one-way ANOVA, and cluster analysis. The study uses SPSS to process secondary data from 787 interviews, examining autocorrelation, collinearity, and error distribution. The results indicate a significant relationship between salary and the considered factors, as well as a notable, though moderate, association between innovation and company characteristics. The report concludes with a discussion of these findings, supported by existing literature, and highlights the implications for understanding salary determinants and innovation drivers.
BE279 Applied Statistics and Forecasting
Paraphrase This Document
Need a fresh take? Get an instant paraphrase of this document with our AI Paraphraser
TABLE OF CONTENTS
INTRODUCTION.........................................................................................................................2
METHOOLOGY AND DATA.....................................................................................................2
ANALYSIS AND RESULTS........................................................................................................3
Task 1..........................................................................................................................................3
Task 2..........................................................................................................................................7
DISCUSSION...............................................................................................................................11
CONCLUSION............................................................................................................................12
REFERENCES............................................................................................................................14
INTRODUCTION
Statistical forecasting is mainly implies that the use of statistics based upon the historical
data of a project so that it will be easy to determine the same in future. This is mainly used in the
quantitative data in order to determine the interdependence between the variables. The present
study is also helpful to develop a deep understanding pertaining to statistics and tool used to
determine the answers. For that, there are two topics on which the entire study is based. such that
under first, study will determine the relationship between salary and other casual factors by using
an inferential tool. Thus, to check the autocorreltion, different test will be applied which include
Durbin-Watson test, residual analysis), collinearity (VIF), and error distribution. Moreover,
under topic 2, the study will examine how an innovation developed by the companies has change
through its casual factors and by using different inferential tool, the present study will explain the
results.
METHOOLOGY AND DATA
Research type: Quantitative research type has been adopted for the present study in
which numbers and figures has been considered in order to derive a valid outcome (Nayak and
Singh, 2021). In order to analyse the association between the variables, only quantitative
research type will be beneficial.
Research approach and philosophy: In accordance with the research type, deductive
approach and interpretivism philosophy has been adopted that assist to examine the relationship
between salary and casual factors effectively (Snyder, 2019). This in turn assist to determine the
valid outcome and answer the research questions as well.
Data collection: The entire study is based upon secondary data collection methods in
which responses have been gathered from previously conducted research so that the relationship
can be identified. In this, 787 people has been interviewed and this is further supported by
different inferential tool so that effective outcome can be generated (Mohajan, 2018). Along with
this, under discussion chapter, the sources has been further selected that helps to support the
results so that effective outcome can be generated.
⊘ This is a preview!⊘
Do you want full access?
Subscribe today to unlock all pages.
Trusted by 1+ million students worldwide
Data analysis: In order to analyse the data effectually, SPSS software has been used
which help to ascertain the hypothesis and formulate the results (Pandey and Pandey, 2021). In
this, regression and anova as an inferential tool will be used to determine an association and
further with the help of table and graphs the report will present the data in an effective manner.
ANALYSIS AND RESULTS
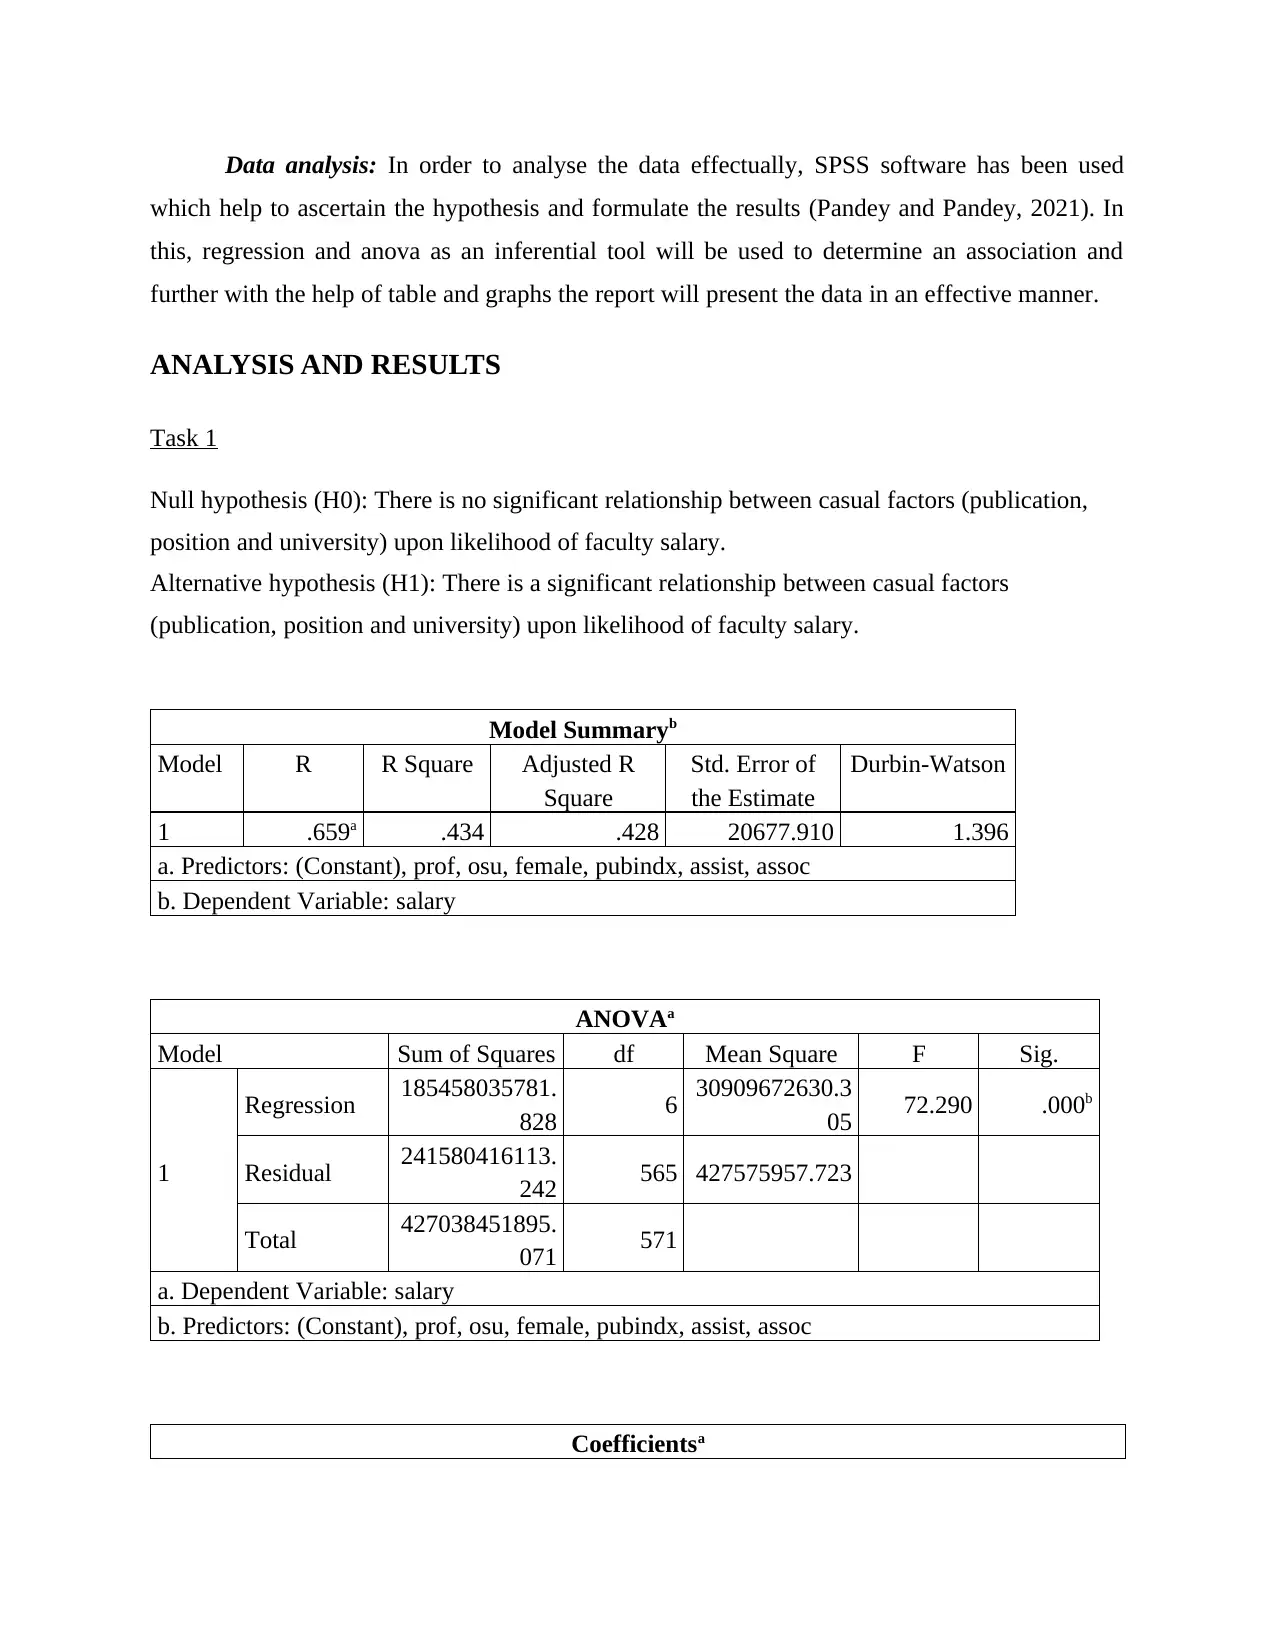
Task 1
Null hypothesis (H0): There is no significant relationship between casual factors (publication,
position and university) upon likelihood of faculty salary.
Alternative hypothesis (H1): There is a significant relationship between casual factors
(publication, position and university) upon likelihood of faculty salary.
Model Summaryb
Model R R Square Adjusted R
Square
Std. Error of
the Estimate
Durbin-Watson
1 .659a .434 .428 20677.910 1.396
a. Predictors: (Constant), prof, osu, female, pubindx, assist, assoc
b. Dependent Variable: salary
ANOVAa
Model Sum of Squares df Mean Square F Sig.
1
Regression 185458035781.
828 6 30909672630.3
05 72.290 .000b
Residual 241580416113.
242 565 427575957.723
Total 427038451895.
071 571
a. Dependent Variable: salary
b. Predictors: (Constant), prof, osu, female, pubindx, assist, assoc
Coefficientsa
which help to ascertain the hypothesis and formulate the results (Pandey and Pandey, 2021). In
this, regression and anova as an inferential tool will be used to determine an association and
further with the help of table and graphs the report will present the data in an effective manner.
ANALYSIS AND RESULTS
Task 1
Null hypothesis (H0): There is no significant relationship between casual factors (publication,
position and university) upon likelihood of faculty salary.
Alternative hypothesis (H1): There is a significant relationship between casual factors
(publication, position and university) upon likelihood of faculty salary.
Model Summaryb
Model R R Square Adjusted R
Square
Std. Error of
the Estimate
Durbin-Watson
1 .659a .434 .428 20677.910 1.396
a. Predictors: (Constant), prof, osu, female, pubindx, assist, assoc
b. Dependent Variable: salary
ANOVAa
Model Sum of Squares df Mean Square F Sig.
1
Regression 185458035781.
828 6 30909672630.3
05 72.290 .000b
Residual 241580416113.
242 565 427575957.723
Total 427038451895.
071 571
a. Dependent Variable: salary
b. Predictors: (Constant), prof, osu, female, pubindx, assist, assoc
Coefficientsa
Paraphrase This Document
Need a fresh take? Get an instant paraphrase of this document with our AI Paraphraser
Model Unstandardized
Coefficients
Standardized
Coefficients
t Sig. Collinearity
Statistics
B Std. Error Beta Tolerance VIF
1
(Constant) 64884.788 6643.615 9.766 .000
assist -
14300.375 7165.398 -.152 -1.996 .046 .173 5.775
assoc -9498.573 6878.987 -.135 -1.381 .168 .105 9.557
prof 15387.342 6668.421 .257 2.307 .021 .081 12.383
female 2648.341 3283.388 .027 .807 .420 .919 1.088
osu 3606.315 3038.545 .038 1.187 .236 .980 1.021
pubindx 255.486 22.857 .379 11.178 .000 .869 1.151
a. Dependent Variable: salary
Collinearity Diagnosticsa
Model Dimensio
n
Eigenvalu
e
Conditio
n Index
Variance Proportions
(Constant
)
assist asso
c
pro
f
femal
e
os
u
pubind
x
1
1 2.838 1.000 .00 .00 .00 .00 .01 .02 .04
2 1.286 1.485 .00 .02 .01 .00 .23 .01 .03
3 1.014 1.673 .00 .08 .03 .00 .01 .05 .00
4 .845 1.832 .00 .02 .00 .00 .02 .90 .00
5 .702 2.011 .00 .03 .03 .00 .66 .00 .00
6 .306 3.045 .01 .00 .00 .01 .07 .00 .93
7 .009 18.121 .99 .85 .92 .98 .00 .01 .00
a. Dependent Variable: salary
Residuals Statisticsa
Minimum Maximum Mean Std. Deviation N
Predicted Value 50584.41 143862.52 83674.70 18022.074 572
Residual -60905.223 110653.781 .000 20568.982 572
Std. Predicted Value -1.836 3.340 .000 1.000 572
Std. Residual -2.945 5.351 .000 .995 572
a. Dependent Variable: salary
Charts
Coefficients
Standardized
Coefficients
t Sig. Collinearity
Statistics
B Std. Error Beta Tolerance VIF
1
(Constant) 64884.788 6643.615 9.766 .000
assist -
14300.375 7165.398 -.152 -1.996 .046 .173 5.775
assoc -9498.573 6878.987 -.135 -1.381 .168 .105 9.557
prof 15387.342 6668.421 .257 2.307 .021 .081 12.383
female 2648.341 3283.388 .027 .807 .420 .919 1.088
osu 3606.315 3038.545 .038 1.187 .236 .980 1.021
pubindx 255.486 22.857 .379 11.178 .000 .869 1.151
a. Dependent Variable: salary
Collinearity Diagnosticsa
Model Dimensio
n
Eigenvalu
e
Conditio
n Index
Variance Proportions
(Constant
)
assist asso
c
pro
f
femal
e
os
u
pubind
x
1
1 2.838 1.000 .00 .00 .00 .00 .01 .02 .04
2 1.286 1.485 .00 .02 .01 .00 .23 .01 .03
3 1.014 1.673 .00 .08 .03 .00 .01 .05 .00
4 .845 1.832 .00 .02 .00 .00 .02 .90 .00
5 .702 2.011 .00 .03 .03 .00 .66 .00 .00
6 .306 3.045 .01 .00 .00 .01 .07 .00 .93
7 .009 18.121 .99 .85 .92 .98 .00 .01 .00
a. Dependent Variable: salary
Residuals Statisticsa
Minimum Maximum Mean Std. Deviation N
Predicted Value 50584.41 143862.52 83674.70 18022.074 572
Residual -60905.223 110653.781 .000 20568.982 572
Std. Predicted Value -1.836 3.340 .000 1.000 572
Std. Residual -2.945 5.351 .000 .995 572
a. Dependent Variable: salary
Charts
⊘ This is a preview!⊘
Do you want full access?
Subscribe today to unlock all pages.
Trusted by 1+ million students worldwide
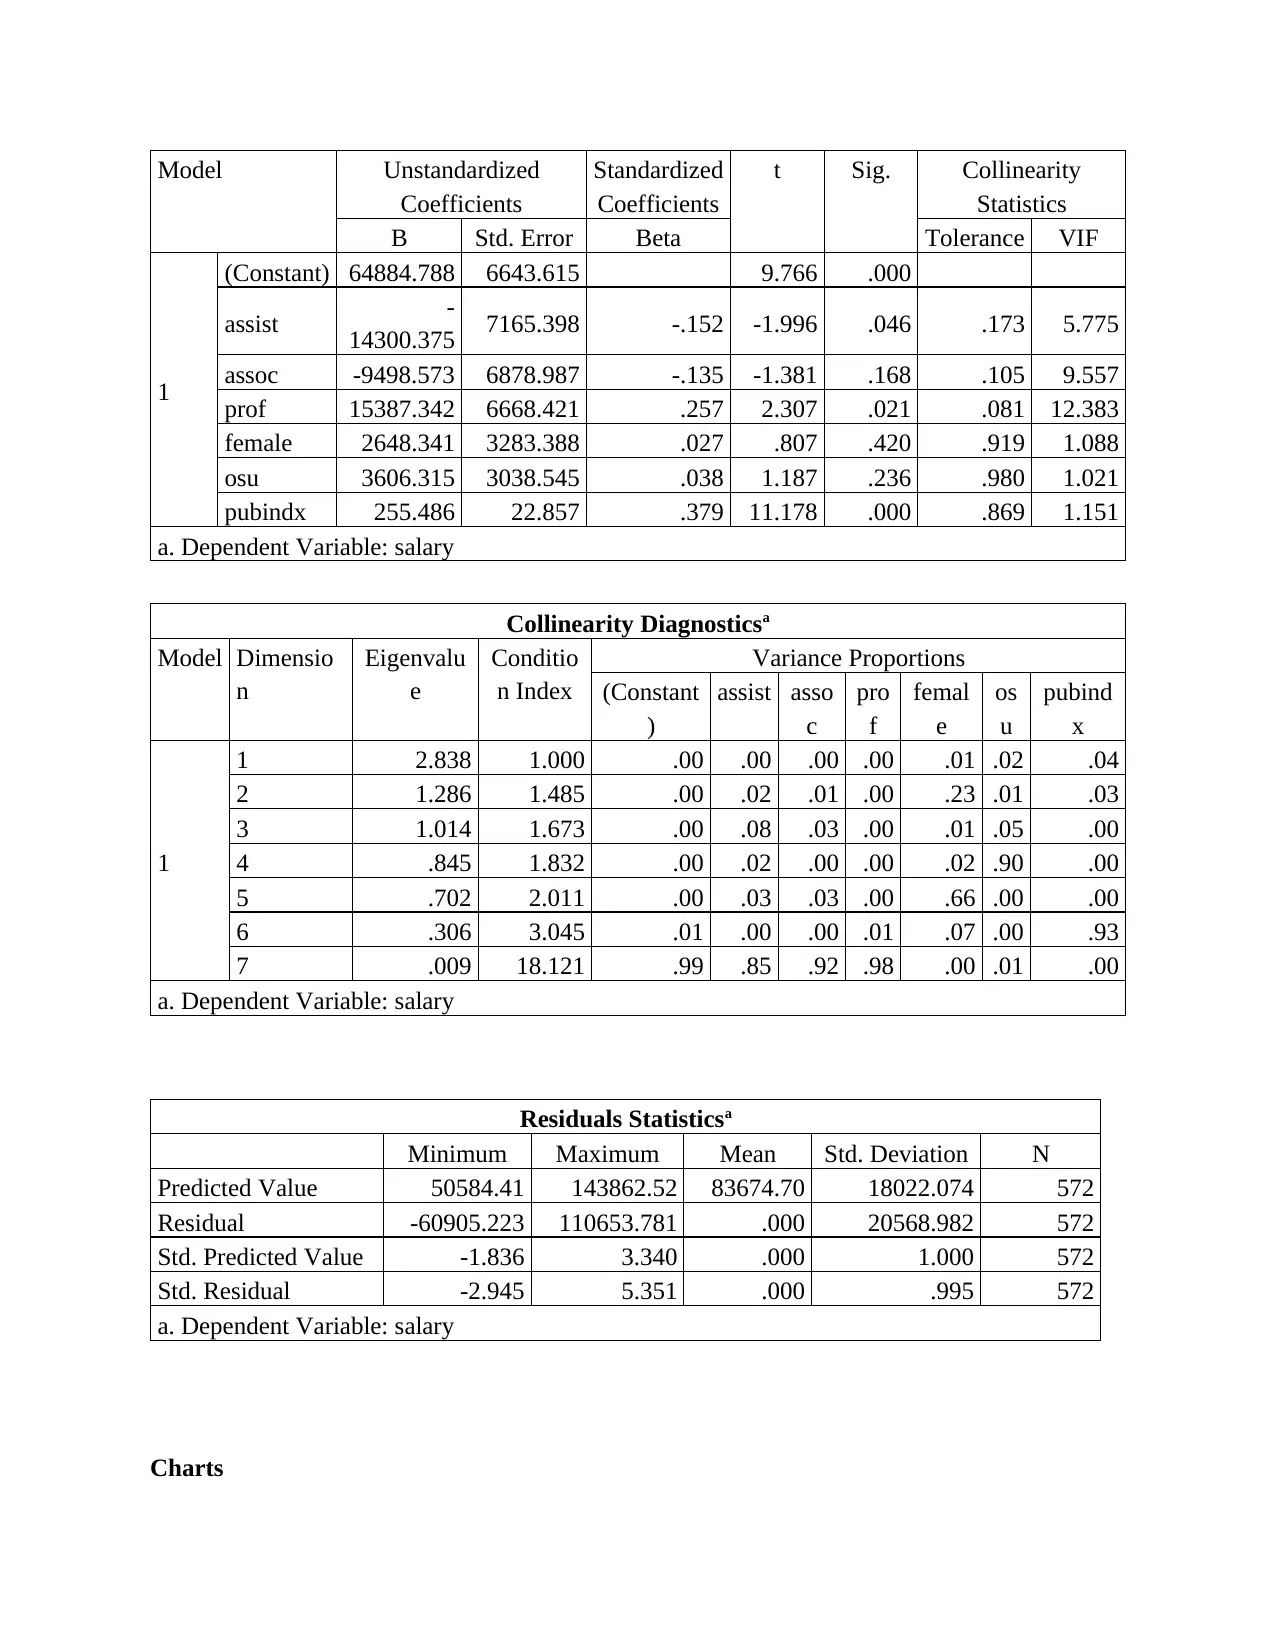
Interpretation: Through the model summary table, it has been analysed that the there is
a moderate relationship between salary and casual factors which in turn reflected that there is a
change identified over salary when a minor fluctuation identified over casual factors. Moreover,
as per the r square value it has been also identified that there is only 43% change in the salary of
the selected respondents. This in turn entails that there is a change examined over dependent
variable due to fluctuate in independent variable.
As per the anova table, it has been reflected that there is a significant difference between
the salary and other casual factors because the value of p is 0.00 which is lower than 0.05 and
this in turn reflected that alternative hypothesis is accepted. That is why, it can be stated that due
to change in publication, states and gender, the salary will be fluctuated.
Paraphrase This Document
Need a fresh take? Get an instant paraphrase of this document with our AI Paraphraser
Moreover, with the help of durbin Watson test (value is 1.3), it has been identified that
there is positive autocorrelation between the variable and that is why, the variables i.e. salary and
casual factors have a direct relationship with others.
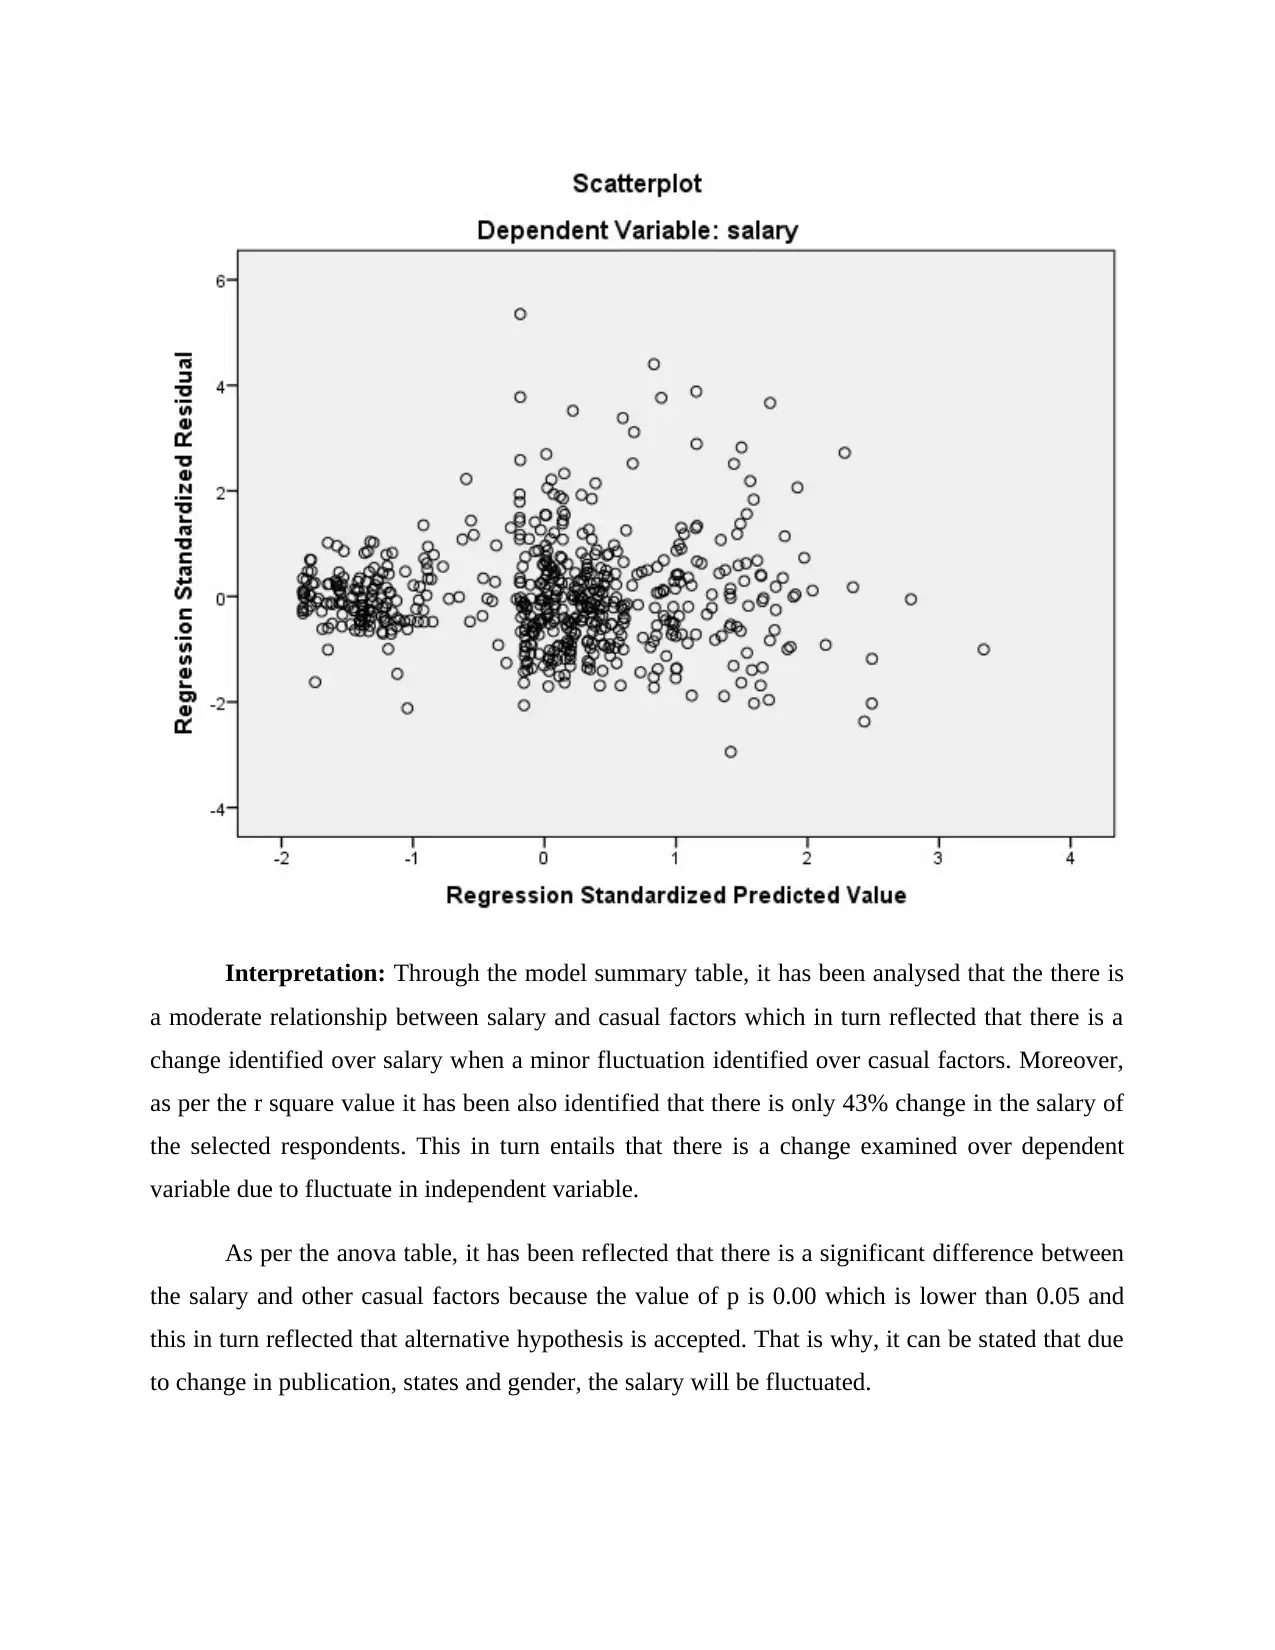
As per the scatter plot and residual statistics, it has been identified that when plotted
against the predictor variable, the variability is constant across different values of predictor
variable. That is why it can be stated that the observed value did not be varies more from
predicted one and that is why, it helps to generate a better result.
According to collinearity statistics under coefficient table, it has been identified that the
value obtained VIF value is lies in between 0 to 10 in all cases except professor. This in turn
shows that only in professor case, the collinearity issue has identified which need to be removed
in order to generate a better outcome.
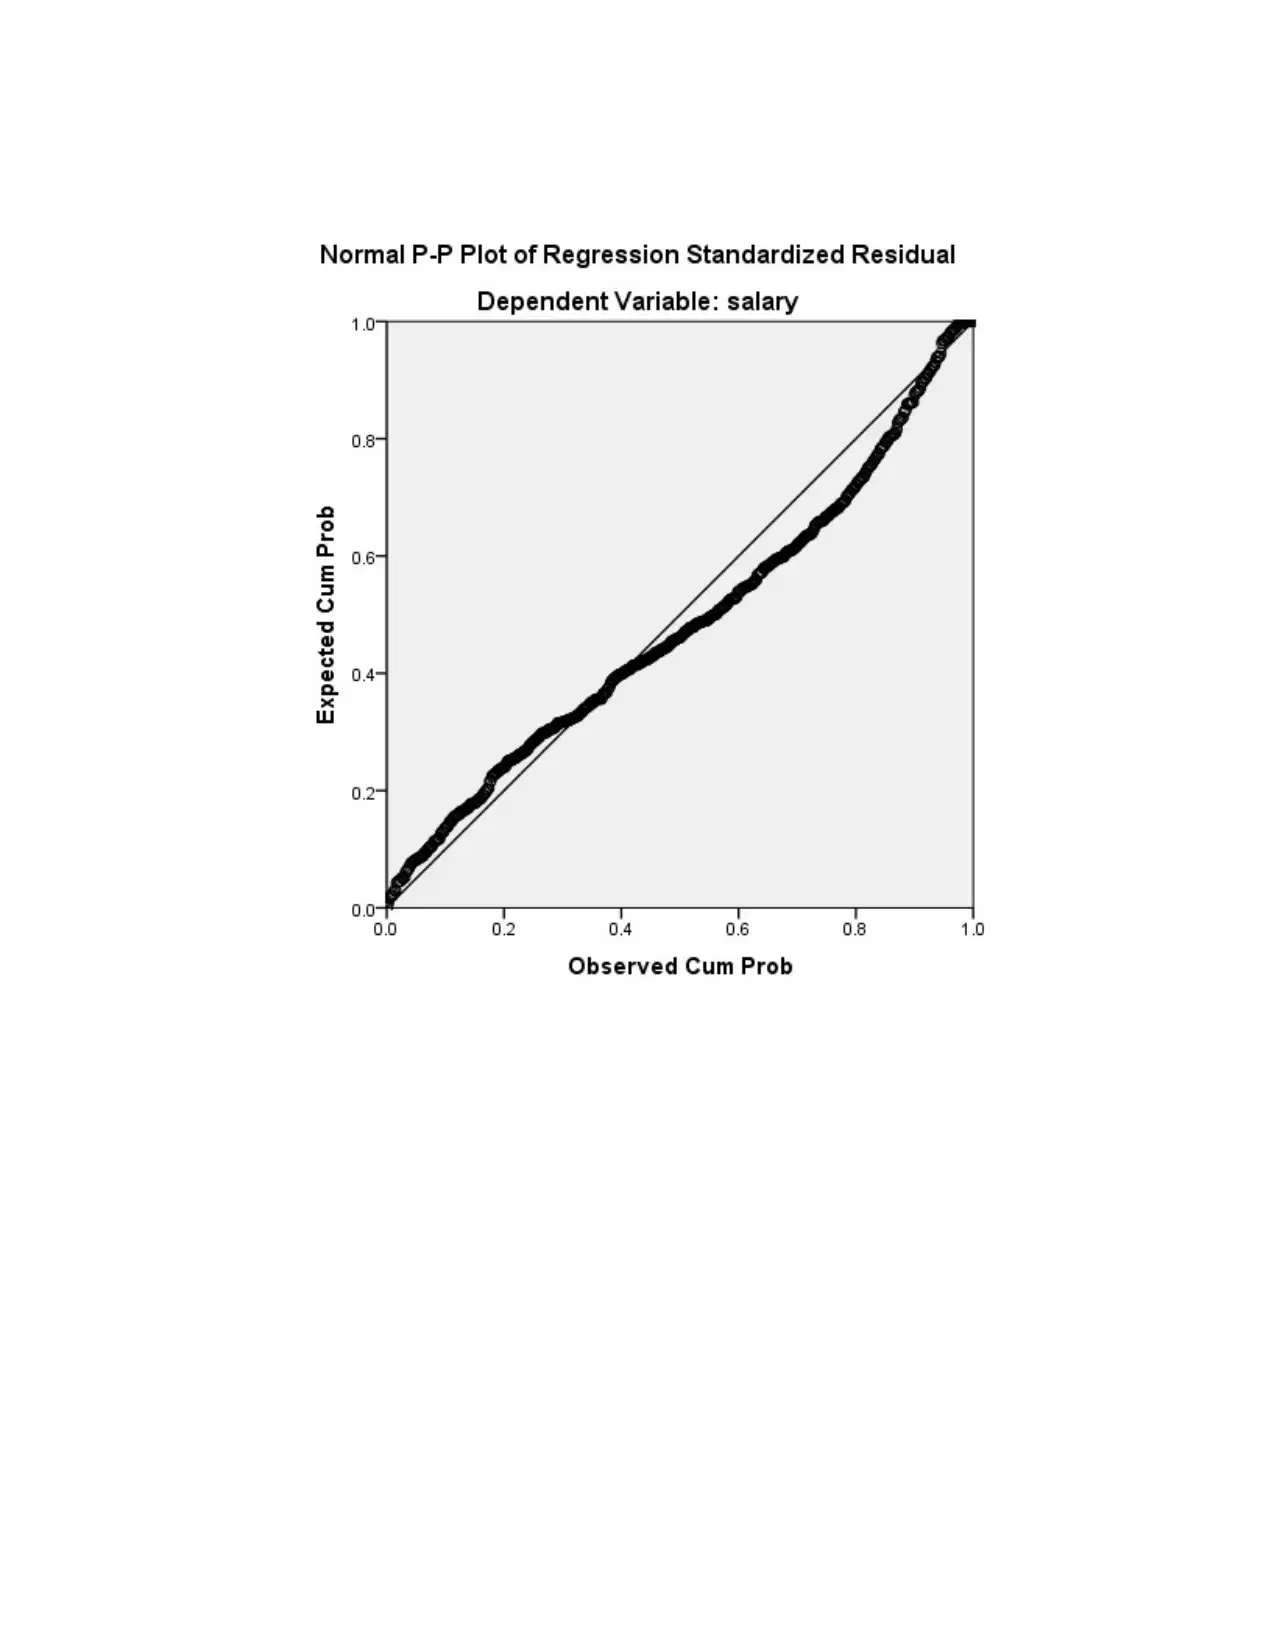
The error of distribution can be determined under a graph named as observed cumulative
probability in which little circles follow the normality line and that is why, it can be stated that
there is no drastic deviation and the inter-dependence of the variables may be depend upon each
other.
Task 2
Factor analysis
KMO and Bartlett's Test
Kaiser-Meyer-Olkin Measure of Sampling
Adequacy. .741
Bartlett's Test of
Sphericity
Approx. Chi-Square 3589.475
df 10
Sig. .000
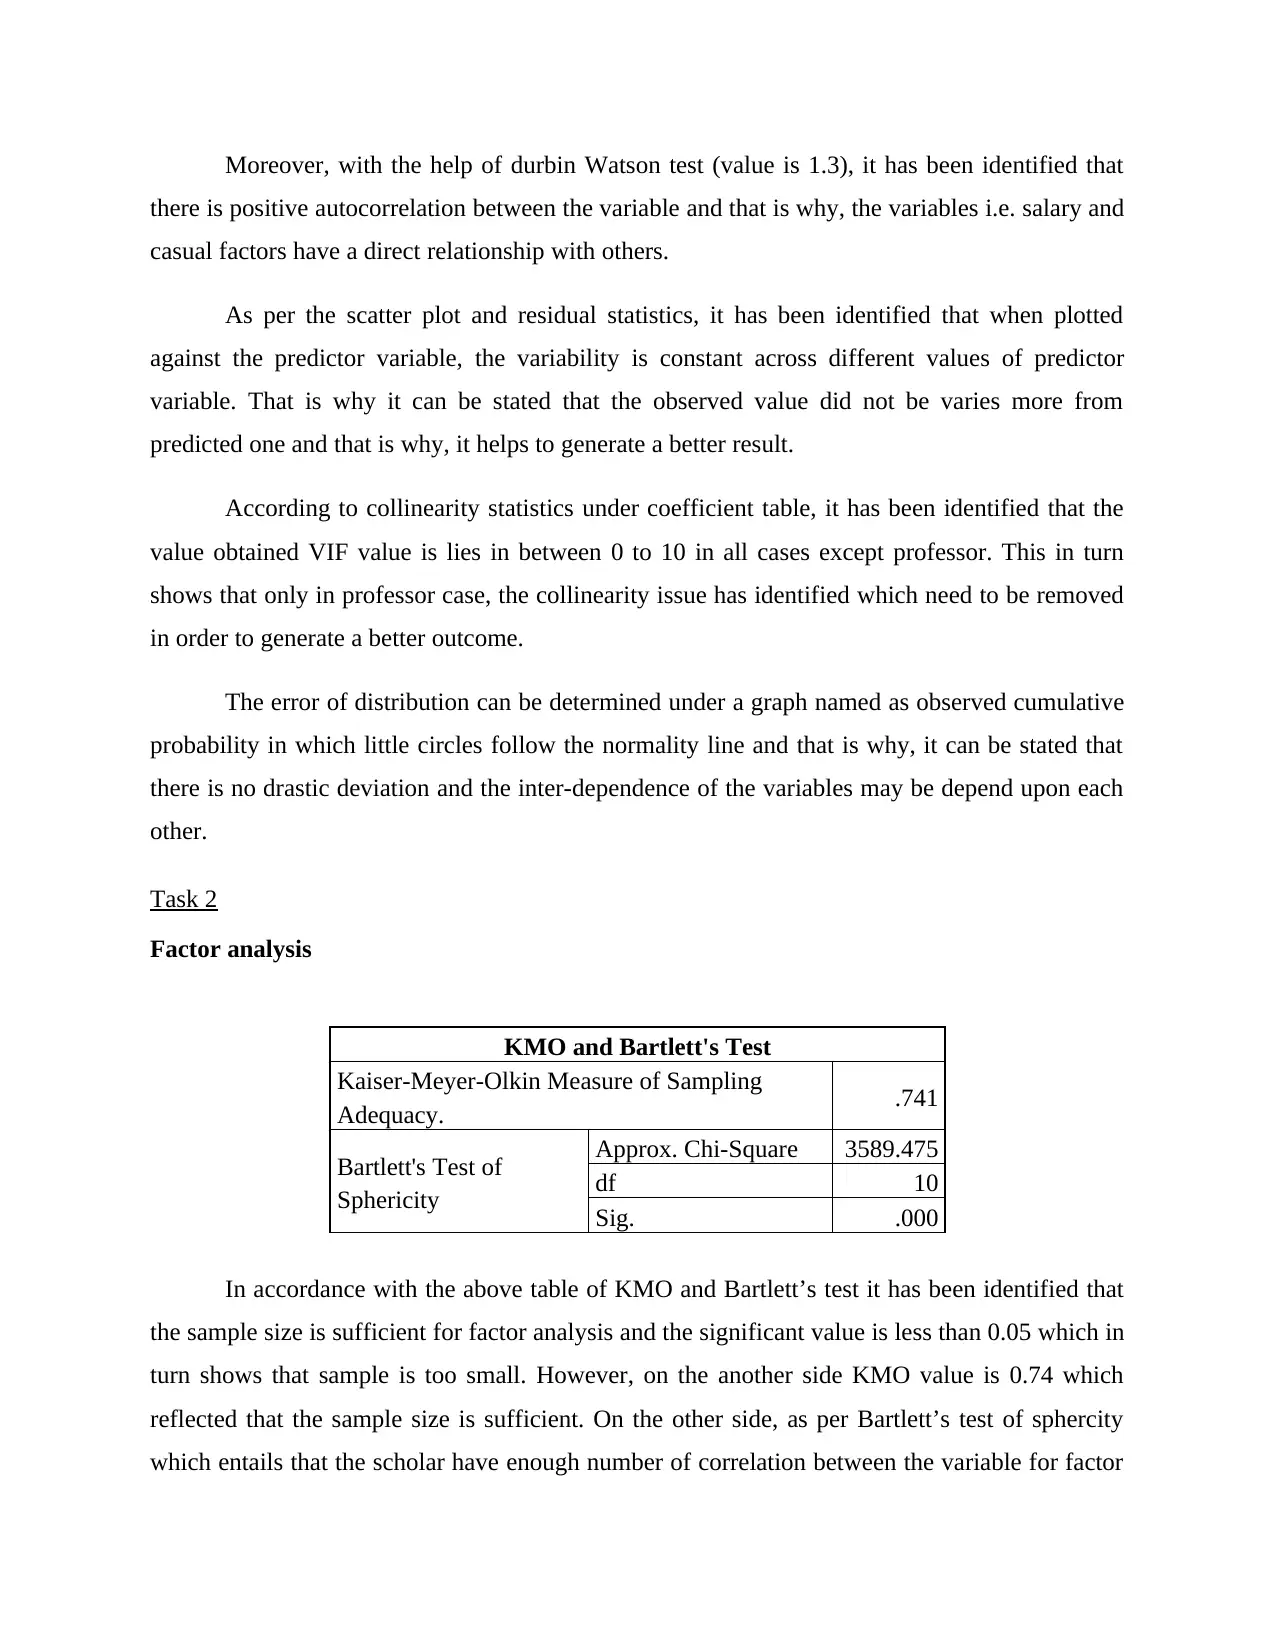
In accordance with the above table of KMO and Bartlett’s test it has been identified that
the sample size is sufficient for factor analysis and the significant value is less than 0.05 which in
turn shows that sample is too small. However, on the another side KMO value is 0.74 which
reflected that the sample size is sufficient. On the other side, as per Bartlett’s test of sphercity
which entails that the scholar have enough number of correlation between the variable for factor
there is positive autocorrelation between the variable and that is why, the variables i.e. salary and
casual factors have a direct relationship with others.
As per the scatter plot and residual statistics, it has been identified that when plotted
against the predictor variable, the variability is constant across different values of predictor
variable. That is why it can be stated that the observed value did not be varies more from
predicted one and that is why, it helps to generate a better result.
According to collinearity statistics under coefficient table, it has been identified that the
value obtained VIF value is lies in between 0 to 10 in all cases except professor. This in turn
shows that only in professor case, the collinearity issue has identified which need to be removed
in order to generate a better outcome.
The error of distribution can be determined under a graph named as observed cumulative
probability in which little circles follow the normality line and that is why, it can be stated that
there is no drastic deviation and the inter-dependence of the variables may be depend upon each
other.
Task 2
Factor analysis
KMO and Bartlett's Test
Kaiser-Meyer-Olkin Measure of Sampling
Adequacy. .741
Bartlett's Test of
Sphericity
Approx. Chi-Square 3589.475
df 10
Sig. .000
In accordance with the above table of KMO and Bartlett’s test it has been identified that
the sample size is sufficient for factor analysis and the significant value is less than 0.05 which in
turn shows that sample is too small. However, on the another side KMO value is 0.74 which
reflected that the sample size is sufficient. On the other side, as per Bartlett’s test of sphercity
which entails that the scholar have enough number of correlation between the variable for factor
analysis because the value of less than the standard criteria. Hence, it can be reflected that the
variables have enough correlation between the variables in order to analyse the data effectively.
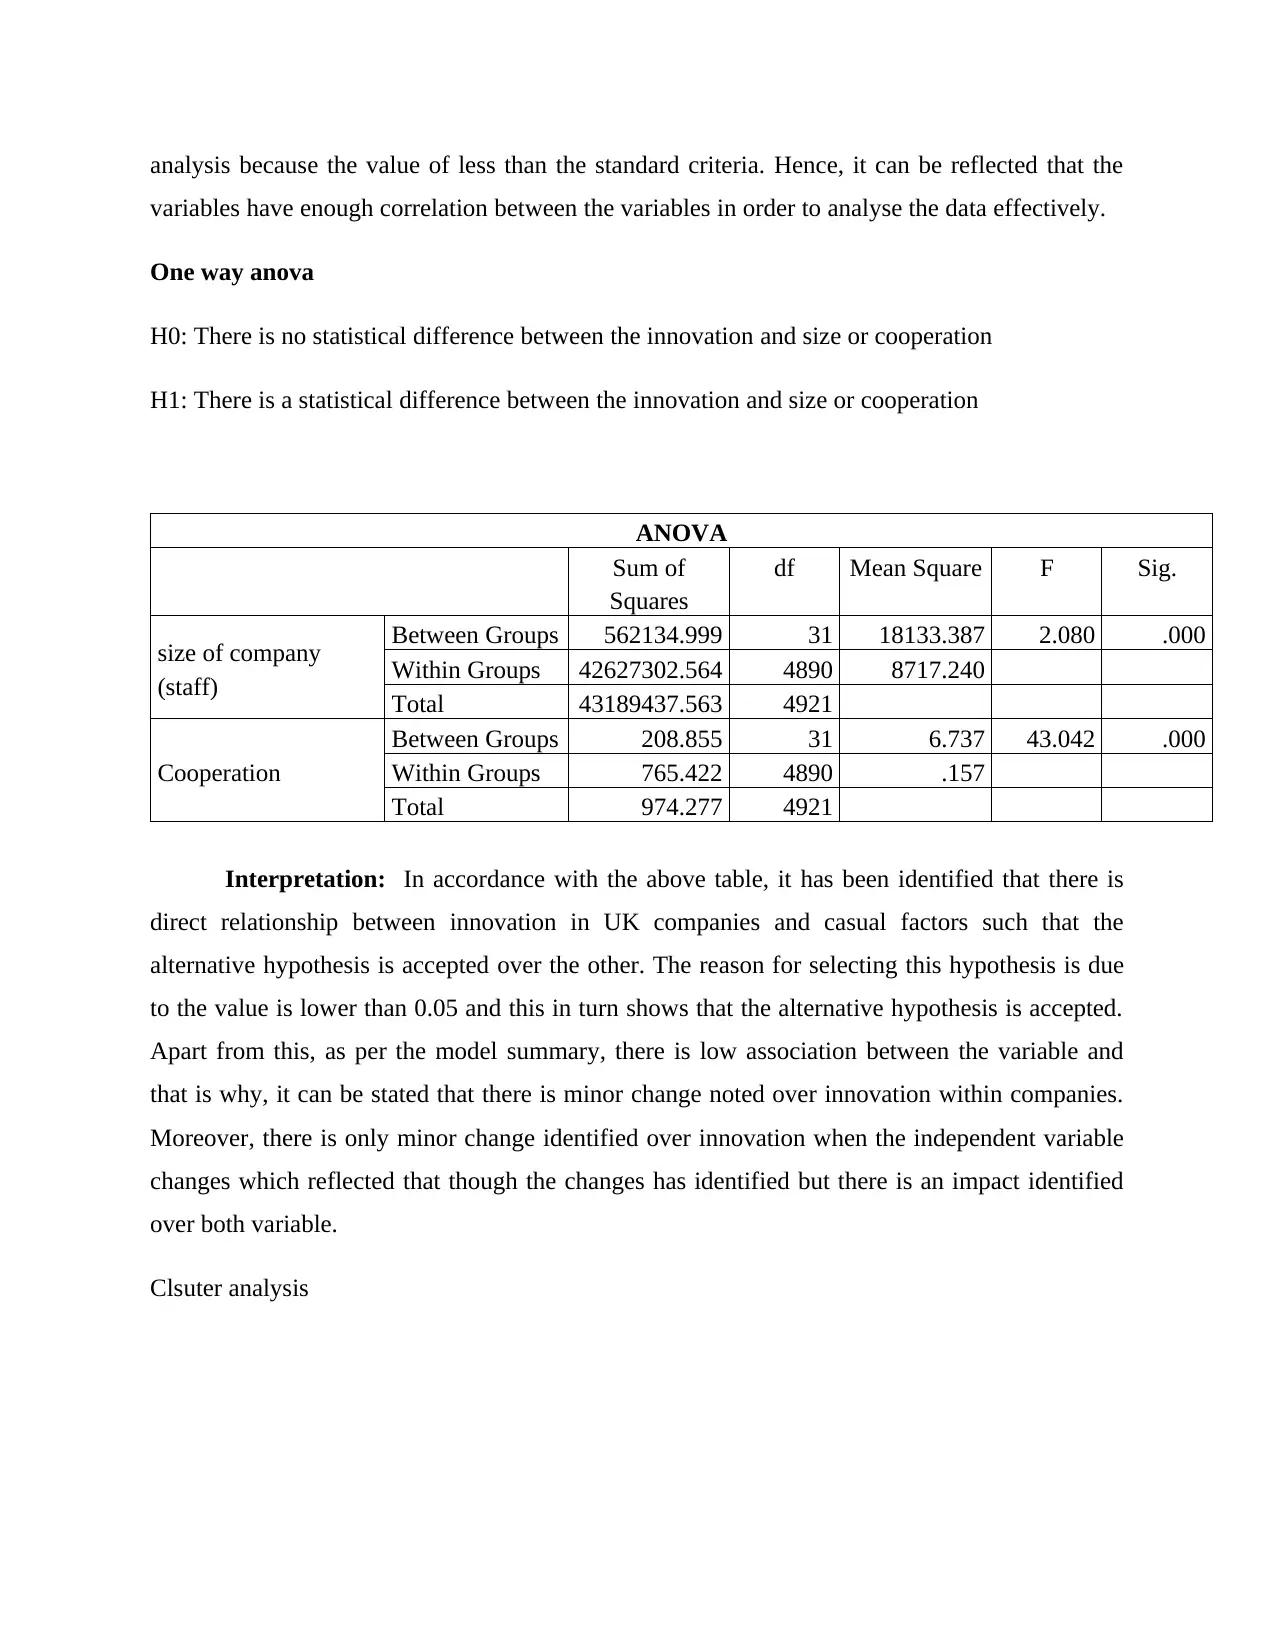
One way anova
H0: There is no statistical difference between the innovation and size or cooperation
H1: There is a statistical difference between the innovation and size or cooperation
ANOVA
Sum of
Squares
df Mean Square F Sig.
size of company
(staff)
Between Groups 562134.999 31 18133.387 2.080 .000
Within Groups 42627302.564 4890 8717.240
Total 43189437.563 4921
Cooperation
Between Groups 208.855 31 6.737 43.042 .000
Within Groups 765.422 4890 .157
Total 974.277 4921
Interpretation: In accordance with the above table, it has been identified that there is
direct relationship between innovation in UK companies and casual factors such that the
alternative hypothesis is accepted over the other. The reason for selecting this hypothesis is due
to the value is lower than 0.05 and this in turn shows that the alternative hypothesis is accepted.
Apart from this, as per the model summary, there is low association between the variable and
that is why, it can be stated that there is minor change noted over innovation within companies.
Moreover, there is only minor change identified over innovation when the independent variable
changes which reflected that though the changes has identified but there is an impact identified
over both variable.
Clsuter analysis
variables have enough correlation between the variables in order to analyse the data effectively.
One way anova
H0: There is no statistical difference between the innovation and size or cooperation
H1: There is a statistical difference between the innovation and size or cooperation
ANOVA
Sum of
Squares
df Mean Square F Sig.
size of company
(staff)
Between Groups 562134.999 31 18133.387 2.080 .000
Within Groups 42627302.564 4890 8717.240
Total 43189437.563 4921
Cooperation
Between Groups 208.855 31 6.737 43.042 .000
Within Groups 765.422 4890 .157
Total 974.277 4921
Interpretation: In accordance with the above table, it has been identified that there is
direct relationship between innovation in UK companies and casual factors such that the
alternative hypothesis is accepted over the other. The reason for selecting this hypothesis is due
to the value is lower than 0.05 and this in turn shows that the alternative hypothesis is accepted.
Apart from this, as per the model summary, there is low association between the variable and
that is why, it can be stated that there is minor change noted over innovation within companies.
Moreover, there is only minor change identified over innovation when the independent variable
changes which reflected that though the changes has identified but there is an impact identified
over both variable.
Clsuter analysis
⊘ This is a preview!⊘
Do you want full access?
Subscribe today to unlock all pages.
Trusted by 1+ million students worldwide
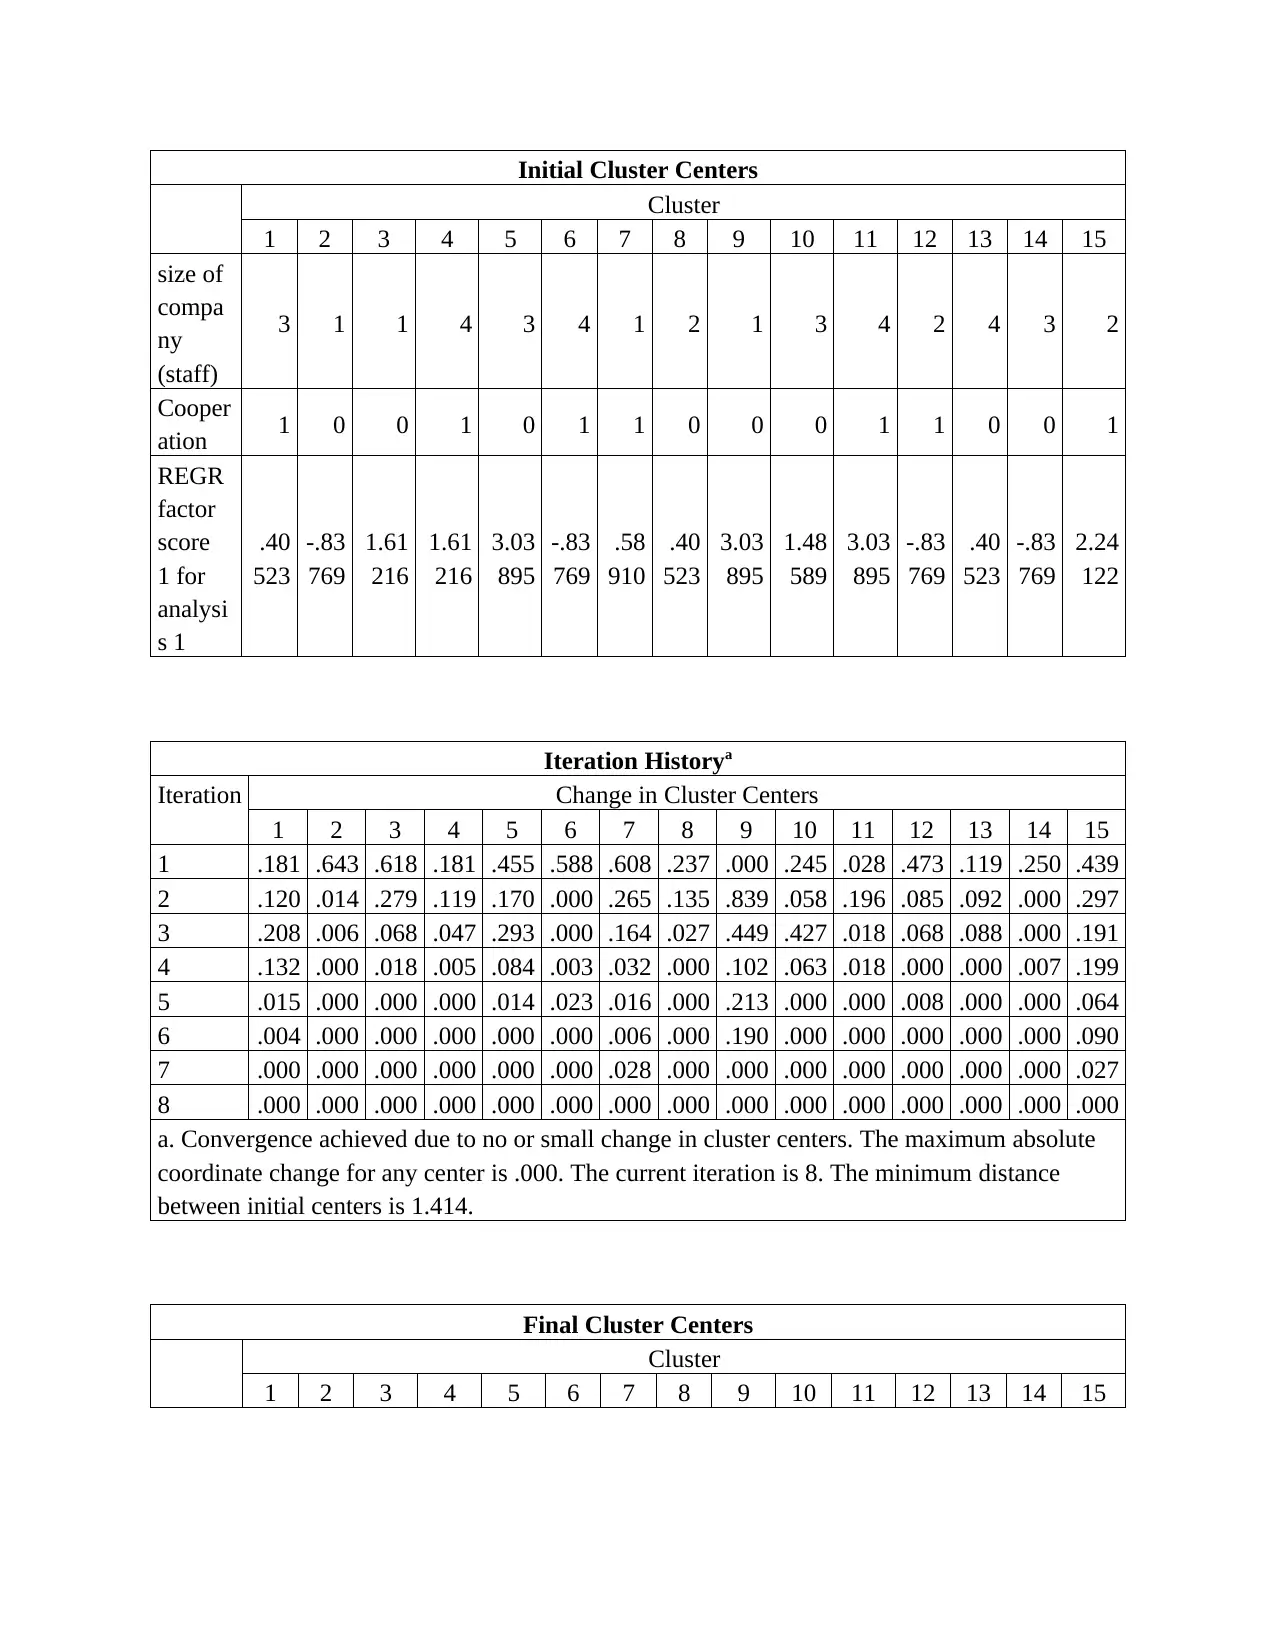
Initial Cluster Centers
Cluster
1 2 3 4 5 6 7 8 9 10 11 12 13 14 15
size of
compa
ny
(staff)
3 1 1 4 3 4 1 2 1 3 4 2 4 3 2
Cooper
ation 1 0 0 1 0 1 1 0 0 0 1 1 0 0 1
REGR
factor
score
1 for
analysi
s 1
.40
523
-.83
769
1.61
216
1.61
216
3.03
895
-.83
769
.58
910
.40
523
3.03
895
1.48
589
3.03
895
-.83
769
.40
523
-.83
769
2.24
122
Iteration Historya
Iteration Change in Cluster Centers
1 2 3 4 5 6 7 8 9 10 11 12 13 14 15
1 .181 .643 .618 .181 .455 .588 .608 .237 .000 .245 .028 .473 .119 .250 .439
2 .120 .014 .279 .119 .170 .000 .265 .135 .839 .058 .196 .085 .092 .000 .297
3 .208 .006 .068 .047 .293 .000 .164 .027 .449 .427 .018 .068 .088 .000 .191
4 .132 .000 .018 .005 .084 .003 .032 .000 .102 .063 .018 .000 .000 .007 .199
5 .015 .000 .000 .000 .014 .023 .016 .000 .213 .000 .000 .008 .000 .000 .064
6 .004 .000 .000 .000 .000 .000 .006 .000 .190 .000 .000 .000 .000 .000 .090
7 .000 .000 .000 .000 .000 .000 .028 .000 .000 .000 .000 .000 .000 .000 .027
8 .000 .000 .000 .000 .000 .000 .000 .000 .000 .000 .000 .000 .000 .000 .000
a. Convergence achieved due to no or small change in cluster centers. The maximum absolute
coordinate change for any center is .000. The current iteration is 8. The minimum distance
between initial centers is 1.414.
Final Cluster Centers
Cluster
1 2 3 4 5 6 7 8 9 10 11 12 13 14 15
Cluster
1 2 3 4 5 6 7 8 9 10 11 12 13 14 15
size of
compa
ny
(staff)
3 1 1 4 3 4 1 2 1 3 4 2 4 3 2
Cooper
ation 1 0 0 1 0 1 1 0 0 0 1 1 0 0 1
REGR
factor
score
1 for
analysi
s 1
.40
523
-.83
769
1.61
216
1.61
216
3.03
895
-.83
769
.58
910
.40
523
3.03
895
1.48
589
3.03
895
-.83
769
.40
523
-.83
769
2.24
122
Iteration Historya
Iteration Change in Cluster Centers
1 2 3 4 5 6 7 8 9 10 11 12 13 14 15
1 .181 .643 .618 .181 .455 .588 .608 .237 .000 .245 .028 .473 .119 .250 .439
2 .120 .014 .279 .119 .170 .000 .265 .135 .839 .058 .196 .085 .092 .000 .297
3 .208 .006 .068 .047 .293 .000 .164 .027 .449 .427 .018 .068 .088 .000 .191
4 .132 .000 .018 .005 .084 .003 .032 .000 .102 .063 .018 .000 .000 .007 .199
5 .015 .000 .000 .000 .014 .023 .016 .000 .213 .000 .000 .008 .000 .000 .064
6 .004 .000 .000 .000 .000 .000 .006 .000 .190 .000 .000 .000 .000 .000 .090
7 .000 .000 .000 .000 .000 .000 .028 .000 .000 .000 .000 .000 .000 .000 .027
8 .000 .000 .000 .000 .000 .000 .000 .000 .000 .000 .000 .000 .000 .000 .000
a. Convergence achieved due to no or small change in cluster centers. The maximum absolute
coordinate change for any center is .000. The current iteration is 8. The minimum distance
between initial centers is 1.414.
Final Cluster Centers
Cluster
1 2 3 4 5 6 7 8 9 10 11 12 13 14 15
Paraphrase This Document
Need a fresh take? Get an instant paraphrase of this document with our AI Paraphraser
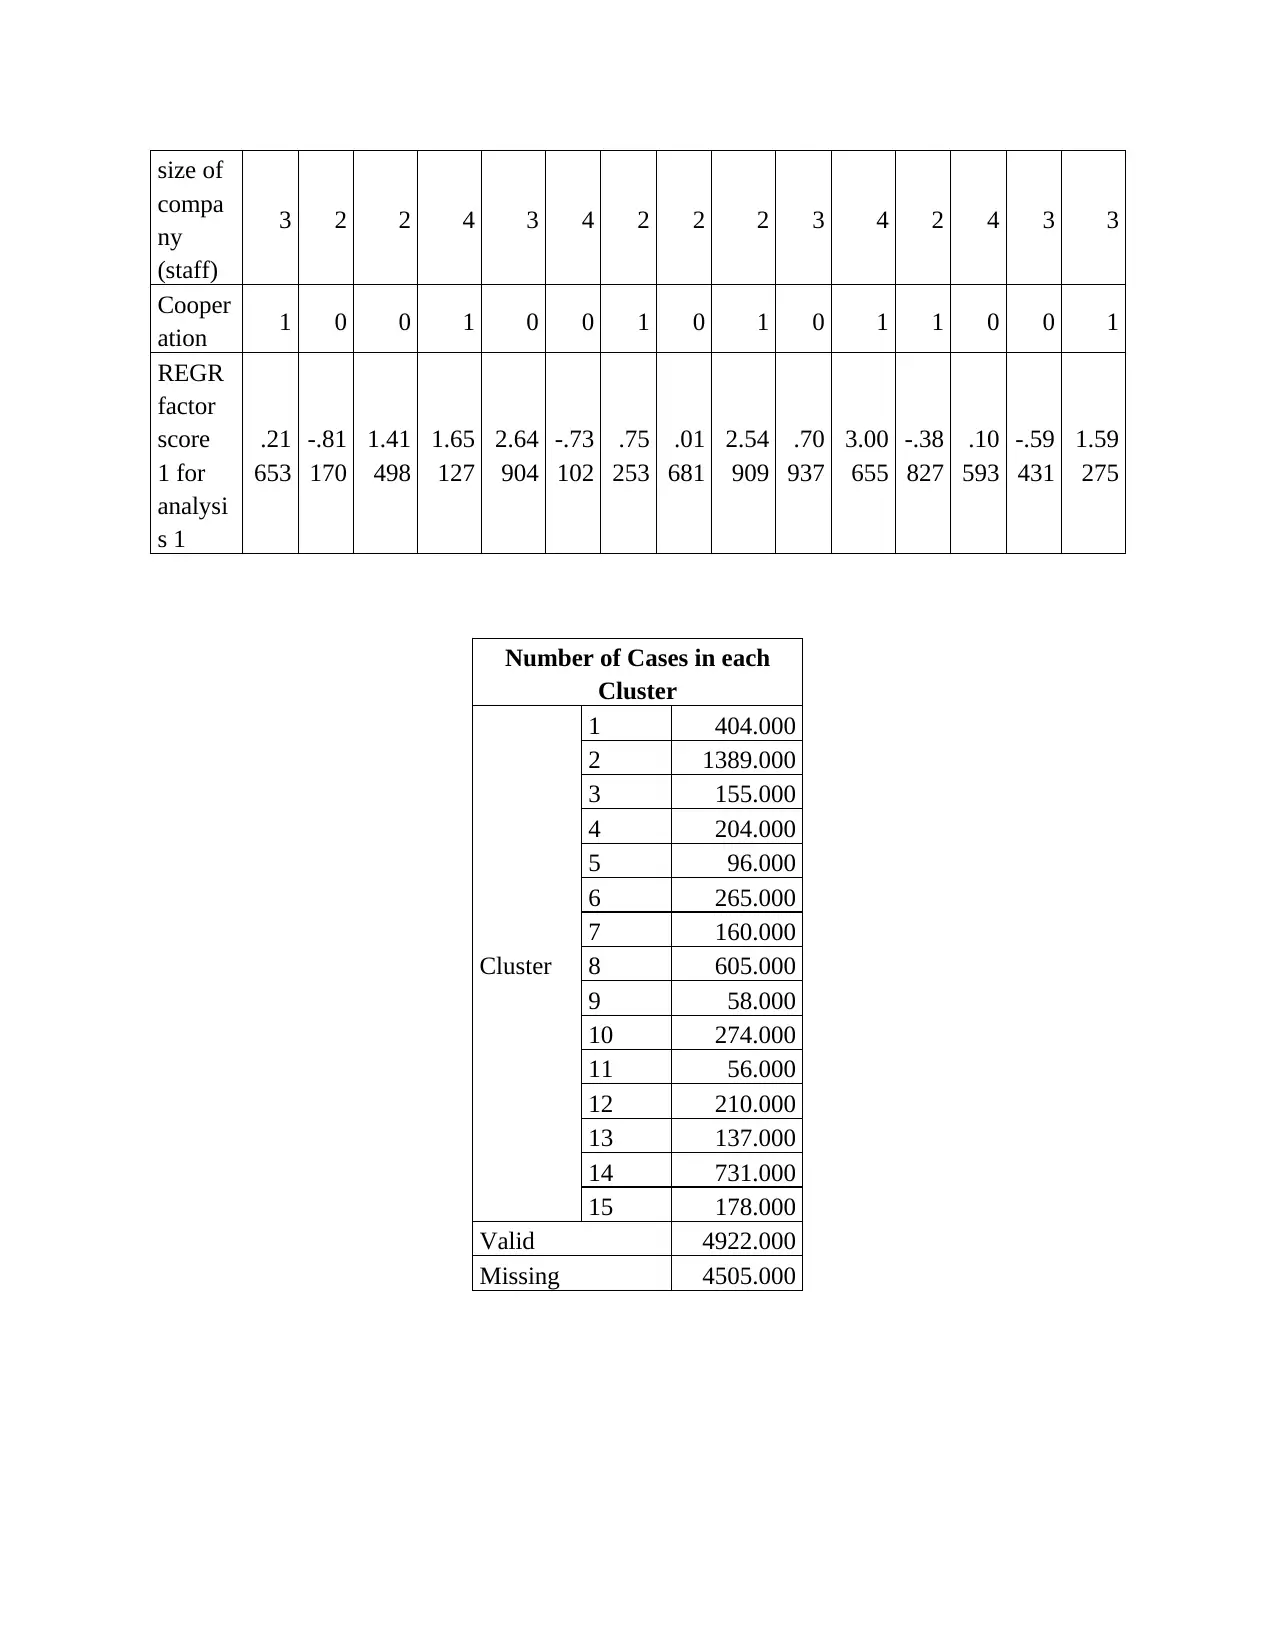
size of
compa
ny
(staff)
3 2 2 4 3 4 2 2 2 3 4 2 4 3 3
Cooper
ation 1 0 0 1 0 0 1 0 1 0 1 1 0 0 1
REGR
factor
score
1 for
analysi
s 1
.21
653
-.81
170
1.41
498
1.65
127
2.64
904
-.73
102
.75
253
.01
681
2.54
909
.70
937
3.00
655
-.38
827
.10
593
-.59
431
1.59
275
Number of Cases in each
Cluster
Cluster
1 404.000
2 1389.000
3 155.000
4 204.000
5 96.000
6 265.000
7 160.000
8 605.000
9 58.000
10 274.000
11 56.000
12 210.000
13 137.000
14 731.000
15 178.000
Valid 4922.000
Missing 4505.000
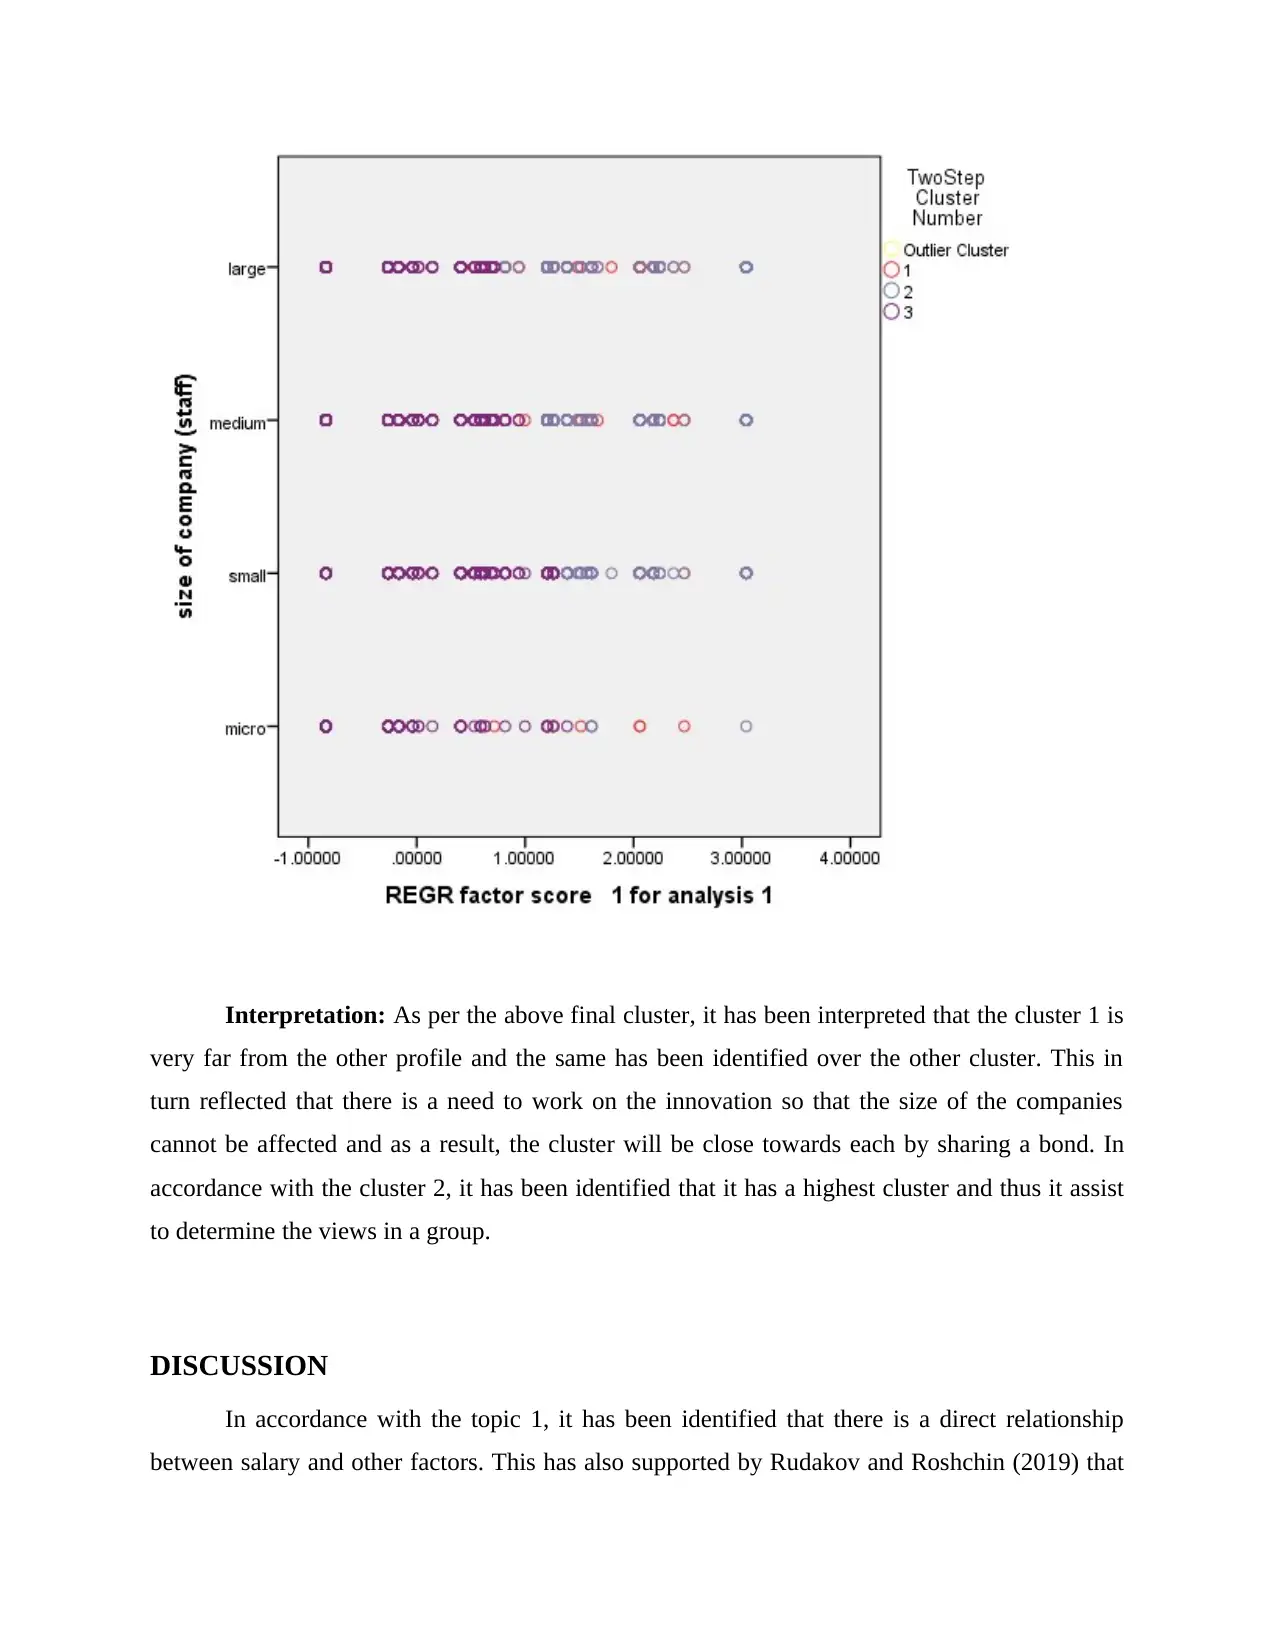
Interpretation: As per the above final cluster, it has been interpreted that the cluster 1 is
very far from the other profile and the same has been identified over the other cluster. This in
turn reflected that there is a need to work on the innovation so that the size of the companies
cannot be affected and as a result, the cluster will be close towards each by sharing a bond. In
accordance with the cluster 2, it has been identified that it has a highest cluster and thus it assist
to determine the views in a group.
DISCUSSION
In accordance with the topic 1, it has been identified that there is a direct relationship
between salary and other factors. This has also supported by Rudakov and Roshchin (2019) that
⊘ This is a preview!⊘
Do you want full access?
Subscribe today to unlock all pages.
Trusted by 1+ million students worldwide
1 out of 15
Related Documents


Your All-in-One AI-Powered Toolkit for Academic Success.
+13062052269
info@desklib.com
Available 24*7 on WhatsApp / Email
![[object Object]](/_next/static/media/star-bottom.7253800d.svg)
Unlock your academic potential
Copyright © 2020–2026 A2Z Services. All Rights Reserved. Developed and managed by ZUCOL.