BEA683 - Economic Perspectives on Business & Demand Elasticity
VerifiedAdded on 2023/06/12
|13
|3150
|100
Homework Assignment
AI Summary
This assignment delves into various economic concepts and their application in business environments. It begins by examining factors influencing consumer demand, such as changes in tastes, preferences, and population shifts, emphasizing the importance of market research for effective marketing strategies. The assignment then analyzes the Australian taxi industry as an oligopoly, discussing the impact of ride-sharing apps like Uber on market competition and pricing strategies. It explores the kinked demand curve and the challenges of achieving profitability in the ride-hailing industry. Finally, the assignment addresses cross-price elasticity of demand, using the example of natural gas and coal to illustrate the relationship between substitute goods and providing a formula for calculating cross-price elasticity.
Contents
Question 1: You Are What you Buy................................................................................................1
QUESTION 2: The economic Perspective of a Business Case.......................................................2
Question3 Cross Price Elasticity of Demand...................................................................................8
Bibliography..................................................................................................................................10
Paraphrase This Document
Need a fresh take? Get an instant paraphrase of this document with our AI Paraphraser
Question 1: You Are What you Buy
a) Factors determining the demand
Changes in Tastes and Preferences of consumers
As baby boomers ages, their tastes and preferences change. Goods that would be required earlier
may not be required so. For example, as baby boomers age, their intake for alcohol many change
and they ay not consumer alcohol in quantities that they would have consumed previously. This
could affect every area of the market. (Mankiw 2008) A change in tastes and consumers can
work both ways. If the change in tastes and consumer reduces the demand for a brand or a
product, then the demand curve would shift towards the left.
Population Shift
As the composition of the population changes, the demand for goods and services will change
too. Thus, the demand in this case, has shifted due to a shift in population. The demand could be
a shift in the use of brands or in the products demanded themselves. For example, in Japan, adult
diapers sell in greater quantities than baby diapers. (Pasick 2013) This boom in adult diapers has
been brought about by a rapidly ageing population. This could be a reality in Australia too.
Another example of demand being determined by population is the preferred size of daily
products. It is possible that baby boomer were previously daily items in bulk because they lived
with their families. However, as baby boomers age and their children no longer live with them,
there would be a shift in the size of the products that they would buy.
a) Approaches to marketing
Out of the given approaches, I would go with the approach set by Nick Goddard and follow up
with the research on Baby Boomers. This research could be original research conducted by the
Company or the research that is already available. If the research is brand specific, then market
research will have to be conducted. If a general idea of the tastes, preferences and demographics
regarding consumers is required, then already available research would come in handy.
This is simply because, the research will not only provide a direction but also, an idea of the
underlying causes behind the purchases of consumers. This may help account for cultural
differences, age differences, gender related differences and more. (Salai and Kovač 2011)
Every human is subject to inherent biases and is subject to their perceptions of the daily
phenomenon. These biases can be responsible for taking wrong decisions, when decisions are
taken without any research. (Hochma 2013) Marketing costs are generally very high, hence,
targeted marketing improves the efficiency of capital put in for the purpose of marketing.
In the absence of research, marketing would be done on a trial and error basis. This would
increase the costs for the firm as well as increase the chances of severe consequences such as the
Company losing market share or more. Hence, the preferable approach to marketing would be to
conduct market research or make use of the available market research. (Zenger 2015)
⊘ This is a preview!⊘
Do you want full access?
Subscribe today to unlock all pages.
Trusted by 1+ million students worldwide
QUESTION 2: The economic Perspective of a Business Case
Article Source: (Redrup 2018) The Australian Financial Review
Taxify claims flying start in Aussie Uber battle
He said Taxify had a long-term goal of being a minimum of 5 per cent cheaper for users than Uber.
Taxify was founded in 2013 by Estonian teenager Markus Villig, who saw a gap in the market to
introduce competition in markets where there was a ride-sharing monopoly and give drivers a higher
commission.
Globally the business has 5 million riders in 20 countries and is the leading player in a range of European
and African countries. Taxify will turn its attention to Brisbane next, where it hopes to launch in the next
four to six weeks. Meanwhile Indian Uber competitor Ola started operating in Melbourne last Thursday, a
month after its launch in Sydney.
The Softbank and Tencent-backed company claims to have doubled its drivers from 7000 to 15,000 over
the last months, putting it just behind Taxify in terms of its share of the driver market.
Crowded market
Like Taxify, it also enters new geographies by offering aggressive discounts to get customers to sign up.
Mr Raciti said he believed there was space in the Australian market for three players in the short-term.
"From what we've learned in other markets, with a market the size of Australia there is room for three players
to operate and be healthy for the next two to three years, but looking at five years is a long time in start-up
land," he said.
Ms McEncroe said the added competition would also ensure the sector was more accountable to its drivers
and riders.
"As we provide ride-sharing services to women and children, we're going after a completely different market
to other ride shares and wouldn't classify them as our competitors. Our services go beyond ride sharing by
offering an income revenue to support women as well as a safe mode of transport."
Shebah now has 890 drivers nationally and it has completed 25,000 trips since March last year.
Australian operator GoCatch also operates in the space, but has decided to target corporate clients as its main
strategy.
Despite a tumultuous few years, GoCatch is attempting to drum up support for an IPO this year.
Paraphrase This Document
Need a fresh take? Get an instant paraphrase of this document with our AI Paraphraser
i) The taxi industry in Australia can been described as an oligopolistic industry. This is
because it is a highly regulated industry with high entry barriers. There are just two
product offerings: Silvertop Taxis and 13 cabs and while there may be any number of
taxi drivers, the supply is limited by these two companies. A taxi driver in Australia
must get a license and follow various regulations for the safety of passengers and
drivers. This acted as a barrier to entry to the individuals with no financial support.
(Moore 2017)
The rise of ride sharing apps has changed this structure and made it more competitive by creating
a differentiated product. Consumers who may need a taxi can order a ride via the app and the
driver that is the closest to them will service the customer. In addition to this non-price form of
competition, cab hailing apps like Uber have also indulged in price competition to gain share of
the share. (The Wharton School, University of Pennsylvania 2017)
A market wherein there are more than two producers or sellers but not many, is known an
Oligopoly. An Oligopolistic structure, generally, arises when there are too many barriers to entry
in an industry. These barriers could include a variety of factors such as high costs of startup,
government regulations, geographical restrictions etc. (Mankiw 2008)
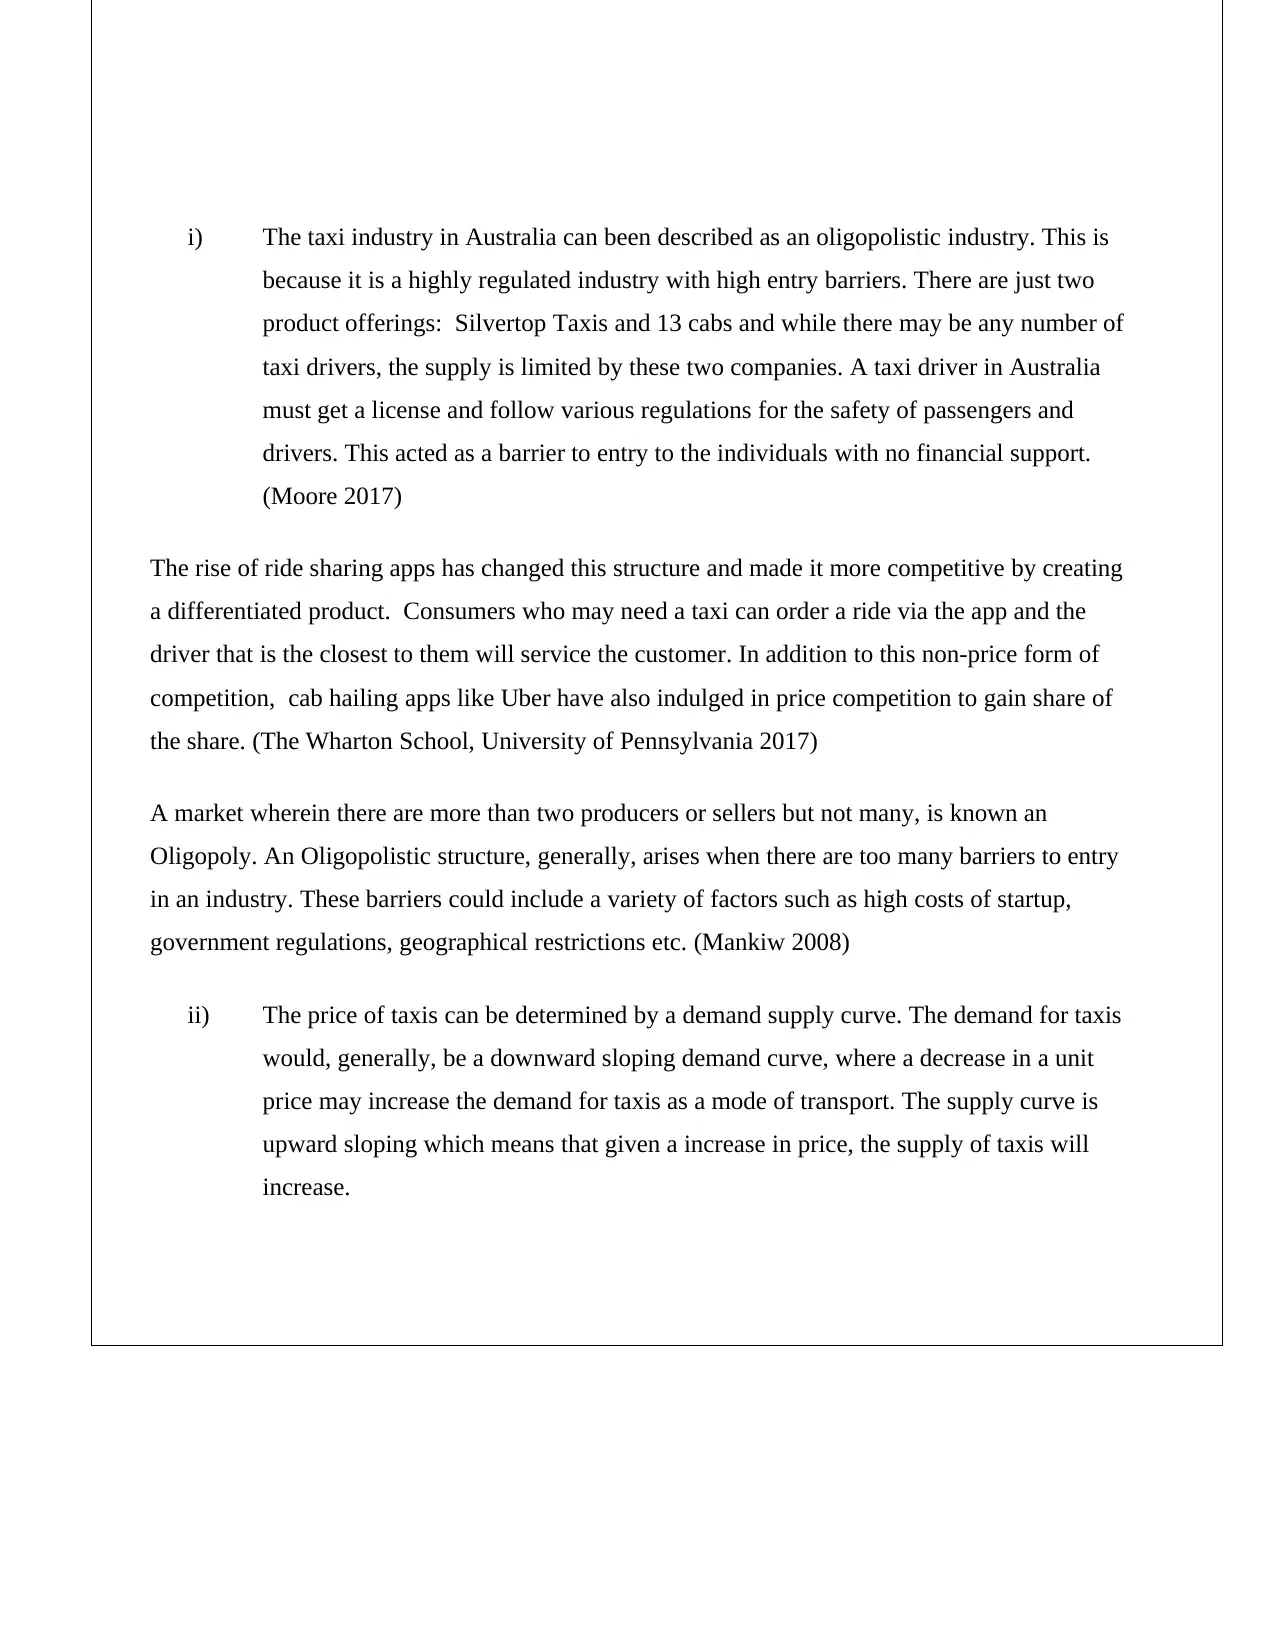
ii) The price of taxis can be determined by a demand supply curve. The demand for taxis
would, generally, be a downward sloping demand curve, where a decrease in a unit
price may increase the demand for taxis as a mode of transport. The supply curve is
upward sloping which means that given a increase in price, the supply of taxis will
increase.
because it is a highly regulated industry with high entry barriers. There are just two
product offerings: Silvertop Taxis and 13 cabs and while there may be any number of
taxi drivers, the supply is limited by these two companies. A taxi driver in Australia
must get a license and follow various regulations for the safety of passengers and
drivers. This acted as a barrier to entry to the individuals with no financial support.
(Moore 2017)
The rise of ride sharing apps has changed this structure and made it more competitive by creating
a differentiated product. Consumers who may need a taxi can order a ride via the app and the
driver that is the closest to them will service the customer. In addition to this non-price form of
competition, cab hailing apps like Uber have also indulged in price competition to gain share of
the share. (The Wharton School, University of Pennsylvania 2017)
A market wherein there are more than two producers or sellers but not many, is known an
Oligopoly. An Oligopolistic structure, generally, arises when there are too many barriers to entry
in an industry. These barriers could include a variety of factors such as high costs of startup,
government regulations, geographical restrictions etc. (Mankiw 2008)
ii) The price of taxis can be determined by a demand supply curve. The demand for taxis
would, generally, be a downward sloping demand curve, where a decrease in a unit
price may increase the demand for taxis as a mode of transport. The supply curve is
upward sloping which means that given a increase in price, the supply of taxis will
increase.
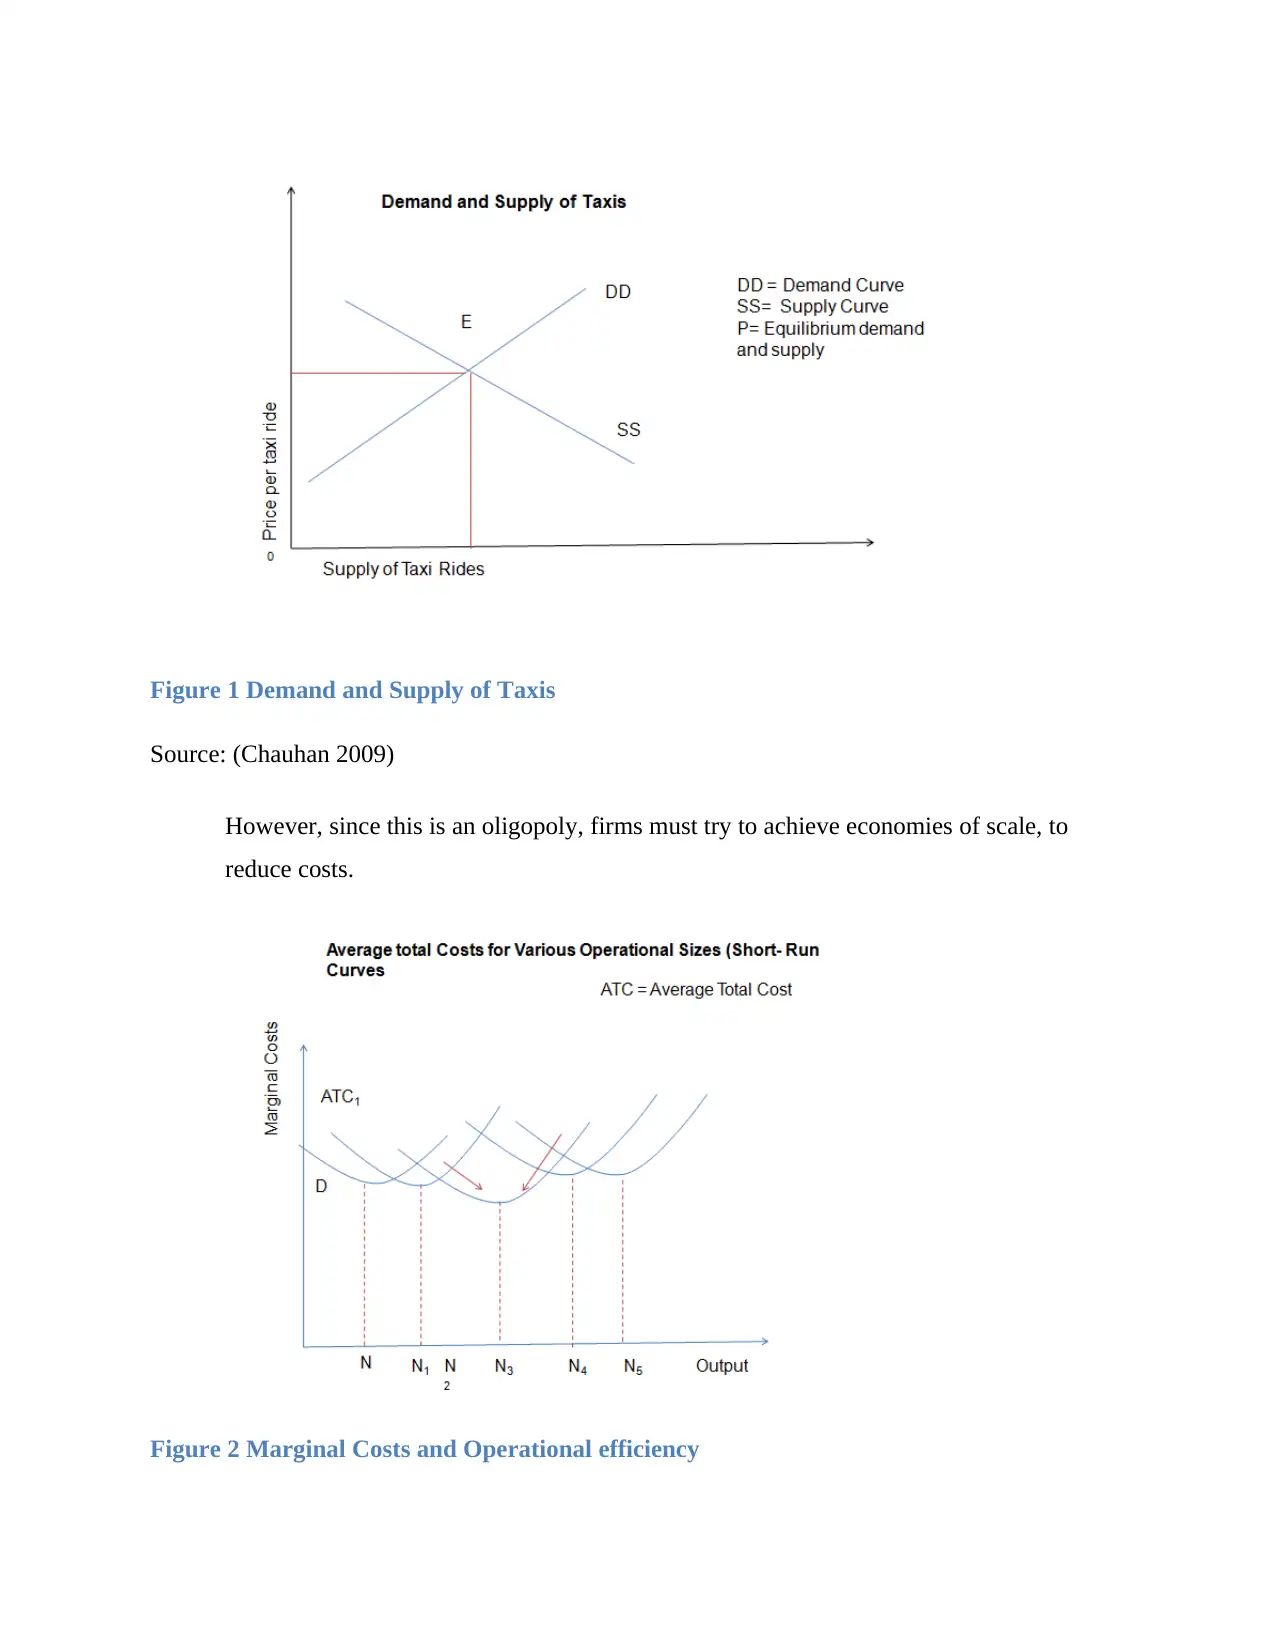
Figure 1 Demand and Supply of Taxis
Source: (Chauhan 2009)
However, since this is an oligopoly, firms must try to achieve economies of scale, to
reduce costs.
Figure 2 Marginal Costs and Operational efficiency
Source: (Chauhan 2009)
However, since this is an oligopoly, firms must try to achieve economies of scale, to
reduce costs.
Figure 2 Marginal Costs and Operational efficiency
⊘ This is a preview!⊘
Do you want full access?
Subscribe today to unlock all pages.
Trusted by 1+ million students worldwide
Source: (Chauhan 2009)
In the given diagram, it is depicted that firms with larger operations size, tend to have
lower marginal cost floors. The marginal cost reduces as the output increases, up to a
point and starts to increase again, once complete operational efficiency is achieved.
However, these economies are difficult to achieve since the oligopolistic market is noe
saturated.
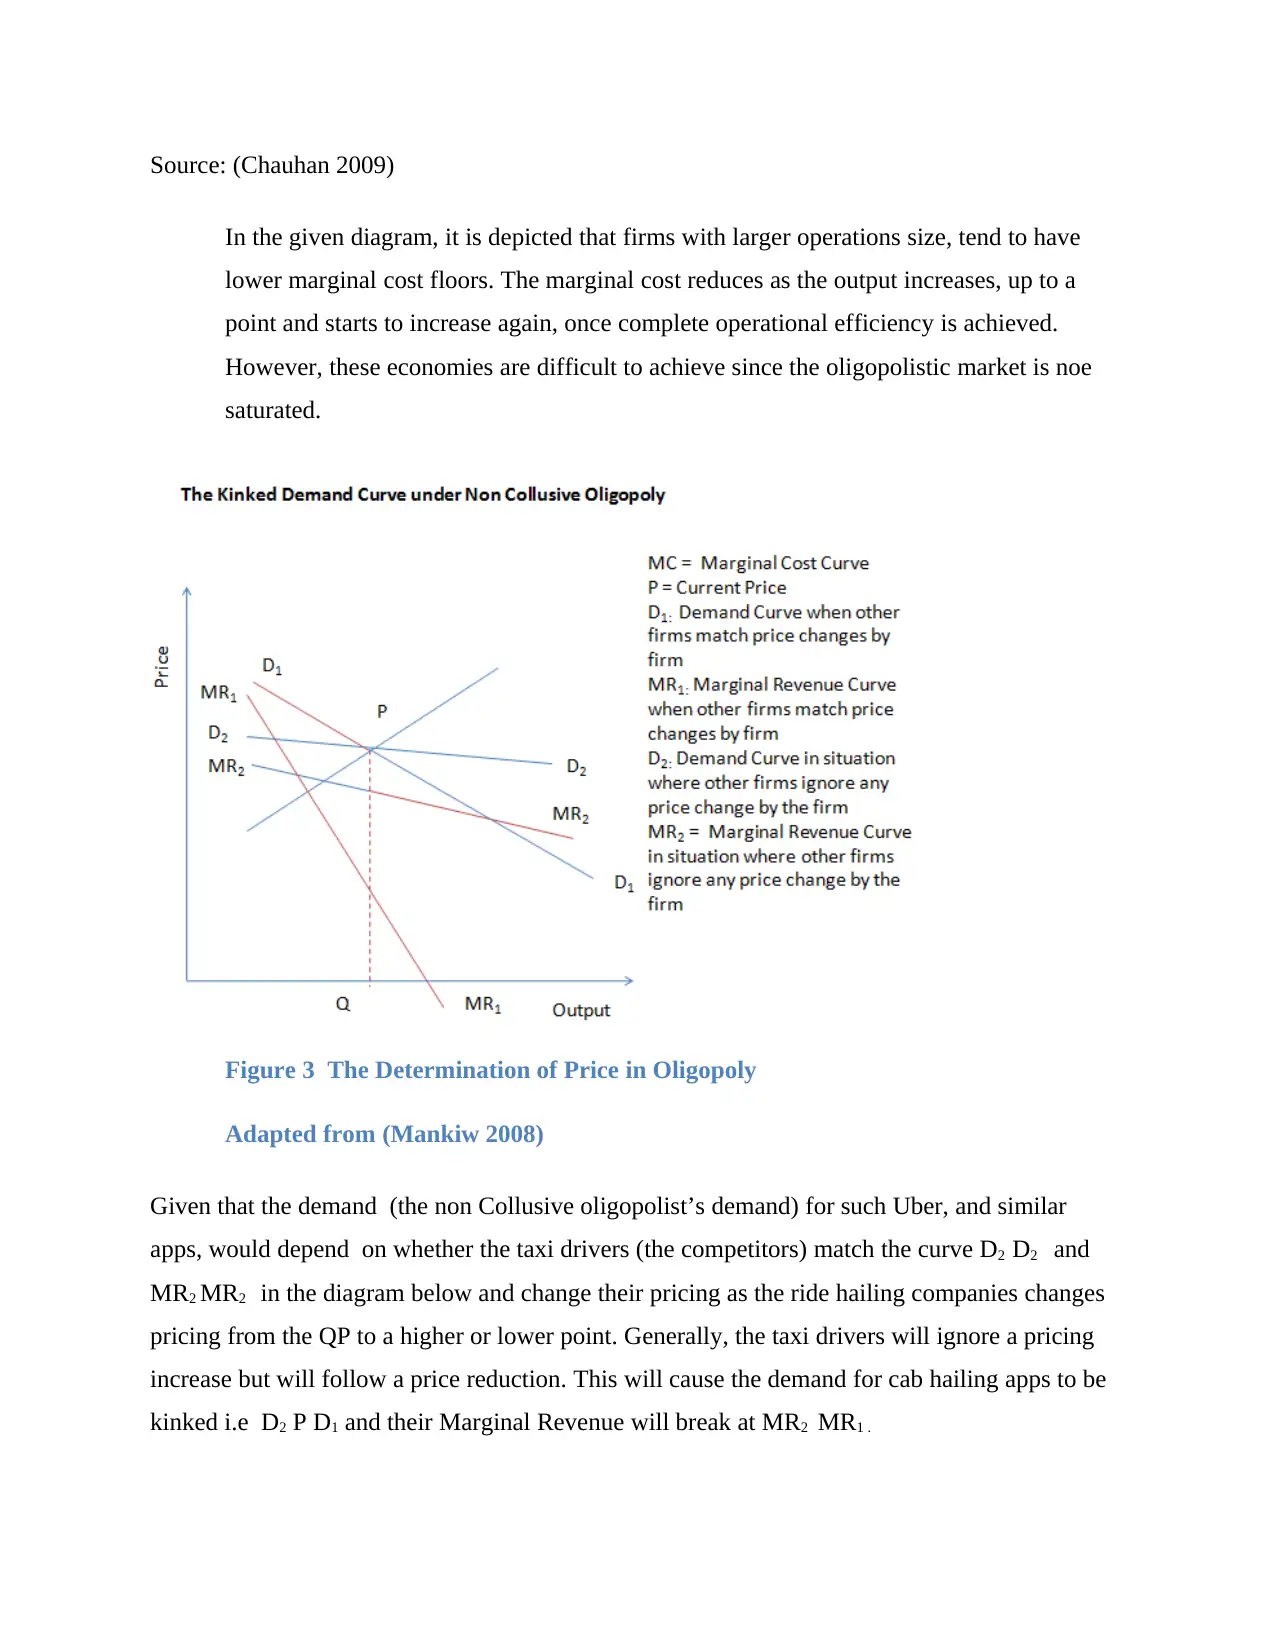
Figure 3 The Determination of Price in Oligopoly
Adapted from (Mankiw 2008)
Given that the demand (the non Collusive oligopolist’s demand) for such Uber, and similar
apps, would depend on whether the taxi drivers (the competitors) match the curve D2 D2 and
MR2 MR2 in the diagram below and change their pricing as the ride hailing companies changes
pricing from the QP to a higher or lower point. Generally, the taxi drivers will ignore a pricing
increase but will follow a price reduction. This will cause the demand for cab hailing apps to be
kinked i.e D2 P D1 and their Marginal Revenue will break at MR2 MR1 .
In the given diagram, it is depicted that firms with larger operations size, tend to have
lower marginal cost floors. The marginal cost reduces as the output increases, up to a
point and starts to increase again, once complete operational efficiency is achieved.
However, these economies are difficult to achieve since the oligopolistic market is noe
saturated.
Figure 3 The Determination of Price in Oligopoly
Adapted from (Mankiw 2008)
Given that the demand (the non Collusive oligopolist’s demand) for such Uber, and similar
apps, would depend on whether the taxi drivers (the competitors) match the curve D2 D2 and
MR2 MR2 in the diagram below and change their pricing as the ride hailing companies changes
pricing from the QP to a higher or lower point. Generally, the taxi drivers will ignore a pricing
increase but will follow a price reduction. This will cause the demand for cab hailing apps to be
kinked i.e D2 P D1 and their Marginal Revenue will break at MR2 MR1 .
Paraphrase This Document
Need a fresh take? Get an instant paraphrase of this document with our AI Paraphraser
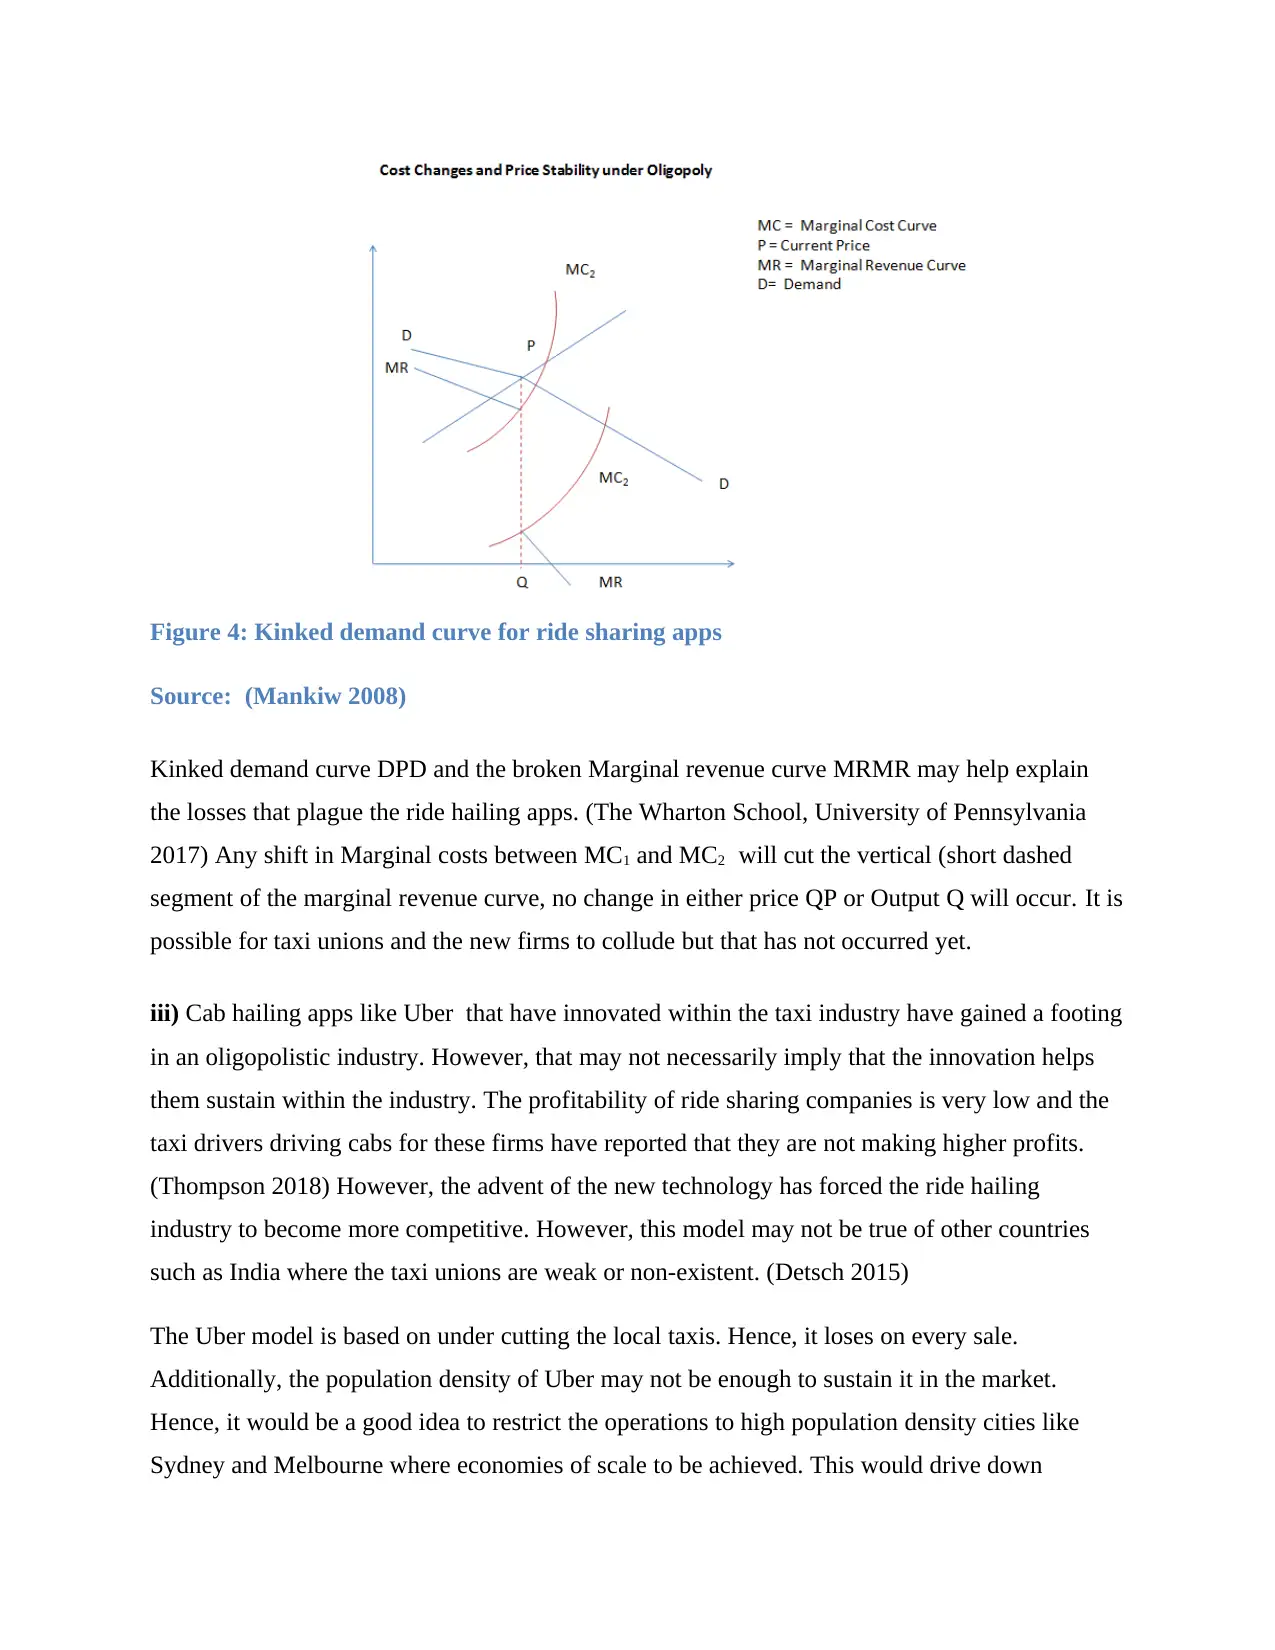
Figure 4: Kinked demand curve for ride sharing apps
Source: (Mankiw 2008)
Kinked demand curve DPD and the broken Marginal revenue curve MRMR may help explain
the losses that plague the ride hailing apps. (The Wharton School, University of Pennsylvania
2017) Any shift in Marginal costs between MC1 and MC2 will cut the vertical (short dashed
segment of the marginal revenue curve, no change in either price QP or Output Q will occur. It is
possible for taxi unions and the new firms to collude but that has not occurred yet.
iii) Cab hailing apps like Uber that have innovated within the taxi industry have gained a footing
in an oligopolistic industry. However, that may not necessarily imply that the innovation helps
them sustain within the industry. The profitability of ride sharing companies is very low and the
taxi drivers driving cabs for these firms have reported that they are not making higher profits.
(Thompson 2018) However, the advent of the new technology has forced the ride hailing
industry to become more competitive. However, this model may not be true of other countries
such as India where the taxi unions are weak or non-existent. (Detsch 2015)
The Uber model is based on under cutting the local taxis. Hence, it loses on every sale.
Additionally, the population density of Uber may not be enough to sustain it in the market.
Hence, it would be a good idea to restrict the operations to high population density cities like
Sydney and Melbourne where economies of scale to be achieved. This would drive down
marginal costs and help achieve operational efficiency. The total volume of losses may decrease
with this strategy and profitability will be achieved sooner, while other competitors would lose
money.
Additionally, Uber can seek to improve its value predictability by allowing reservations much
ahead of time and by allowing consumer to choose drivers. This will help build customer loyalty.
(Vertes 2015) (Hegde 2014)
⊘ This is a preview!⊘
Do you want full access?
Subscribe today to unlock all pages.
Trusted by 1+ million students worldwide
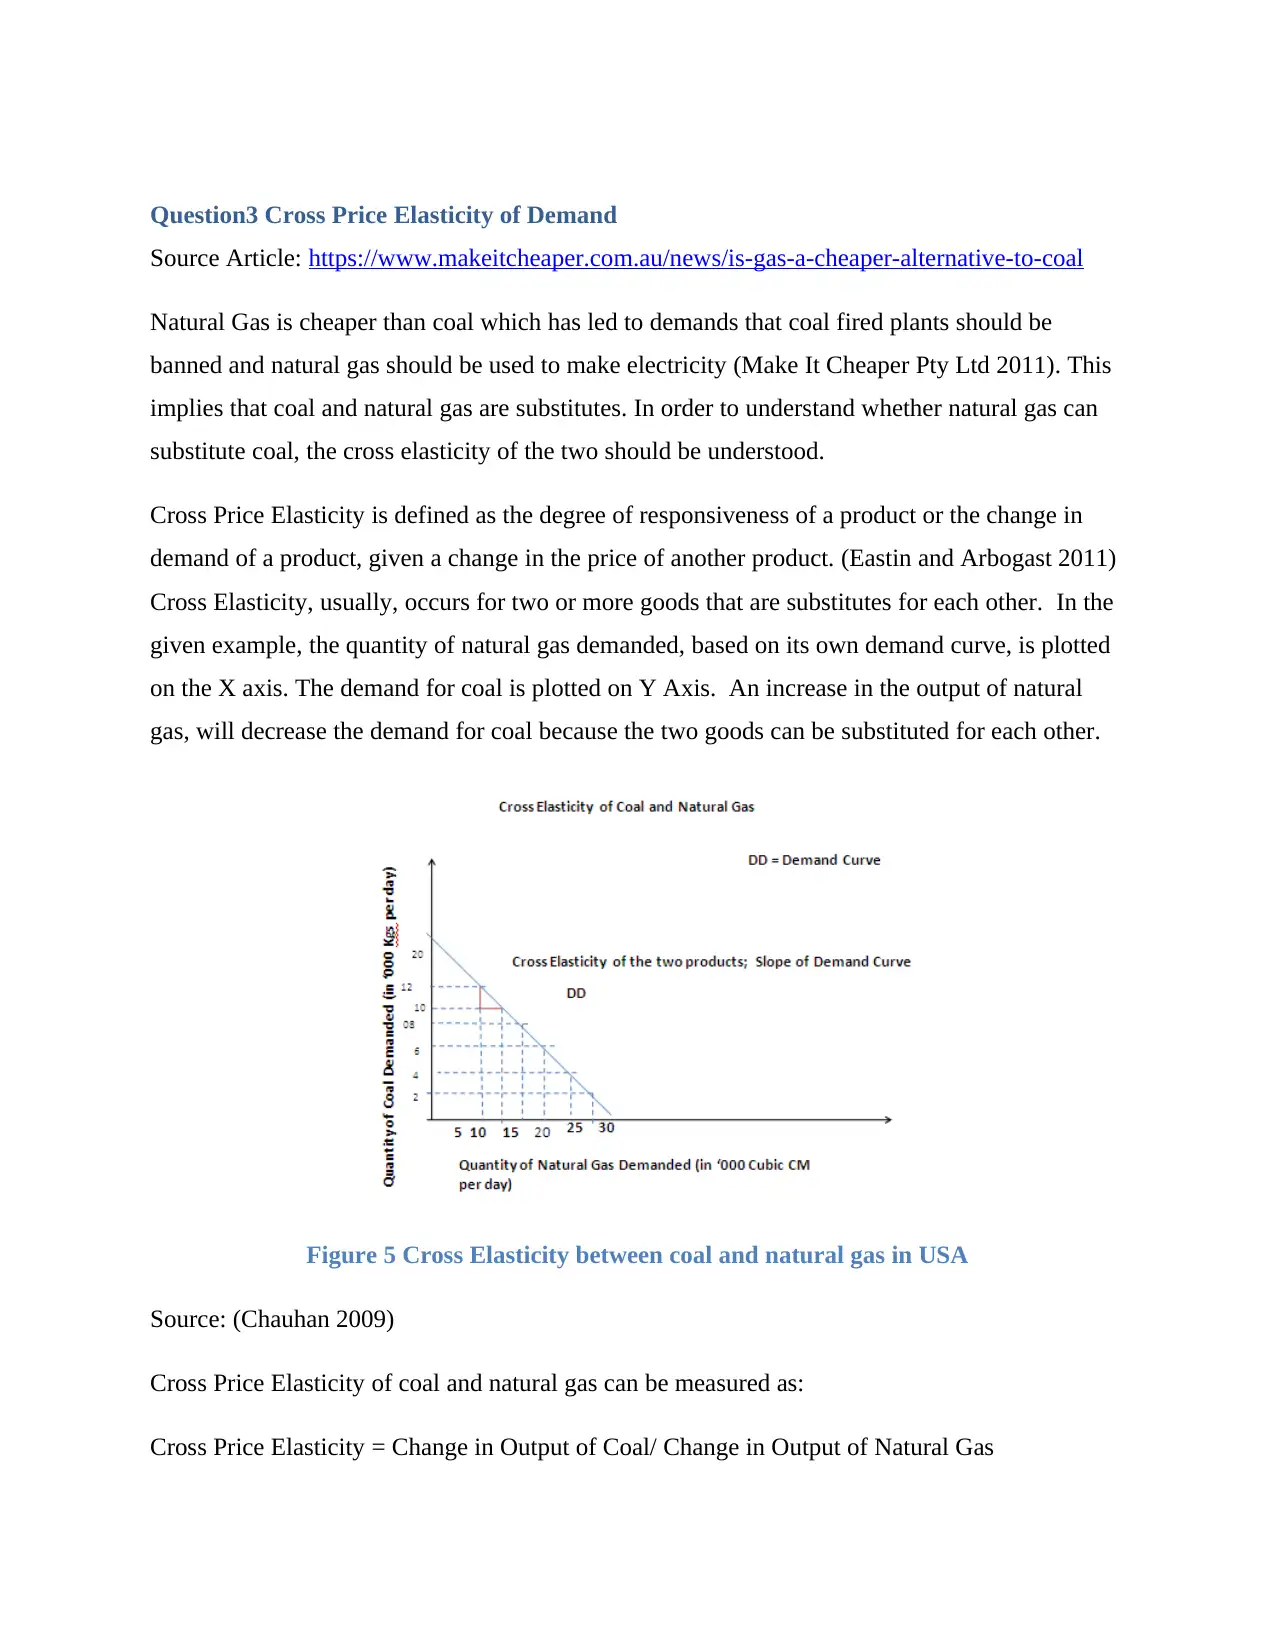
Question3 Cross Price Elasticity of Demand
Source Article: https://www.makeitcheaper.com.au/news/is-gas-a-cheaper-alternative-to-coal
Natural Gas is cheaper than coal which has led to demands that coal fired plants should be
banned and natural gas should be used to make electricity (Make It Cheaper Pty Ltd 2011). This
implies that coal and natural gas are substitutes. In order to understand whether natural gas can
substitute coal, the cross elasticity of the two should be understood.
Cross Price Elasticity is defined as the degree of responsiveness of a product or the change in
demand of a product, given a change in the price of another product. (Eastin and Arbogast 2011)
Cross Elasticity, usually, occurs for two or more goods that are substitutes for each other. In the
given example, the quantity of natural gas demanded, based on its own demand curve, is plotted
on the X axis. The demand for coal is plotted on Y Axis. An increase in the output of natural
gas, will decrease the demand for coal because the two goods can be substituted for each other.
Figure 5 Cross Elasticity between coal and natural gas in USA
Source: (Chauhan 2009)
Cross Price Elasticity of coal and natural gas can be measured as:
Cross Price Elasticity = Change in Output of Coal/ Change in Output of Natural Gas
Paraphrase This Document
Need a fresh take? Get an instant paraphrase of this document with our AI Paraphraser
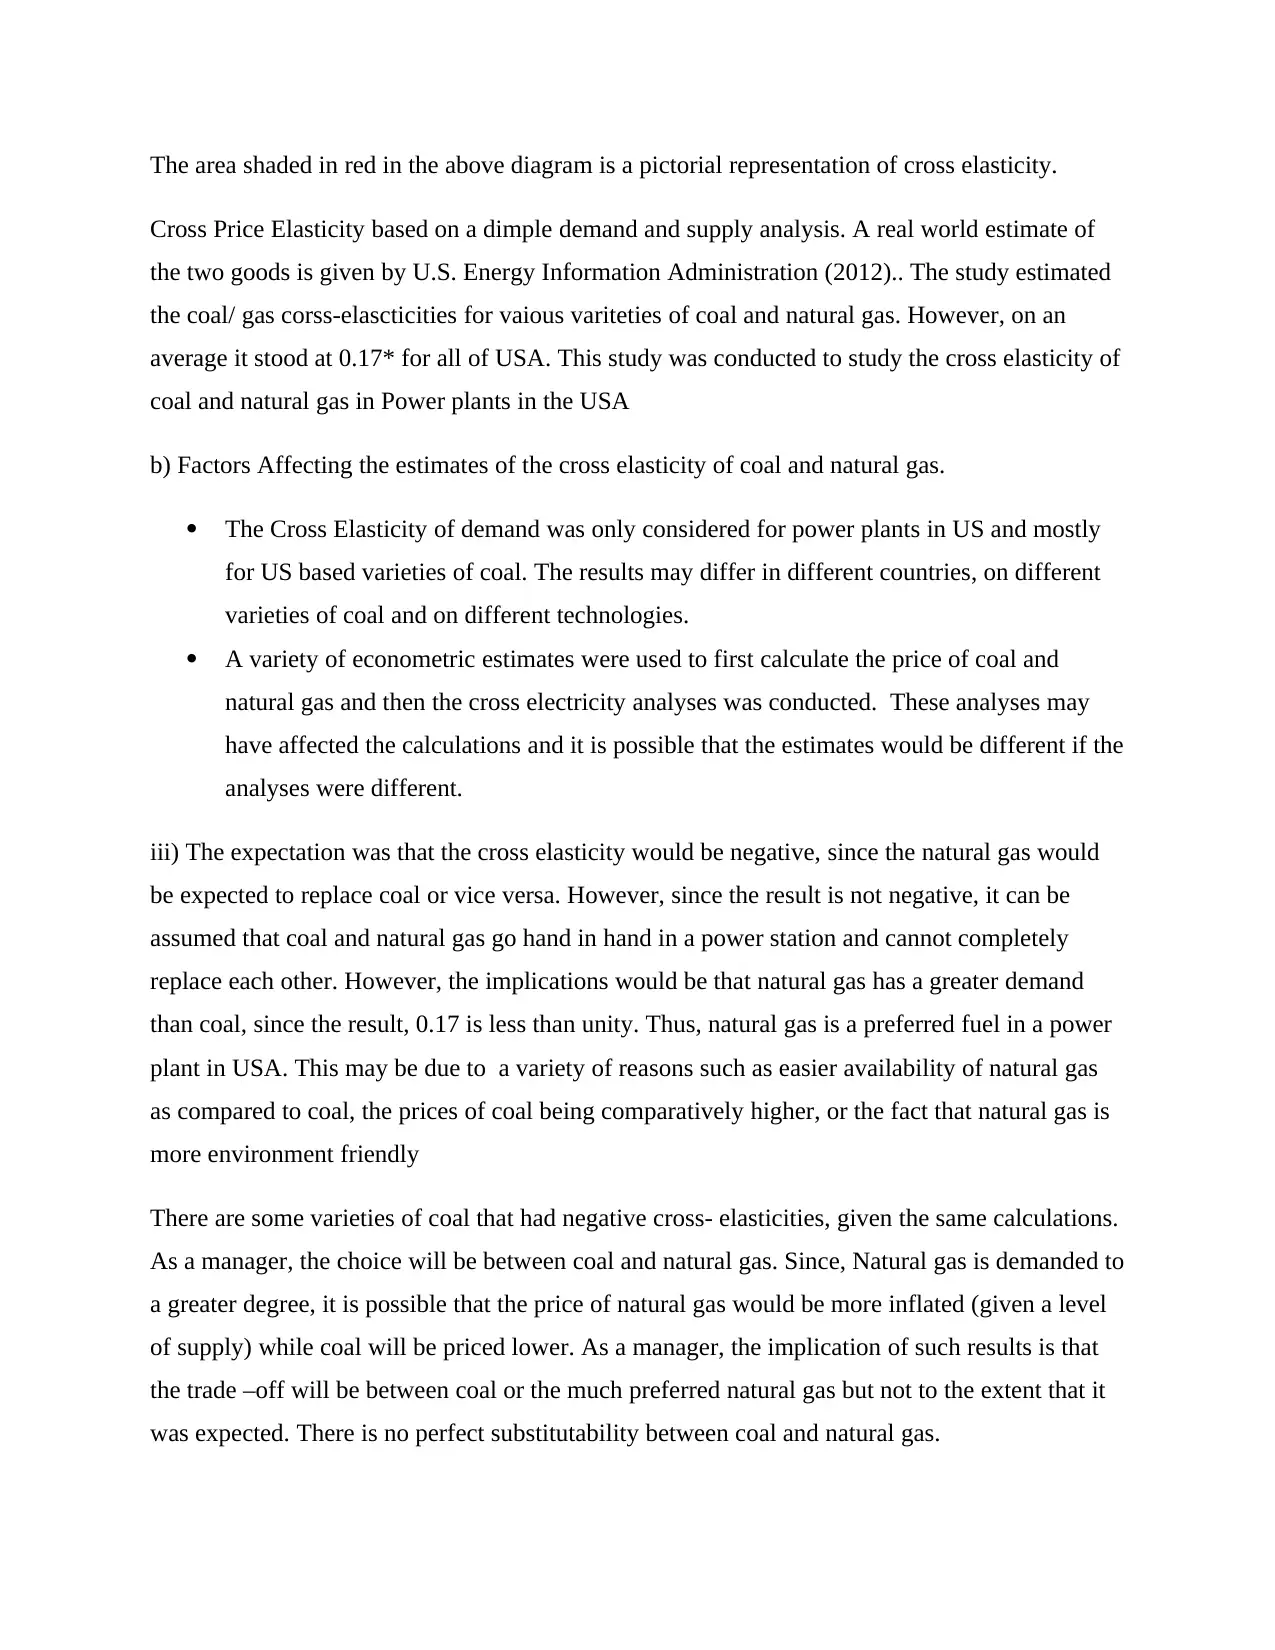
The area shaded in red in the above diagram is a pictorial representation of cross elasticity.
Cross Price Elasticity based on a dimple demand and supply analysis. A real world estimate of
the two goods is given by U.S. Energy Information Administration (2012).. The study estimated
the coal/ gas corss-elascticities for vaious variteties of coal and natural gas. However, on an
average it stood at 0.17* for all of USA. This study was conducted to study the cross elasticity of
coal and natural gas in Power plants in the USA
b) Factors Affecting the estimates of the cross elasticity of coal and natural gas.
The Cross Elasticity of demand was only considered for power plants in US and mostly
for US based varieties of coal. The results may differ in different countries, on different
varieties of coal and on different technologies.
A variety of econometric estimates were used to first calculate the price of coal and
natural gas and then the cross electricity analyses was conducted. These analyses may
have affected the calculations and it is possible that the estimates would be different if the
analyses were different.
iii) The expectation was that the cross elasticity would be negative, since the natural gas would
be expected to replace coal or vice versa. However, since the result is not negative, it can be
assumed that coal and natural gas go hand in hand in a power station and cannot completely
replace each other. However, the implications would be that natural gas has a greater demand
than coal, since the result, 0.17 is less than unity. Thus, natural gas is a preferred fuel in a power
plant in USA. This may be due to a variety of reasons such as easier availability of natural gas
as compared to coal, the prices of coal being comparatively higher, or the fact that natural gas is
more environment friendly
There are some varieties of coal that had negative cross- elasticities, given the same calculations.
As a manager, the choice will be between coal and natural gas. Since, Natural gas is demanded to
a greater degree, it is possible that the price of natural gas would be more inflated (given a level
of supply) while coal will be priced lower. As a manager, the implication of such results is that
the trade –off will be between coal or the much preferred natural gas but not to the extent that it
was expected. There is no perfect substitutability between coal and natural gas.
Bibliography
CHAUHAN, SPS (2009). MICROECONOMICS: Theory and Applications, Part 1. New Delhi, PHI.
CHOUDHARY, Sahile roy and FUJITA, Akiko (2018). Uber is set to invest 'heavily' in Australia, executive
says. [online]. Last updated 29 March. https://www.cnbc.com/2018/03/29/uber-exec-says-australa-a-
key-market-for-investment.html
CORNELL UNIVERSITY (2016). The Economics of Uber. [online]. Last updated 16 September.
http://blogs.cornell.edu/info2040/2016/09/19/the-economics-of-uber/
EASTIN, Richard V. and ARBOGAST, Gary L. (2011). Demand and Supply Analysis: Introduction. CFA
Institute.
HEGDE, Chandan (2014). The Economics of Uber. [online]. Last updated 19 August.
http://economicstudents.com/2014/08/the-economics-of-uber/
HOCHMA, Tomer (2013). Cognitive Biases: Why We Make Irrational Decisions. [online]. Last updated 13
February. https://www.spring.org.uk/2013/02/cognitive-biases-why-we-make-irrational-decisions.php
MAKE IT CHEAPER PTY LTD (2011). Is gas a cheaper alternative to coal? [online]. Last updated 19 August.
https://www.makeitcheaper.com.au/news/is-gas-a-cheaper-alternative-to-coal
MANKIW, Gregory (2008). Principles of Microeconomics. 5th ed., Mason Ohio, Cengage Learning.
MOORE, Tony (2017). A $530,000 Qld taxi licence is now worth less than $150,000: cabbies. [online].
Last updated 21 September. https://www.brisbanetimes.com.au/national/queensland/a-530-000-
queensland-cab-licence-is-now-worth-under-150-000-cabbies-20170921-p4yw1g.html
PASICK, Adam (2013). MORE ADULT DIAPERS THAN BABY ONES TO BE SOLD IN JAPAN. [online]. Last
updated 11 July. https://www.theatlantic.com/business/archive/2013/07/in-rapidly-aging-japan-adult-
diaper-sales-are-about-to-surpass-baby-diapers/277706/
REDRUP, Yolanda (2018). Taxify claims flying start in Aussie Uber battle. [online]. Last updated 16 April.
http://www.afr.com/technology/taxify-claims-flying-start-in-aussie-uber-battle-20180409-h0yk1w
SALAI, Suzana and KOVAč, Ružica (2011). Marketing Research in the Contemporary
ConsumerEnvironment. Management Information Systems , 6 (4), 15-22.
SAMUELSON, Paul A. and NORDHAUS, William D. (2006). Economics (18th International Edition). New
delhi, Tata McGraw Hill.
THE WHARTON SCHOOL, UNIVERSITY OF PENNSYLVANIA (2017). Growth vs. Profits: Uber’s Cash Burn
Dilemma. [online]. Last updated 27 Januaury. http://knowledge.wharton.upenn.edu/article/growth-vs-
profits-ubers-cash-burn-dilemma/
⊘ This is a preview!⊘
Do you want full access?
Subscribe today to unlock all pages.
Trusted by 1+ million students worldwide
1 out of 13
Related Documents


Your All-in-One AI-Powered Toolkit for Academic Success.
+13062052269
info@desklib.com
Available 24*7 on WhatsApp / Email
![[object Object]](/_next/static/media/star-bottom.7253800d.svg)
Unlock your academic potential
Copyright © 2020–2026 A2Z Services. All Rights Reserved. Developed and managed by ZUCOL.