ACC00716 Finance Report: Beacon Lighting (BLX) - Analysis
VerifiedAdded on 2022/09/14
|13
|1803
|12
Report
AI Summary
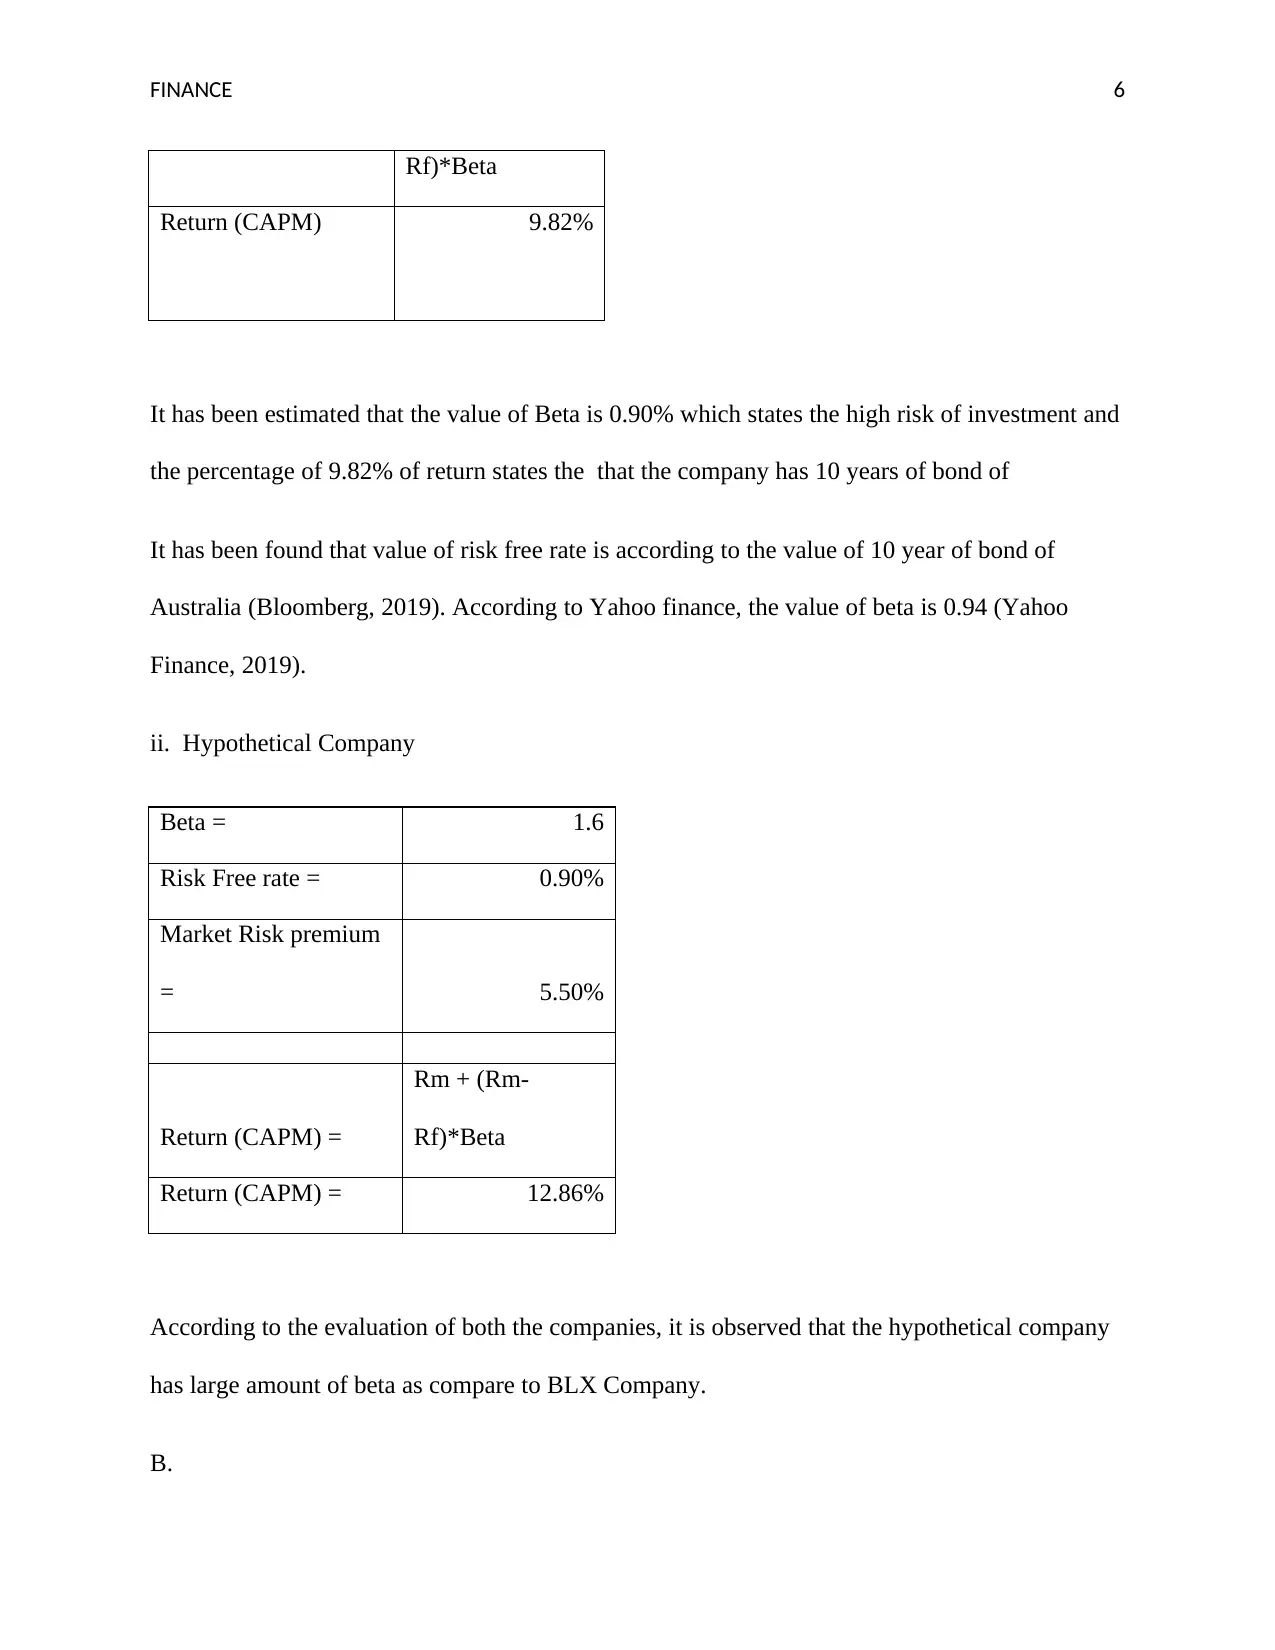
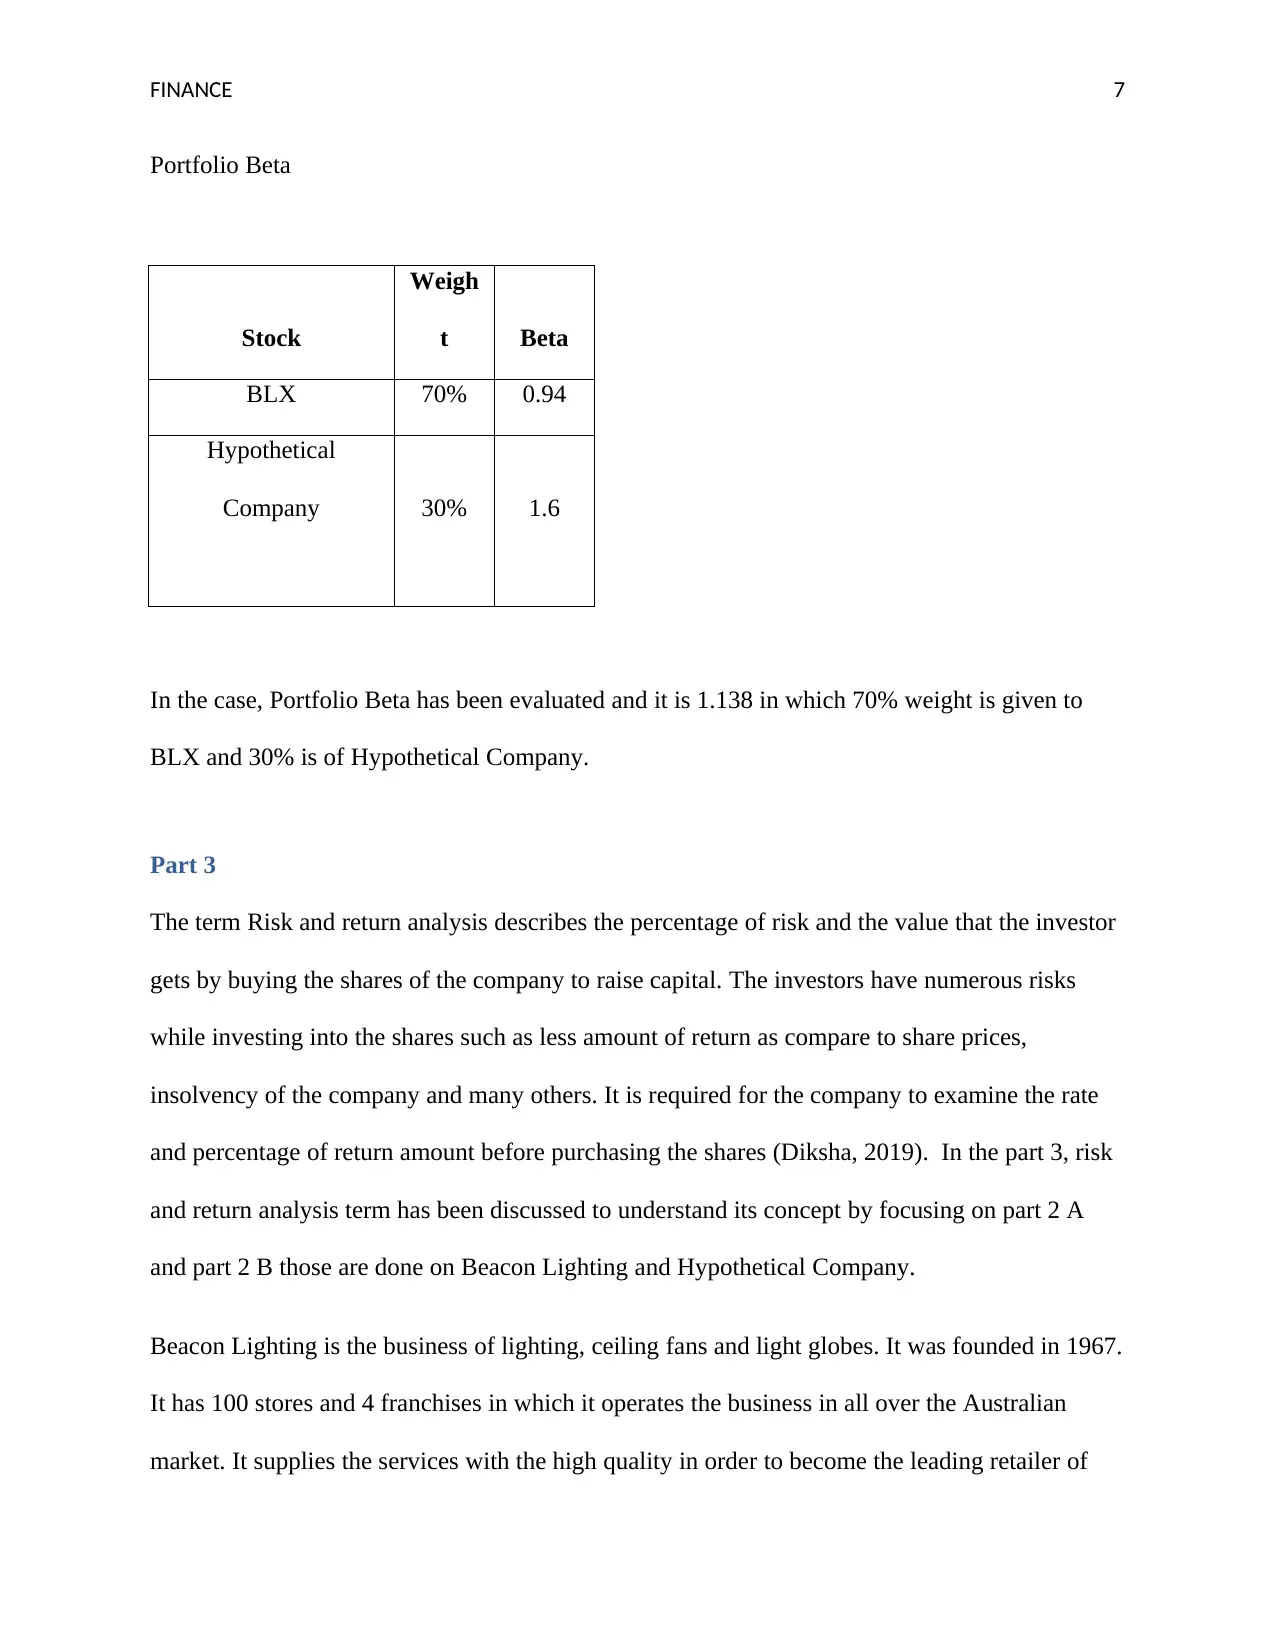
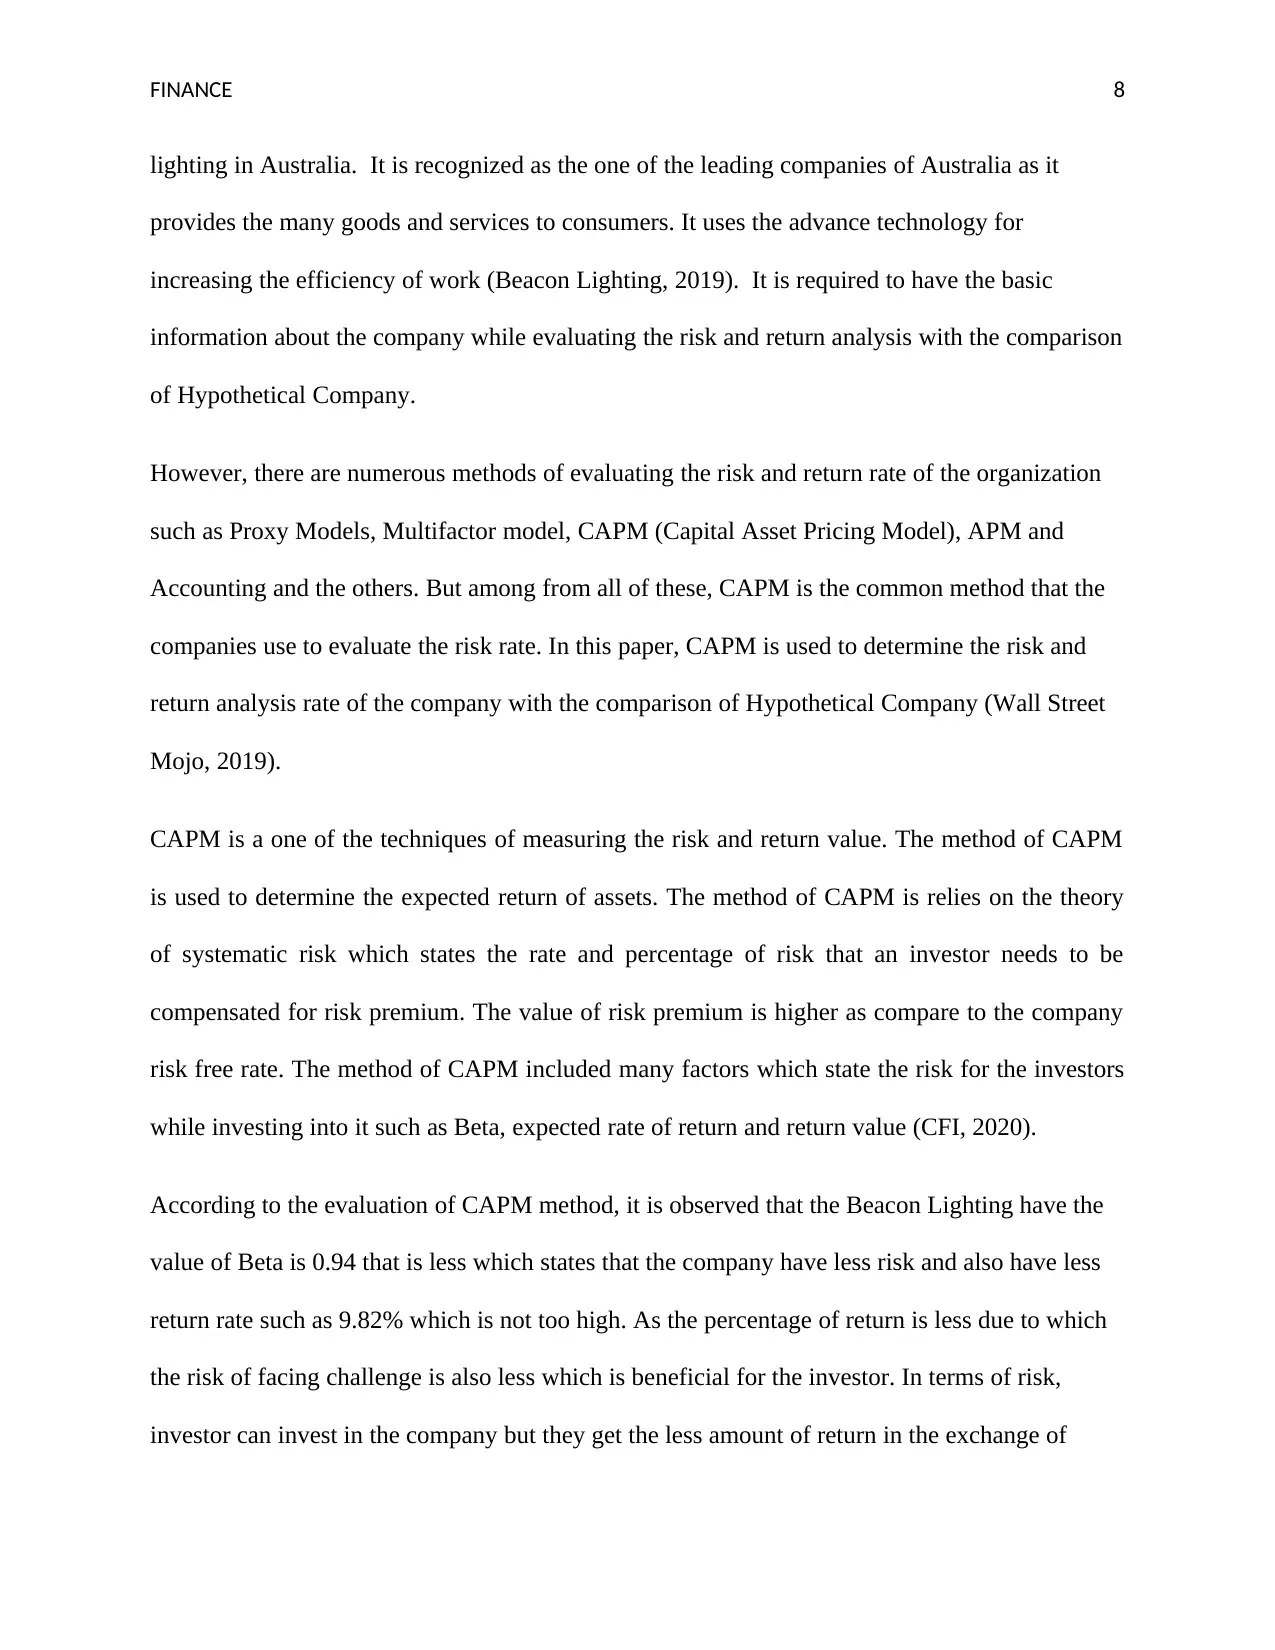
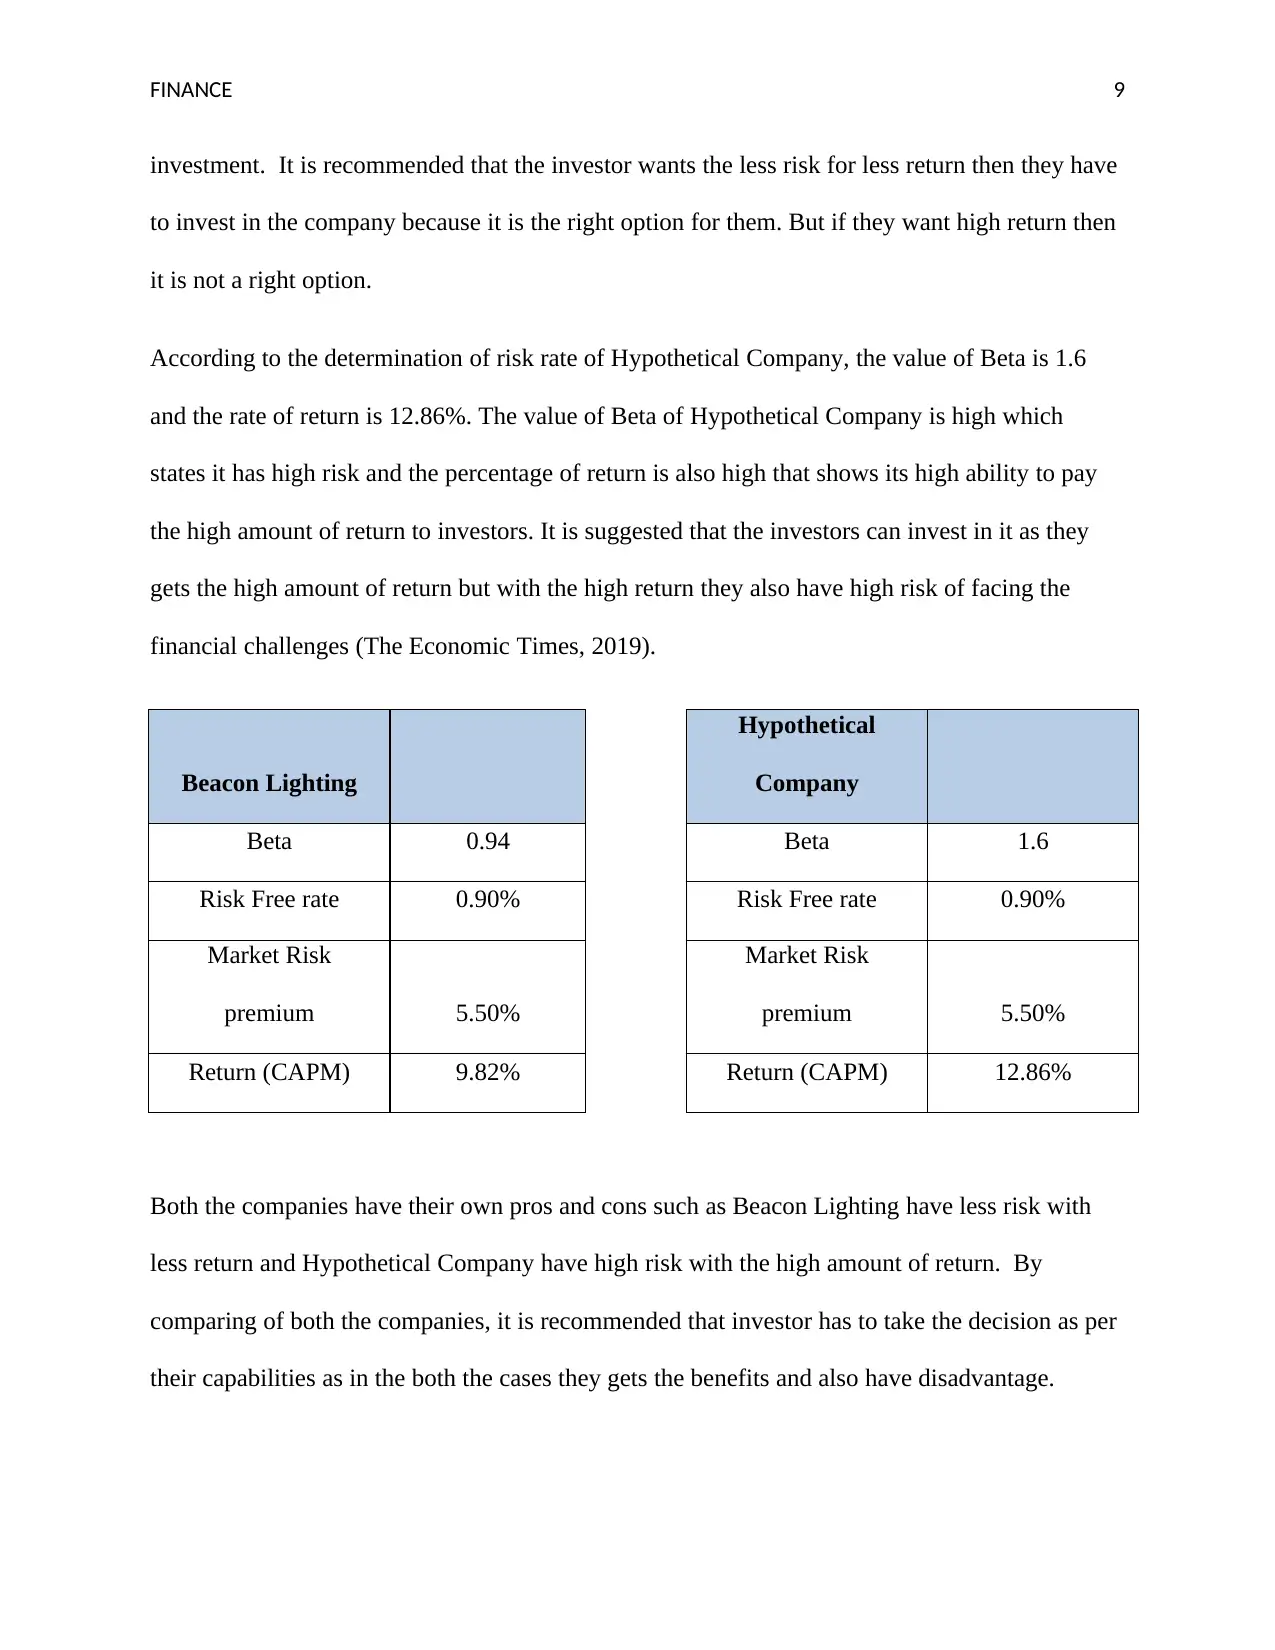
This finance report analyzes Beacon Lighting (BLX) using financial principles. Part 1 addresses time value of money and bond valuation, including APR calculations, revenue growth projections, effective interest rates, loan payment computations, and yield to maturity. Part 2 evaluates risk and return, using Capital Asset Pricing Model (CAPM) to assess the company and a hypothetical company's risk profiles, including Beta calculations and portfolio beta analysis. Part 3 discusses risk and return, comparing Beacon Lighting to a hypothetical company, and the use of CAPM to determine risk and return rates, considering factors like Beta and return percentages, concluding with investment recommendations based on risk tolerance and the importance of portfolio diversification.

Beacon Lighting(BLX)
Finance
Finance
Paraphrase This Document
Need a fresh take? Get an instant paraphrase of this document with our AI Paraphraser

Finance
FINANCE 1
FINANCE 1

FINANCE 2
The main aim of this report is to discuss the topic of “Times Value of Money and risk and return
analysis”. The report has been classified into three parts such as Part 1, Part 2 and Part 3. In this
paper, Beacon Lighting (BLX) has been taken into consideration from the case study in order to
evaluate the questions.
Part 1
A.
APR 6%
Years 5
Periods 60
Periodic Rate 0.50%
PMT $ 891.00
Amount Borrowed = $46,087.47
It has been evaluated that the amount of the company has been borrowed in 5 years is $46,087.47
with the 6% of interest.
B.
Annual Revenue
(million) $ 247.70
Annual Rate of growth 9.90%
⊘ This is a preview!⊘
Do you want full access?
Subscribe today to unlock all pages.

Trusted by 1+ million students worldwide

FINANCE 3
Annual Revenue of the company is $1,509.23 in 5 years and it is growing by the percentage of
9.90%.
C.
Loan A Loan B Loan C
Rate 5.45% 5.50% 5.40%
Compounding Monthly
Semi
Annually Daily
EAR 5.59% 5.63% 5.60%
The EAR of the company in three types of loan such as Loan A, B, and C is 5.59%, 5.63% and
5.60% in a respective manner. The least effective rate have in three loans is Loan A, and it can
be said that Loan A must be chosen by the company.
D.
Computation of amount of payments of loan
Loan amount
$
1,650,000.00
Year of loan 20
Number of periods 40
Interest rate (annual) 4.20%
Applicable rate 2.10%
Paraphrase This Document
Need a fresh take? Get an instant paraphrase of this document with our AI Paraphraser

FINANCE 4
The loan amount of the company is $61,379.81with the semi-annually.
E.
Yield to maturity of Bonds
C 5.85%
F $1,000.00
P $922.00
N 6
YTM 7.44%
It is evaluated that the percentage of Yield Maturity Bond is 7.44% with the 6 years of annual
coupon bonds.
F.
Computation of the market price of the
bonds
Face Value =
$
100.00
Period
Cash
Flow PVF PV
1 5 0.972 4.86
2 5 0.944 4.72

FINANCE 5
3 5 0.918 4.59
4 5 0.892 4.46
5 5 0.867 4.33
6 5 0.842 4.21
7 5 0.819 4.09
8 105 0.796 83.53
Market
Price 114.80
It is determined that the market price of bond is 114.80.
Part 2
There are two parts in the sections that contains the evaluation of risk and return analysis and
these are:
A. In this part, the value of risk is determined of the company and the hypothetical company.
i. Company
Beta = 0.94
Risk Free rate = 0.90%
Market Risk premium 5.50%
Return (CAPM) Rm + (Rm-
⊘ This is a preview!⊘
Do you want full access?
Subscribe today to unlock all pages.

Trusted by 1+ million students worldwide

FINANCE 6
Rf)*Beta
Return (CAPM) 9.82%
It has been estimated that the value of Beta is 0.90% which states the high risk of investment and
the percentage of 9.82% of return states the that the company has 10 years of bond of
It has been found that value of risk free rate is according to the value of 10 year of bond of
Australia (Bloomberg, 2019). According to Yahoo finance, the value of beta is 0.94 (Yahoo
Finance, 2019).
ii. Hypothetical Company
Beta = 1.6
Risk Free rate = 0.90%
Market Risk premium
= 5.50%
Return (CAPM) =
Rm + (Rm-
Rf)*Beta
Return (CAPM) = 12.86%
According to the evaluation of both the companies, it is observed that the hypothetical company
has large amount of beta as compare to BLX Company.
B.
Rf)*Beta
Return (CAPM) 9.82%
It has been estimated that the value of Beta is 0.90% which states the high risk of investment and
the percentage of 9.82% of return states the that the company has 10 years of bond of
It has been found that value of risk free rate is according to the value of 10 year of bond of
Australia (Bloomberg, 2019). According to Yahoo finance, the value of beta is 0.94 (Yahoo
Finance, 2019).
ii. Hypothetical Company
Beta = 1.6
Risk Free rate = 0.90%
Market Risk premium
= 5.50%
Return (CAPM) =
Rm + (Rm-
Rf)*Beta
Return (CAPM) = 12.86%
According to the evaluation of both the companies, it is observed that the hypothetical company
has large amount of beta as compare to BLX Company.
B.
Paraphrase This Document
Need a fresh take? Get an instant paraphrase of this document with our AI Paraphraser

FINANCE 7
Portfolio Beta
Stock
Weigh
t Beta
BLX 70% 0.94
Hypothetical
Company 30% 1.6
In the case, Portfolio Beta has been evaluated and it is 1.138 in which 70% weight is given to
BLX and 30% is of Hypothetical Company.
Part 3
The term Risk and return analysis describes the percentage of risk and the value that the investor
gets by buying the shares of the company to raise capital. The investors have numerous risks
while investing into the shares such as less amount of return as compare to share prices,
insolvency of the company and many others. It is required for the company to examine the rate
and percentage of return amount before purchasing the shares (Diksha, 2019). In the part 3, risk
and return analysis term has been discussed to understand its concept by focusing on part 2 A
and part 2 B those are done on Beacon Lighting and Hypothetical Company.
Beacon Lighting is the business of lighting, ceiling fans and light globes. It was founded in 1967.
It has 100 stores and 4 franchises in which it operates the business in all over the Australian
market. It supplies the services with the high quality in order to become the leading retailer of

FINANCE 8
lighting in Australia. It is recognized as the one of the leading companies of Australia as it
provides the many goods and services to consumers. It uses the advance technology for
increasing the efficiency of work (Beacon Lighting, 2019). It is required to have the basic
information about the company while evaluating the risk and return analysis with the comparison
of Hypothetical Company.
However, there are numerous methods of evaluating the risk and return rate of the organization
such as Proxy Models, Multifactor model, CAPM (Capital Asset Pricing Model), APM and
Accounting and the others. But among from all of these, CAPM is the common method that the
companies use to evaluate the risk rate. In this paper, CAPM is used to determine the risk and
return analysis rate of the company with the comparison of Hypothetical Company (Wall Street
Mojo, 2019).
CAPM is a one of the techniques of measuring the risk and return value. The method of CAPM
is used to determine the expected return of assets. The method of CAPM is relies on the theory
of systematic risk which states the rate and percentage of risk that an investor needs to be
compensated for risk premium. The value of risk premium is higher as compare to the company
risk free rate. The method of CAPM included many factors which state the risk for the investors
while investing into it such as Beta, expected rate of return and return value (CFI, 2020).
According to the evaluation of CAPM method, it is observed that the Beacon Lighting have the
value of Beta is 0.94 that is less which states that the company have less risk and also have less
return rate such as 9.82% which is not too high. As the percentage of return is less due to which
the risk of facing challenge is also less which is beneficial for the investor. In terms of risk,
investor can invest in the company but they get the less amount of return in the exchange of
⊘ This is a preview!⊘
Do you want full access?
Subscribe today to unlock all pages.

Trusted by 1+ million students worldwide

FINANCE 9
investment. It is recommended that the investor wants the less risk for less return then they have
to invest in the company because it is the right option for them. But if they want high return then
it is not a right option.
According to the determination of risk rate of Hypothetical Company, the value of Beta is 1.6
and the rate of return is 12.86%. The value of Beta of Hypothetical Company is high which
states it has high risk and the percentage of return is also high that shows its high ability to pay
the high amount of return to investors. It is suggested that the investors can invest in it as they
gets the high amount of return but with the high return they also have high risk of facing the
financial challenges (The Economic Times, 2019).
Beacon Lighting
Hypothetical
Company
Beta 0.94 Beta 1.6
Risk Free rate 0.90% Risk Free rate 0.90%
Market Risk
premium 5.50%
Market Risk
premium 5.50%
Return (CAPM) 9.82% Return (CAPM) 12.86%
Both the companies have their own pros and cons such as Beacon Lighting have less risk with
less return and Hypothetical Company have high risk with the high amount of return. By
comparing of both the companies, it is recommended that investor has to take the decision as per
their capabilities as in the both the cases they gets the benefits and also have disadvantage.
Paraphrase This Document
Need a fresh take? Get an instant paraphrase of this document with our AI Paraphraser

FINANCE 10
Portfolio is the diversification level of investment goes across the number of companies,
industries, sectors and assets of classes. The evaluation of Portfolio Beta helps the company is to
evaluate the best way to invest in the companies to get the best return (Lemke, 2020). In question
2b, the value of Portfolio Beta has been evaluated. According to the evaluation, the investors
have to invest in BLX Company with 70% of weightage and in Hypothetical Company the
investor have to invest with 30% of weightage. The value of Portfolio Beta is 1.138 which states
the less as compare to the risk of Hypothetical Company. At the end of the paper, it is a best
option for the investors has to invest in both the companies with the different percentage in order
to get the high return with the less risk.

FINANCE 11
References
Bloomberg. (2019) Government Bond Yields. Available From:
https://www.bloomberg.com/markets/rates-bonds/government-bonds/australia [Accessed
10/4/2020].
CFI. (2020) Capital Asset Pricing Model (CAPM). Available From:
https://corporatefinanceinstitute.com/resources/knowledge/finance/what-is-capm-formula/
[Accessed 10/4/2020].
Lemke, T. (2020) How Do You Calculate Portfolio Beta?. Available From:
https://www.thebalance.com/how-to-calculate-your-portfolio-beta-4590382 [Accessed
10/4/2020].
Song, C. (2018) Analysis of Stock IPO Price Based on CAPM Model. Insight-Statistics, 1(1).
Sriyanshu, M. (2019) Techniques Used for Measuring Risk | Risk Management. Available From:
https://www.businessmanagementideas.com/essays/risk-management-essays/techniques-used-
for-measuring-risk-risk-management/12596 [Accessed 10/4/2020].
The Economic Times. (2019) Definition of 'Beta'. Available From:
https://economictimes.indiatimes.com/definition/Beta [Accessed 10/4/2020].
Yahoo Finance. (2019) Beacon Lighting Group Limited (BLX.AX). Available From:
https://au.finance.yahoo.com/quote/BLX.AX/ [Accessed 10/4/2020].
⊘ This is a preview!⊘
Do you want full access?
Subscribe today to unlock all pages.

Trusted by 1+ million students worldwide
1 out of 13
Related Documents

Your All-in-One AI-Powered Toolkit for Academic Success.
+13062052269
info@desklib.com
Available 24*7 on WhatsApp / Email
Unlock your academic potential
Copyright © 2020–2025 A2Z Services. All Rights Reserved. Developed and managed by ZUCOL.