EAT103 Applied Mechanics: Experimental Analysis of Stiffness & Inertia

Verified

Added on  2023/04/22

|16
|1792
|214
Practical Assignment
AI Summary
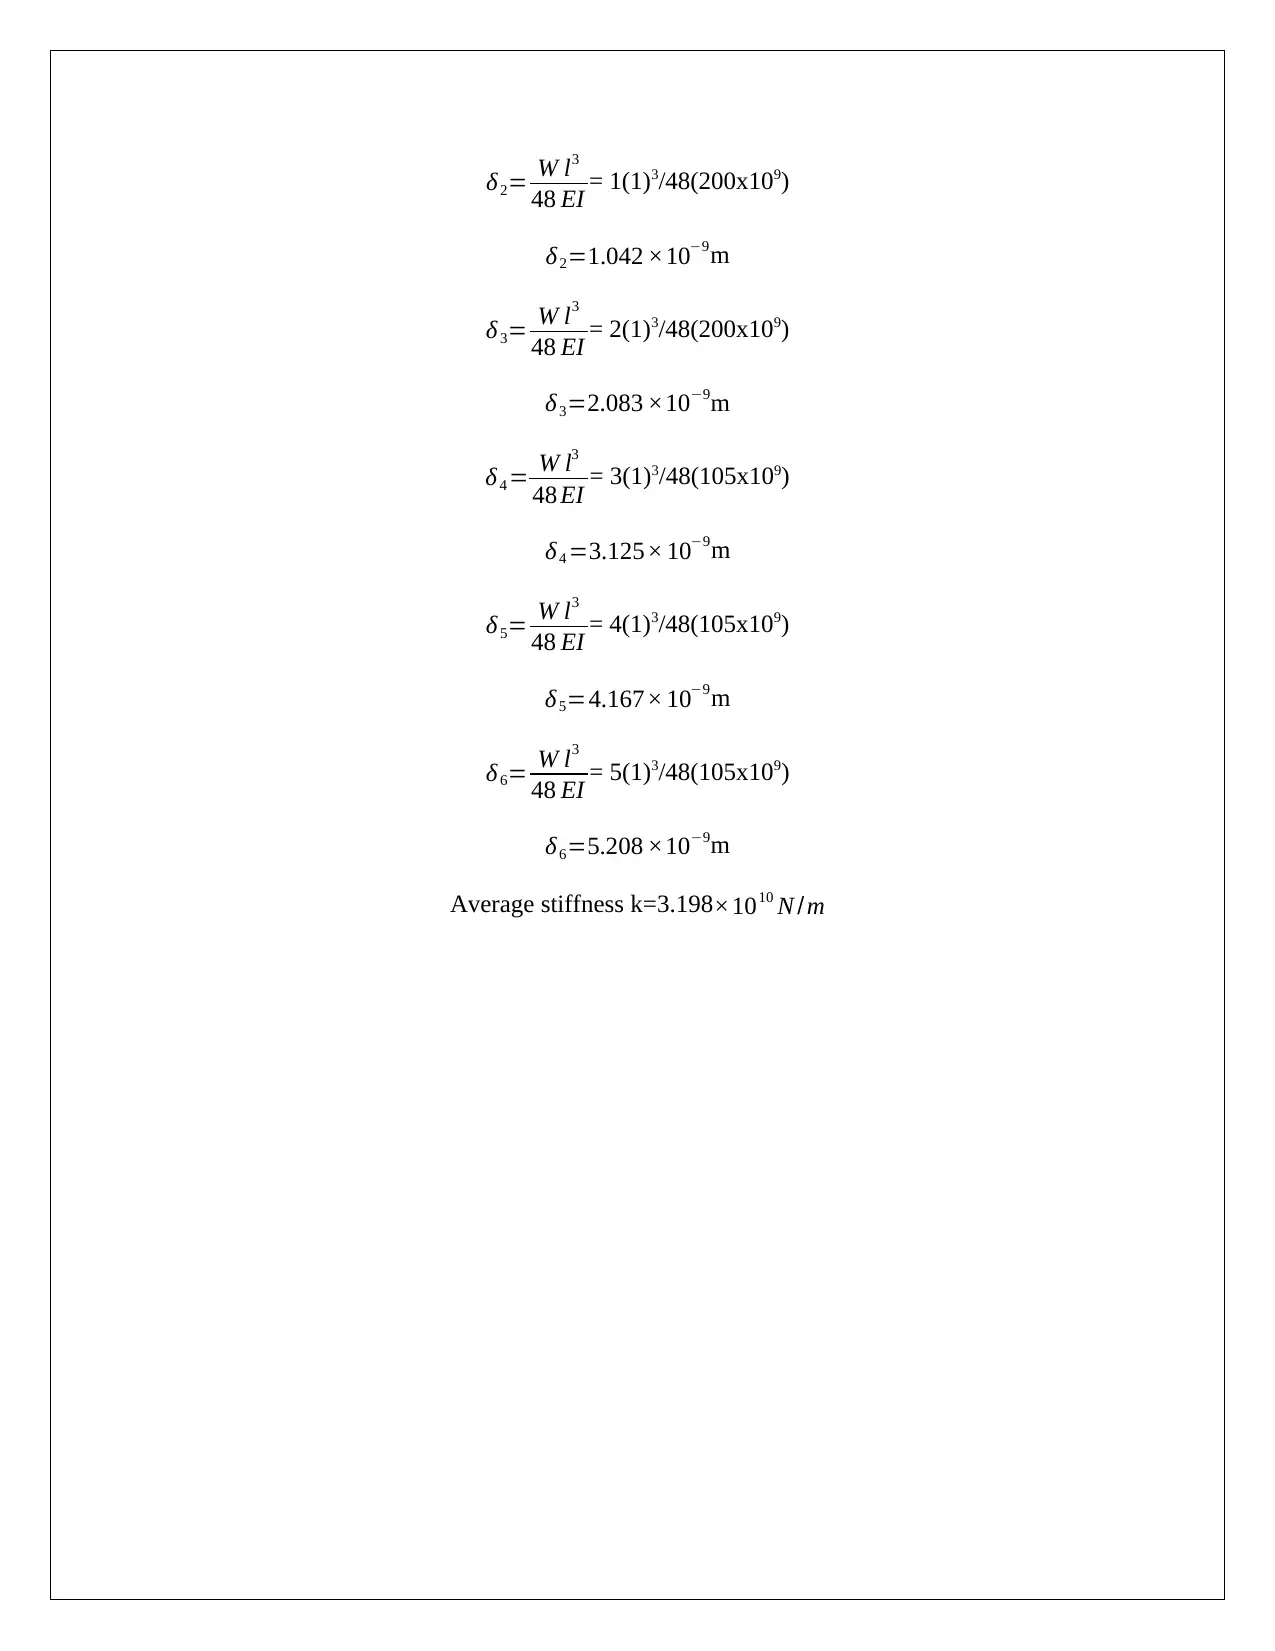
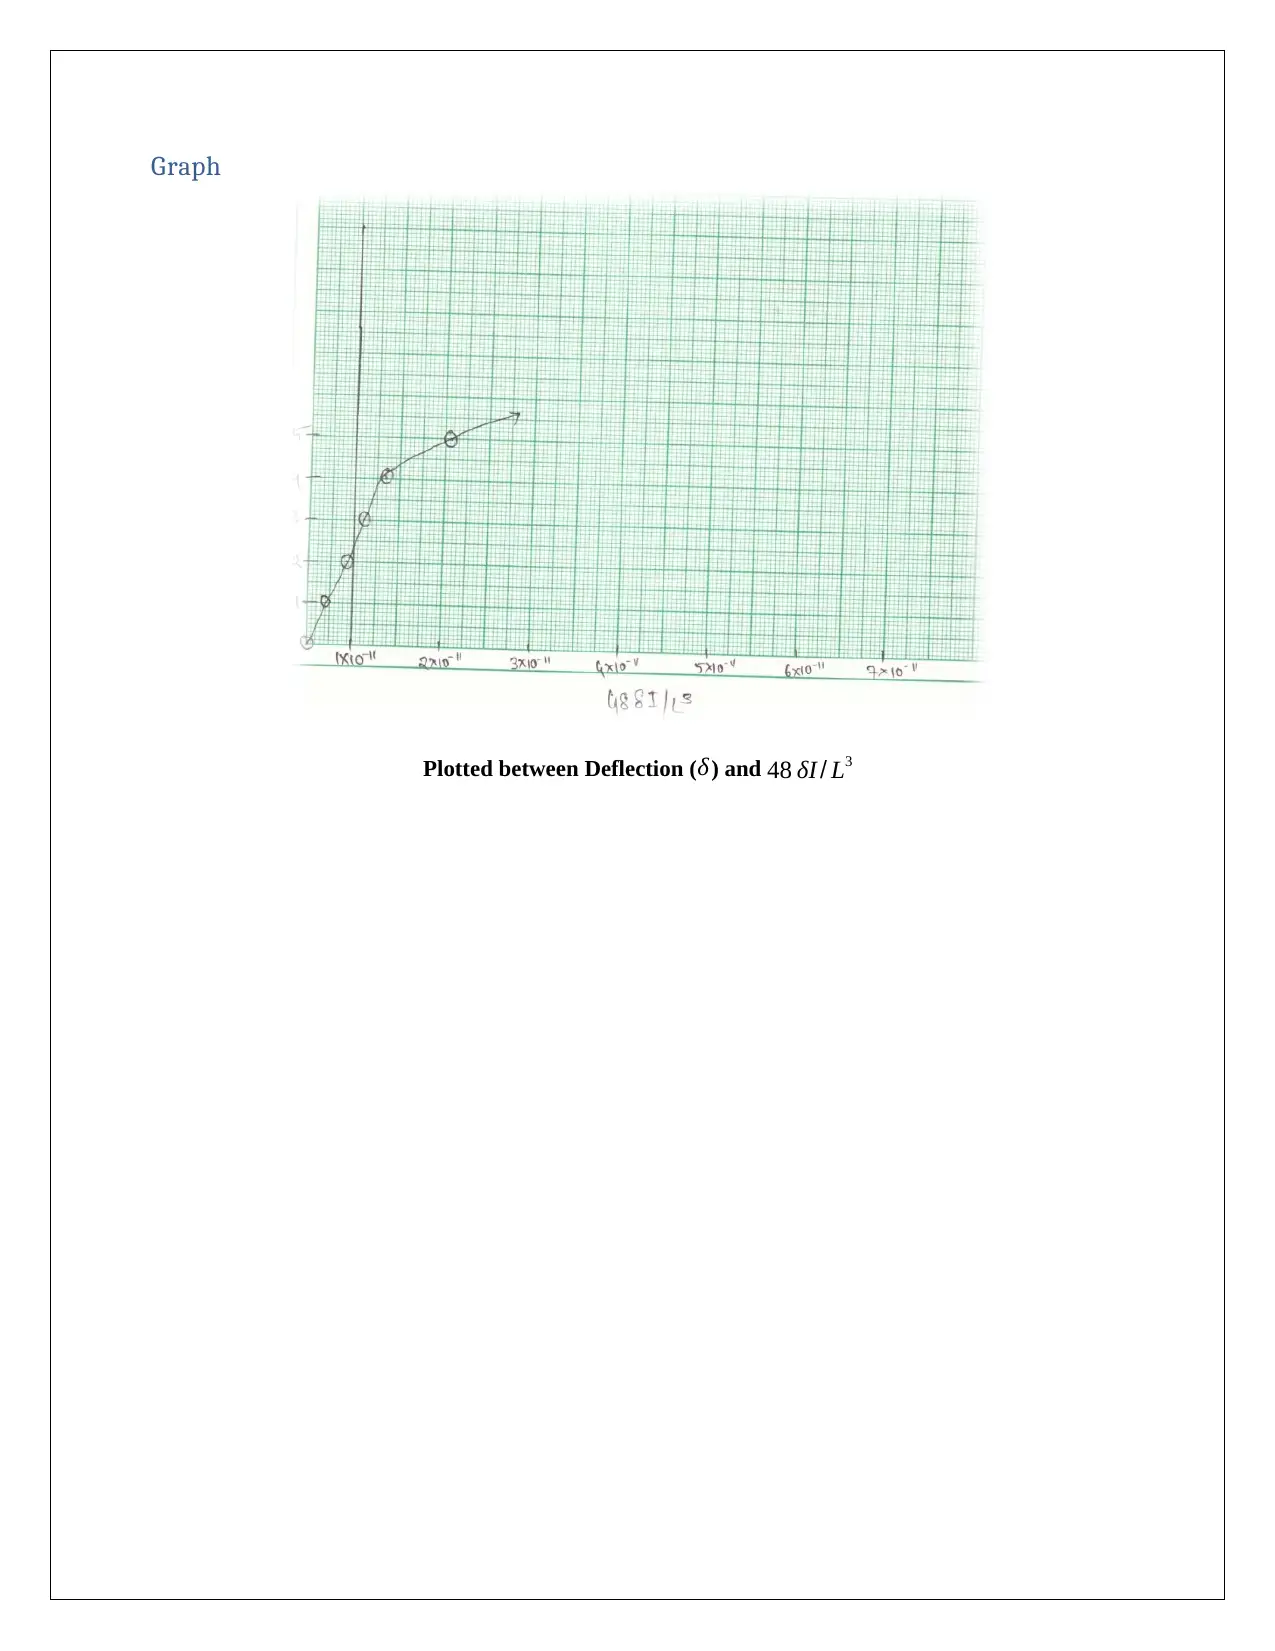
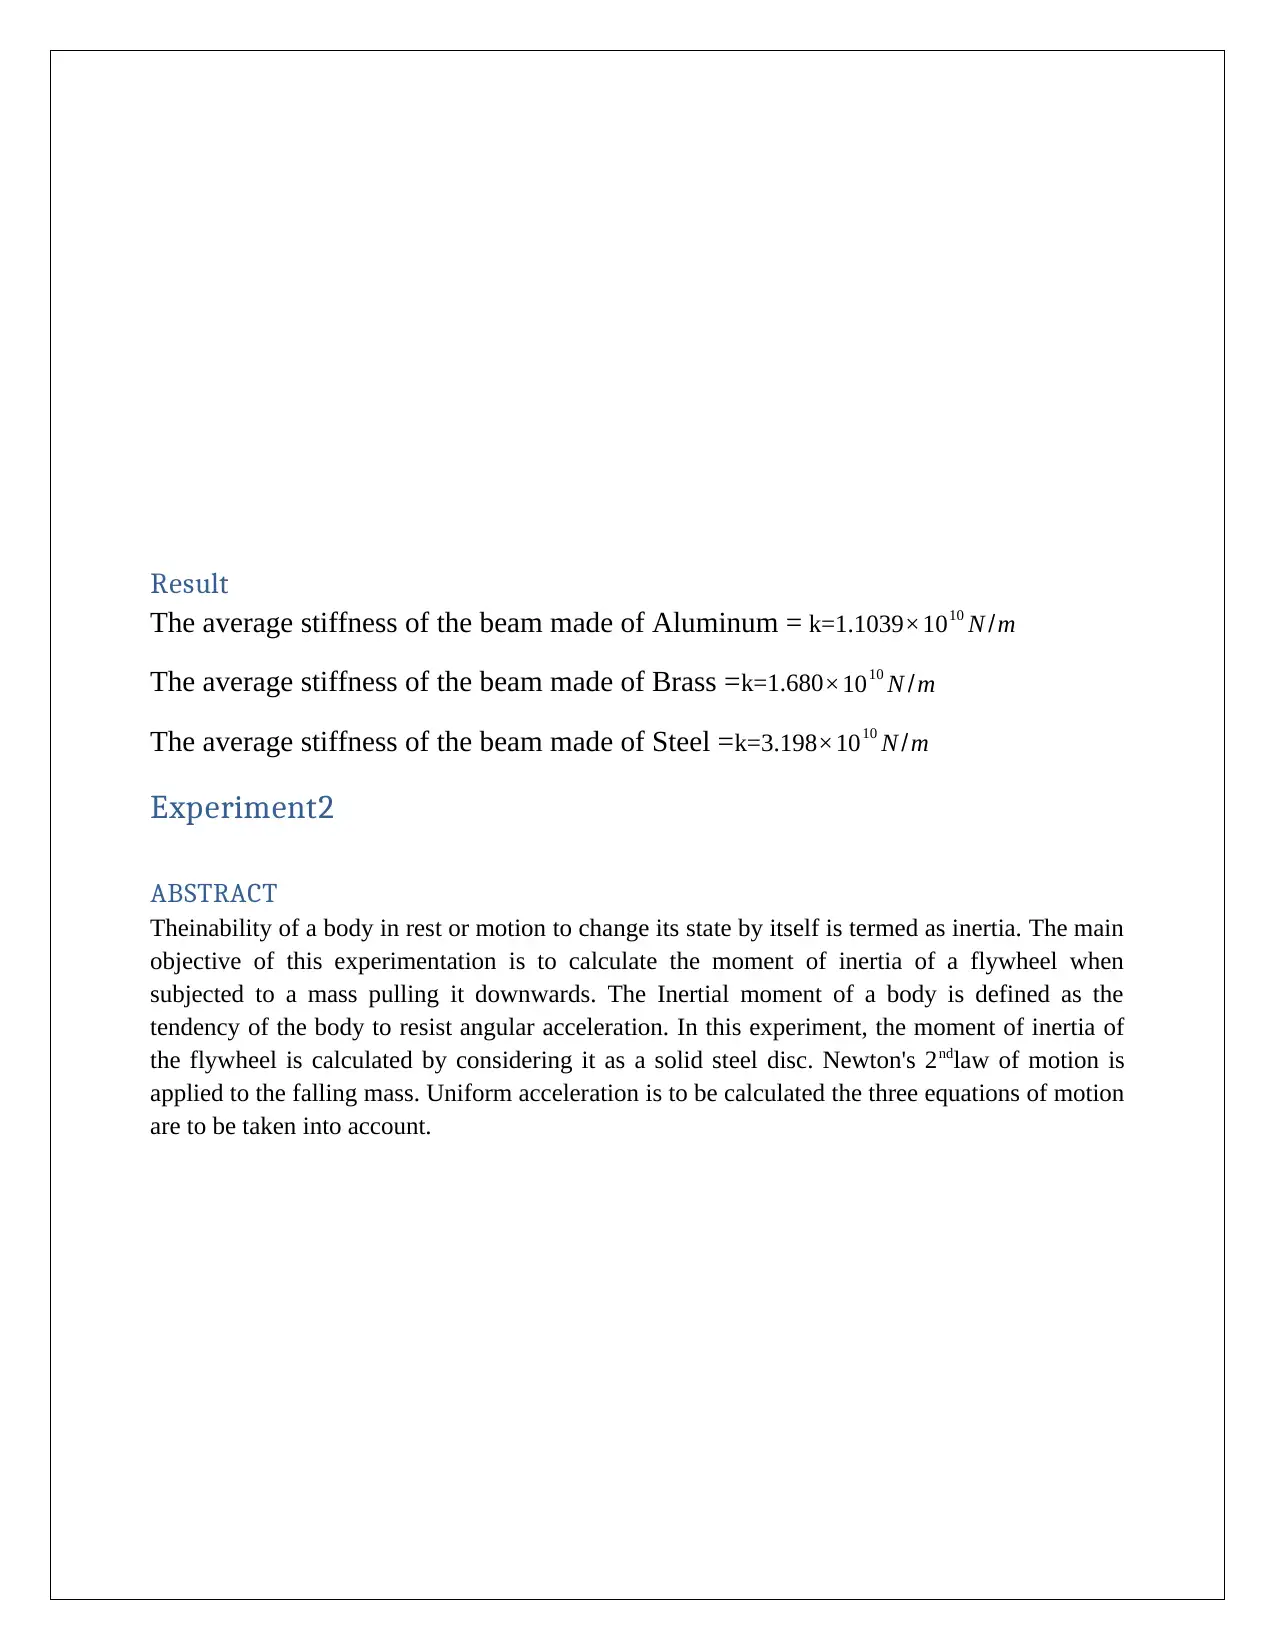
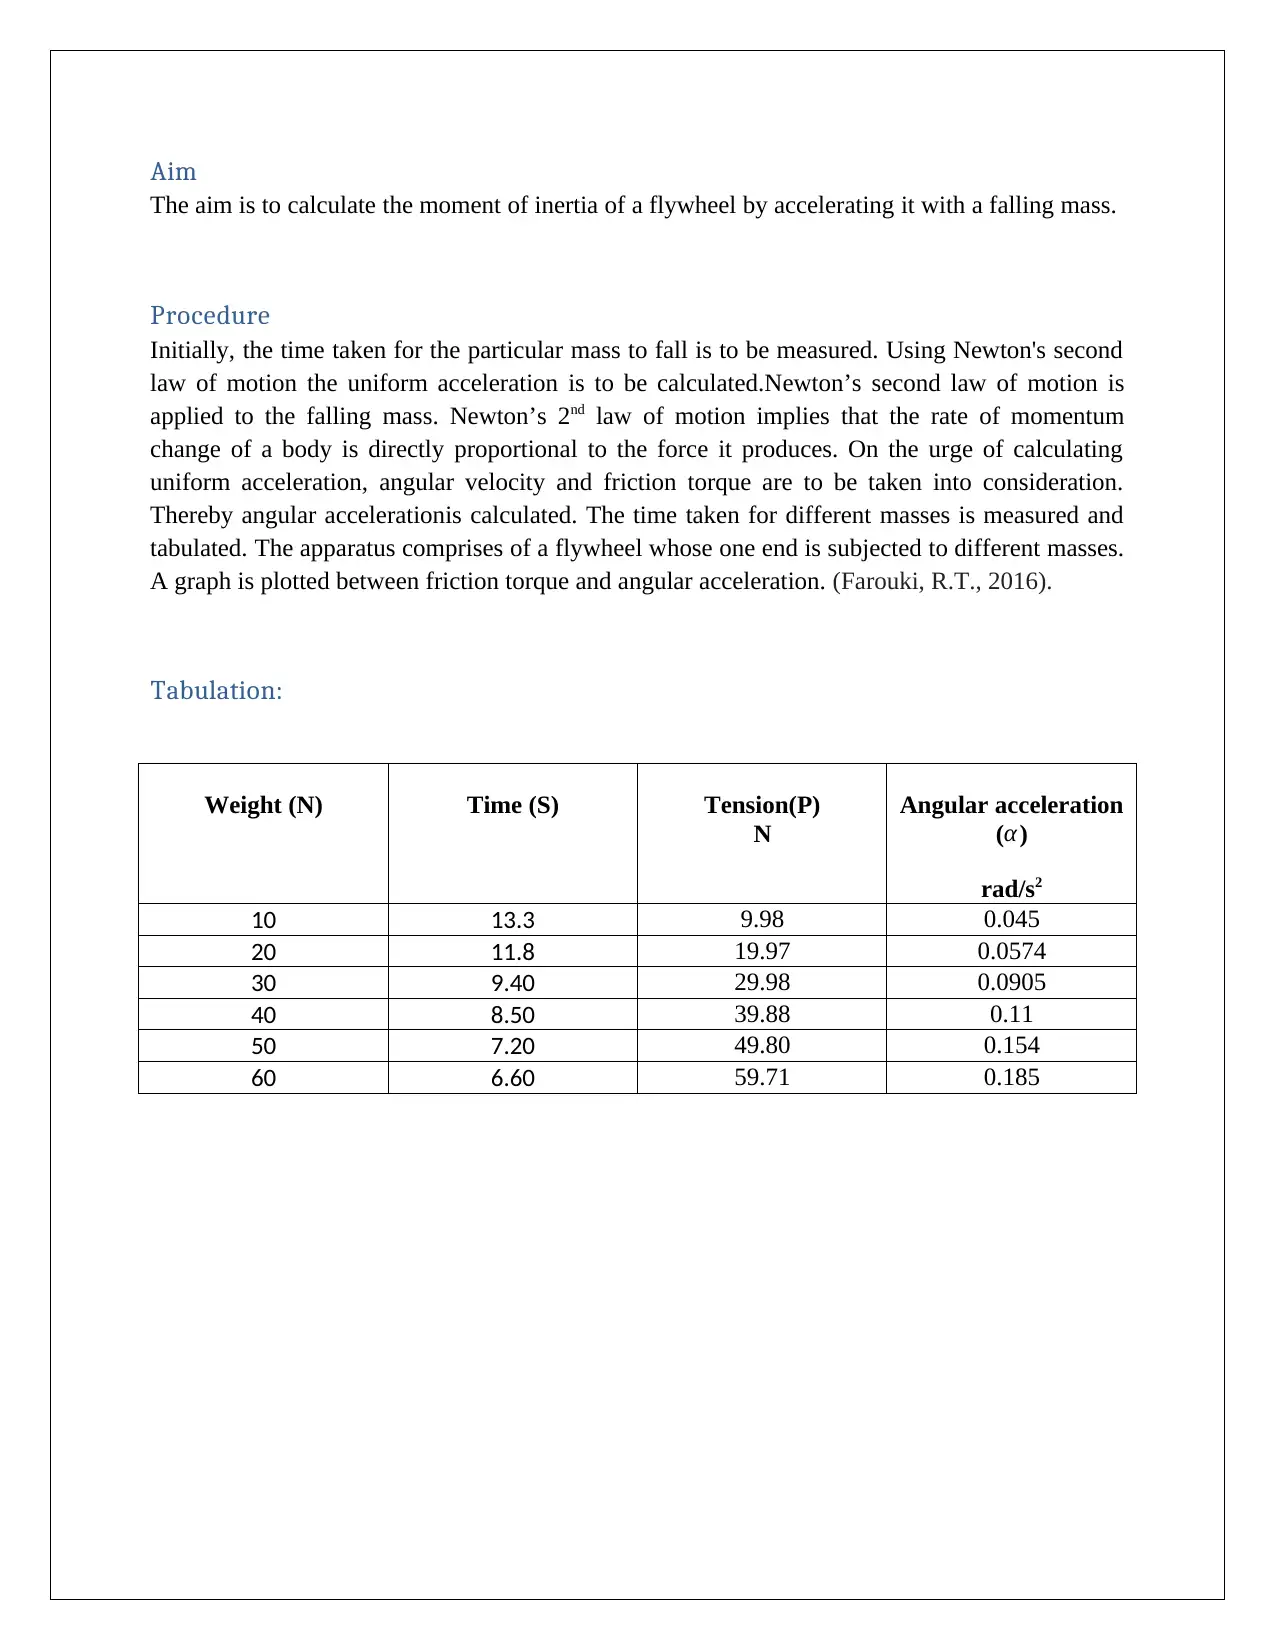
This document presents an experimental analysis of beam stiffness and flywheel inertia. The first experiment focuses on determining the stiffness of aluminum, brass, and steel beams by measuring deflection under various loads and calculating stiffness using the ratio of load to deflection. Graphs are plotted to visualize the relationship between deflection and a derived parameter. The second experiment aims to calculate the moment of inertia of a flywheel by observing its acceleration when subjected to a falling mass. Newton's second law of motion is applied, and calculations involve determining uniform acceleration, angular velocity, and friction torque. The results provide average stiffness values for each material and the calculated moment of inertia for the flywheel. Desklib offers a wealth of similar solved assignments and past papers to aid students in their studies.
Document Page
Experimental Analysis
Contents
Experiment 1...............................................................................................................................................2
Aim..........................................................................................................................................................3
Formula...................................................................................................................................................3
Procedure................................................................................................................................................3
Observations:..........................................................................................................................................4
Graph.......................................................................................................................................................5
Tabulation................................................................................................................................................5
Graph.......................................................................................................................................................7
Tabulation................................................................................................................................................7
Graph.......................................................................................................................................................8
Result.......................................................................................................................................................9
Experiment2..............................................................................................................................................10
ABSTRACT..............................................................................................................................................10
Aim........................................................................................................................................................11
Procedure..............................................................................................................................................11
Tabulation:............................................................................................................................................11
Graph.....................................................................................................................................................12
Calculation.............................................................................................................................................12
Result.....................................................................................................................................................14
Reference..................................................................................................................................................15
tabler-icon-diamond-filled.svg

Paraphrase This Document

Need a fresh take? Get an instant paraphrase of this document with our AI Paraphraser
Document Page
Experiment 1
ABSTRACT
When a spring, a beam or a shaft is subjected to external forces due to their elastic nature they
liberate a vibratory motion. The aim behind this experimentation is to study the transverse
vibration of a simply supported beam when subjected to a load acting at the centre of the beam.
The experimental setup comprises of supports were the beam is to be fixed with the help of
trunnion bearings. The beam is fixed in the slots with the help of the trunnion bearings and
tightened. Loads are applied centrally on the beam. Due to Application of load the beam begins
to deflect. The deflection is measured with the help of a dial indicator. The main objective of the
experiment is to determine the stiffness of different materials under subjected load.Stiffness is an
important property for many applications of materials. The stiffness of a material depends on the
properties of the material and the amount of load applied on the material. By definition, stiffness
is defined as the ratio between load and deflection. (Bahaloo, H., et.al, 2016)
Document Page
Aim
The aim of this experiment is to determine the stiffness of different materials when subjected to a
definite load.
Formula
Stiffness k = W/δ
Deflection δ= W l3
48 EI
Moment of inertia I = b d3
12
Procedure
A beam of dimensions 9.5 mm ×3 mm is employed for the determination of stiffness. The beam
employed is made of aluminium. It is fixed to the supports with the help of trunnion bearings and
tightened. On application of load, the beam starts to deflection. The load applied is in terms of
100g and the deflection is calculated. The deflection is measured using the dial indicator. The
values are tabulated and the stiffness of the material is calculated. Similarly, beams of different
materials are employed mainly mild steel and brass and their respective stiffness is calculated. A
graph is plotted between load and deflection for all the three materials and the values are
tabulated (Gutowski, P. and Leus, M., 2015).
Document Page
Observations:
Beam modulus
Load
applied(Grams)
Weight in
Newton(W)
N
Deflection in
millimeters
Deflectionδ
(m) 48 δI
L3
0 0 0 0 0
100 1 0.60 6.0x10⁻⁴ 1.32x10⁻¹¹
200 2 1.20 12.0x10⁻⁴ 2.64x10⁻¹¹
300 3 1.71 17.1x10⁻⁴ 3.76x10⁻¹¹
400 4 2.30 23.0x10⁻⁴ 5.10x10⁻¹¹
500 5 2.80 28.0x10⁻⁴ 6.16x10⁻¹¹
Material: Aluminum
Beam size : I =2.14x10⁻¹¹ m4
Stiffness k = W/ δ
δ1=0
δ2= W l3
48 EI = 1(1)3/48(69x109)
δ2=3.0193 ×10⁹m
tabler-icon-diamond-filled.svg

Paraphrase This Document

Need a fresh take? Get an instant paraphrase of this document with our AI Paraphraser
Document Page
δ 3= W l3
48 EI = 2(1)3/48(69x109)
δ3=6.0386 ×10⁹m
δ4 = W l3
48 EI = 3(1)3/48(69x109)
δ 4 =9.057 ×10⁹m
δ 5= W l3
48 EI = 4(1)3/48(69x109)
δ5=12.077 ×10⁹m
δ 6= W l3
48 EI = 5(1)3/48(69x109)
δ6=15.0966 ×10⁹m
Stiffness k = W/δ
Average stiffness k=1.1039×10¹⁰ N /m
Graph
Document Page
Plotted between Deflection (δ) and 48 δI / L3
Tabulation
Modulus of beam.
Load
applied(Grams)
Weight in
Newton(W)
N
Deflection in
millimeters
Deflectionδ
(m) 48 δI
L3
0 0 0 0 0
100 1 0.36 3.6x10⁻⁴ 0.80x10⁻¹¹
200 2 0.72 7.2x10⁻⁴ 1.58x10⁻¹¹
300 3 1.10 11.0x10⁻⁴ 2.42x10⁻¹¹
400 4 1.43 14.3x10⁻⁴ 3.15x10⁻¹¹
500 5 1.77 17.7x10⁻⁴ 3.90x10⁻¹¹
Material: Brass
Beam size : I =2.14x10⁻¹¹ m4
δ1=0
δ2= W l3
48 EI = 1(1)3/48(105x109)
Document Page
δ2=1.984 ×10¹¹m
δ 3= W l3
48 EI = 2(1)3/48(105x109)
δ3=3.968 ×10⁹m
δ 4 = W l3
48 EI = 3(1)3/48(105x109)
δ 4 =5.952×10⁹m
δ 5= W l3
48 EI = 4(1)3/48(105x109)
δ5=7.936 ×10⁹m
δ 6= W l3
48 EI = 5(1)3/48(105x109)
δ6=9.92 ×10⁹m
Average stiffness k=1.680×10¹⁰ N /m
tabler-icon-diamond-filled.svg

Paraphrase This Document

Need a fresh take? Get an instant paraphrase of this document with our AI Paraphraser
Document Page
Graph
Plotted between Deflection ( δ) and 48 δI / L3
Tabulation
Modulus of beam
Load
applied(Grams)
Weight in
Newton(W)
N
Deflection in
millimeters
Deflectionδ
(m) 48 δI
L3
0 0 0 0 0
100 1 0.19 1.9x10⁻⁴ 0.42x10⁻¹¹
200 2 0.37 3.7x10⁻⁴ 0.81x10⁻¹¹
300 3 0.54 5.4x10⁻⁴ 1.20x10⁻¹¹
400 4 0.75 7.5x10⁻⁴ 1.70x10⁻¹¹
500 5 0.95 9.5x10⁻⁴ 2.10x10⁻¹¹
Material: Steel
Beam size : I =2.14x10⁻¹¹ m4
δ1=0
Document Page
δ2= W l3
48 EI = 1(1)3/48(200x109)
δ2=1.042 ×10⁹m
δ 3= W l3
48 EI = 2(1)3/48(200x109)
δ3=2.083 ×10⁹m
δ 4 = W l3
48 EI = 3(1)3/48(105x109)
δ 4 =3.125× 10⁹m
δ 5= W l3
48 EI = 4(1)3/48(105x109)
δ5=4.167× 10⁹m
δ 6= W l3
48 EI = 5(1)3/48(105x109)
δ6=5.208 ×10⁹m
Average stiffness k=3.198×10¹⁰ N /m
Document Page
Graph
Plotted between Deflection (δ) and 48 δI / L3
tabler-icon-diamond-filled.svg

Paraphrase This Document

Need a fresh take? Get an instant paraphrase of this document with our AI Paraphraser
Document Page
Result
The average stiffness of the beam made of Aluminum = k=1.1039 ×10¹⁰ N /m
The average stiffness of the beam made of Brass =k=1.680×10¹⁰ N /m
The average stiffness of the beam made of Steel =k=3.198×10¹⁰ N /m
Experiment2
ABSTRACT
Theinability of a body in rest or motion to change its state by itself is termed as inertia. The main
objective of this experimentation is to calculate the moment of inertia of a flywheel when
subjected to a mass pulling it downwards. The Inertial moment of a body is defined as the
tendency of the body to resist angular acceleration. In this experiment, the moment of inertia of
the flywheel is calculated by considering it as a solid steel disc. Newton's 2ndlaw of motion is
applied to the falling mass. Uniform acceleration is to be calculated the three equations of motion
are to be taken into account.
Document Page
Aim
The aim is to calculate the moment of inertia of a flywheel by accelerating it with a falling mass.
Procedure
Initially, the time taken for the particular mass to fall is to be measured. Using Newton's second
law of motion the uniform acceleration is to be calculated.Newton’s second law of motion is
applied to the falling mass. Newton’s 2nd law of motion implies that the rate of momentum
change of a body is directly proportional to the force it produces. On the urge of calculating
uniform acceleration, angular velocity and friction torque are to be taken into consideration.
Thereby angular accelerationis calculated. The time taken for different masses is measured and
tabulated. The apparatus comprises of a flywheel whose one end is subjected to different masses.
A graph is plotted between friction torque and angular acceleration. (Farouki, R.T., 2016).
Tabulation:
Weight (N) Time (S) Tension(P)
N
Angular acceleration
(α )
rad/s2
10 13.3 9.98 0.045
20 11.8 19.97 0.0574
30 9.40 29.98 0.0905
40 8.50 39.88 0.11
50 7.20 49.80 0.154
60 6.60 59.71 0.185
chevron_up_icon
1 out of 16
circle_padding
hide_on_mobile
zoom_out_icon
[object Object]