Becoming an Economist: Japan's Economic Performance Analysis Report

Verified

Added on  2022/10/01

|11
|1181
|125
Report
AI Summary
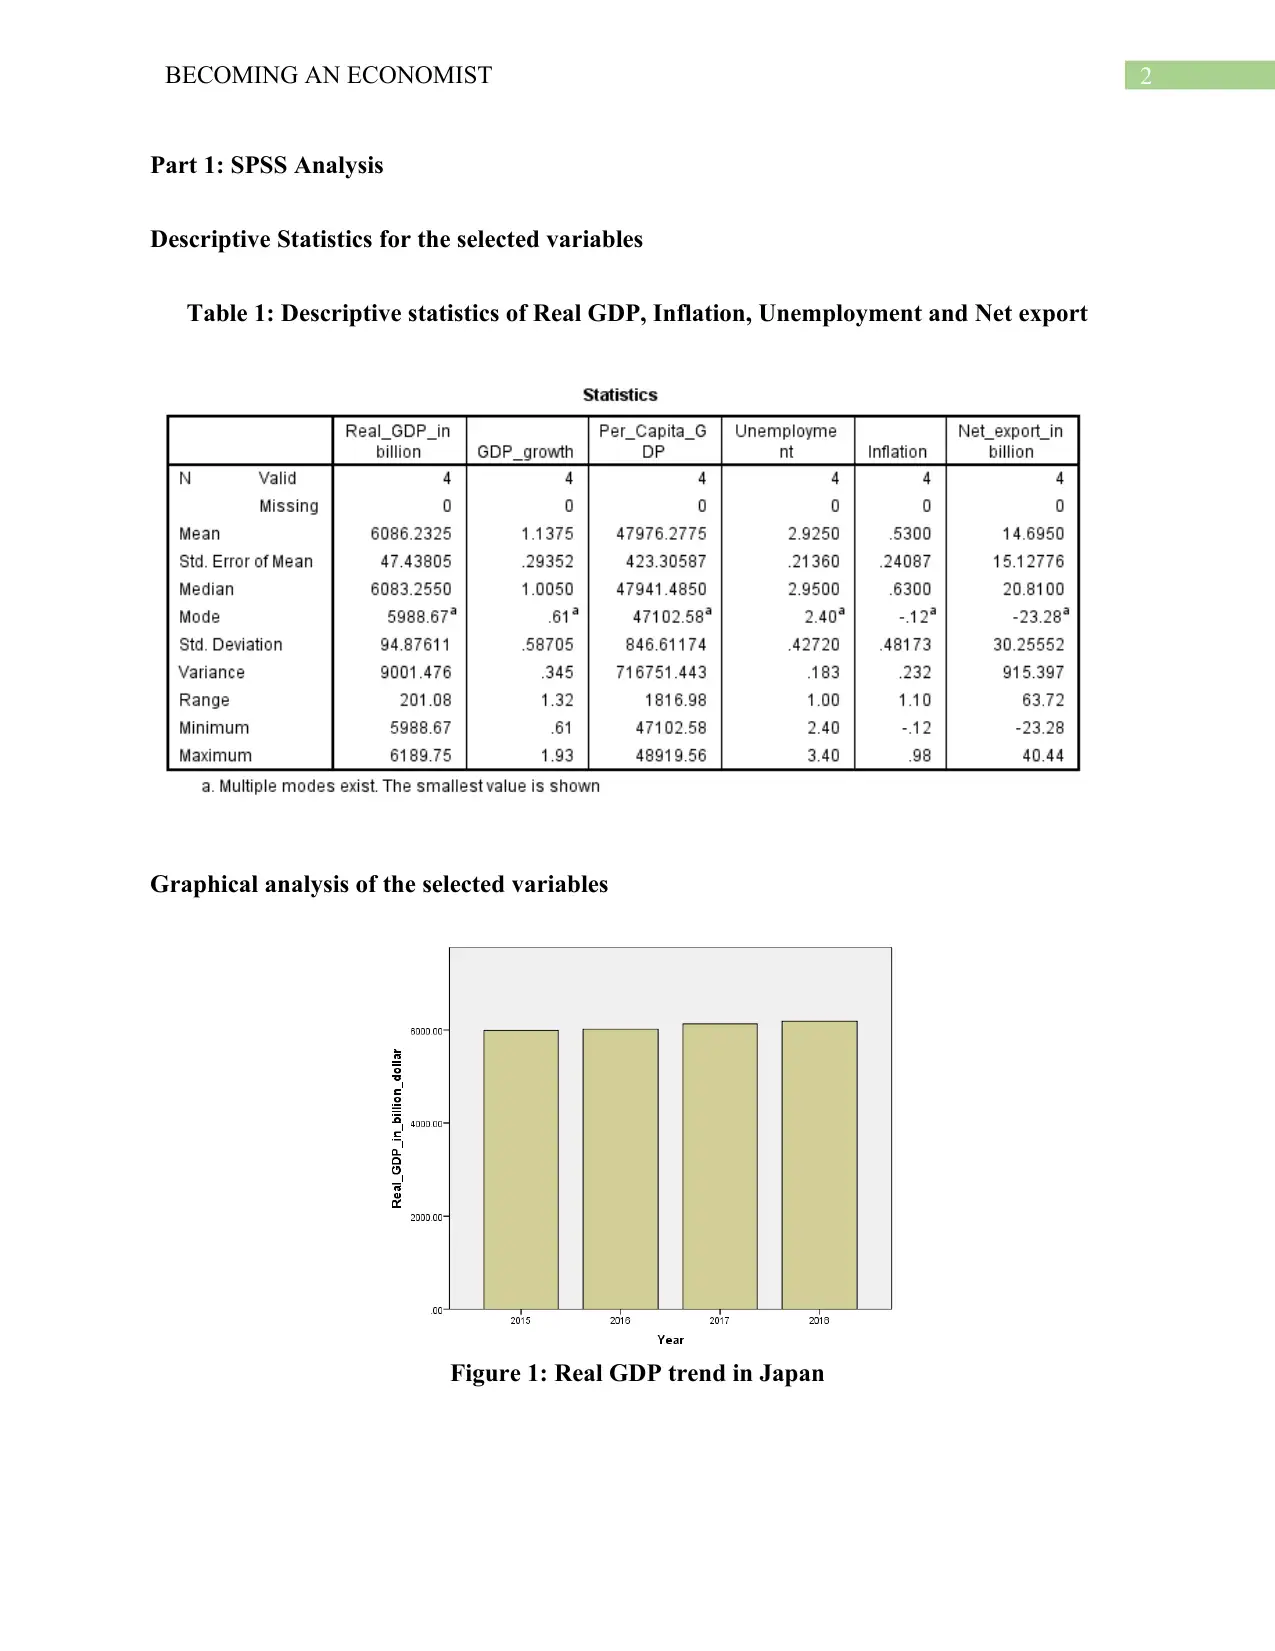
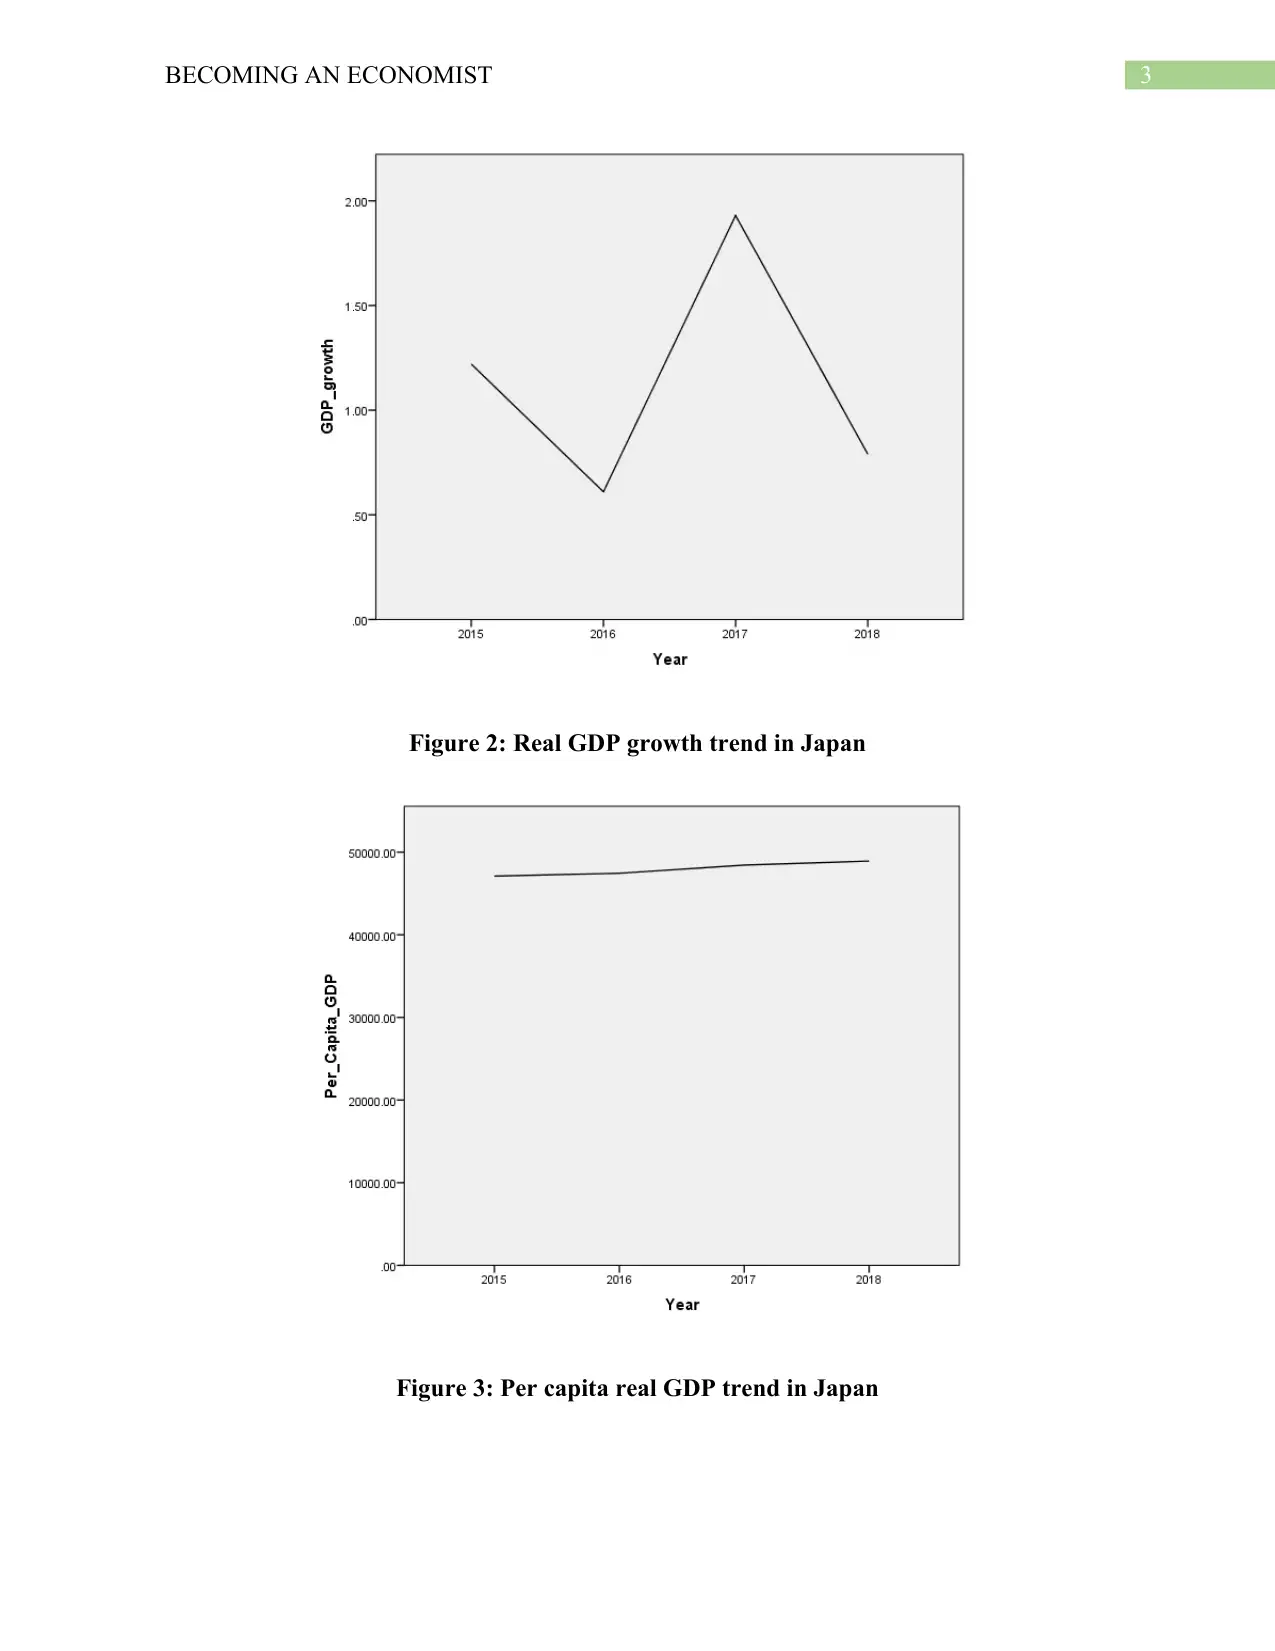
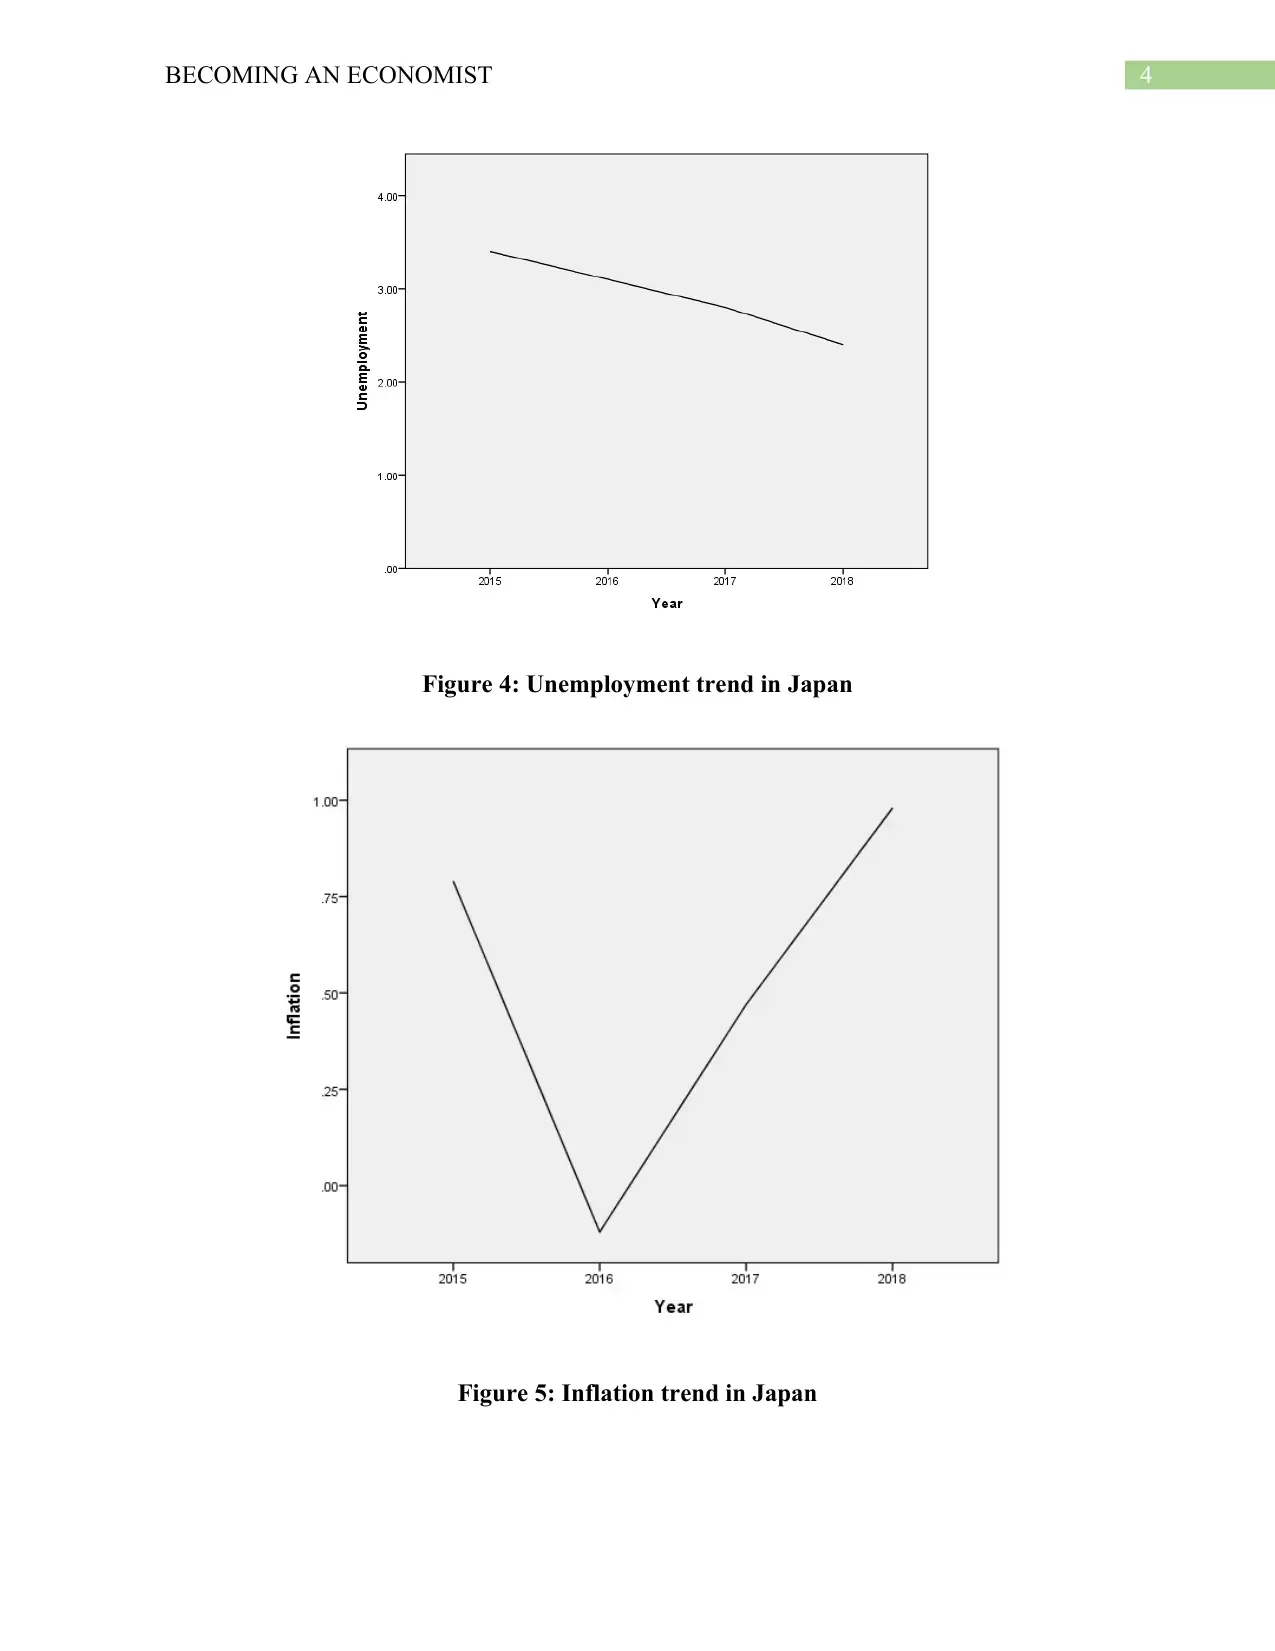
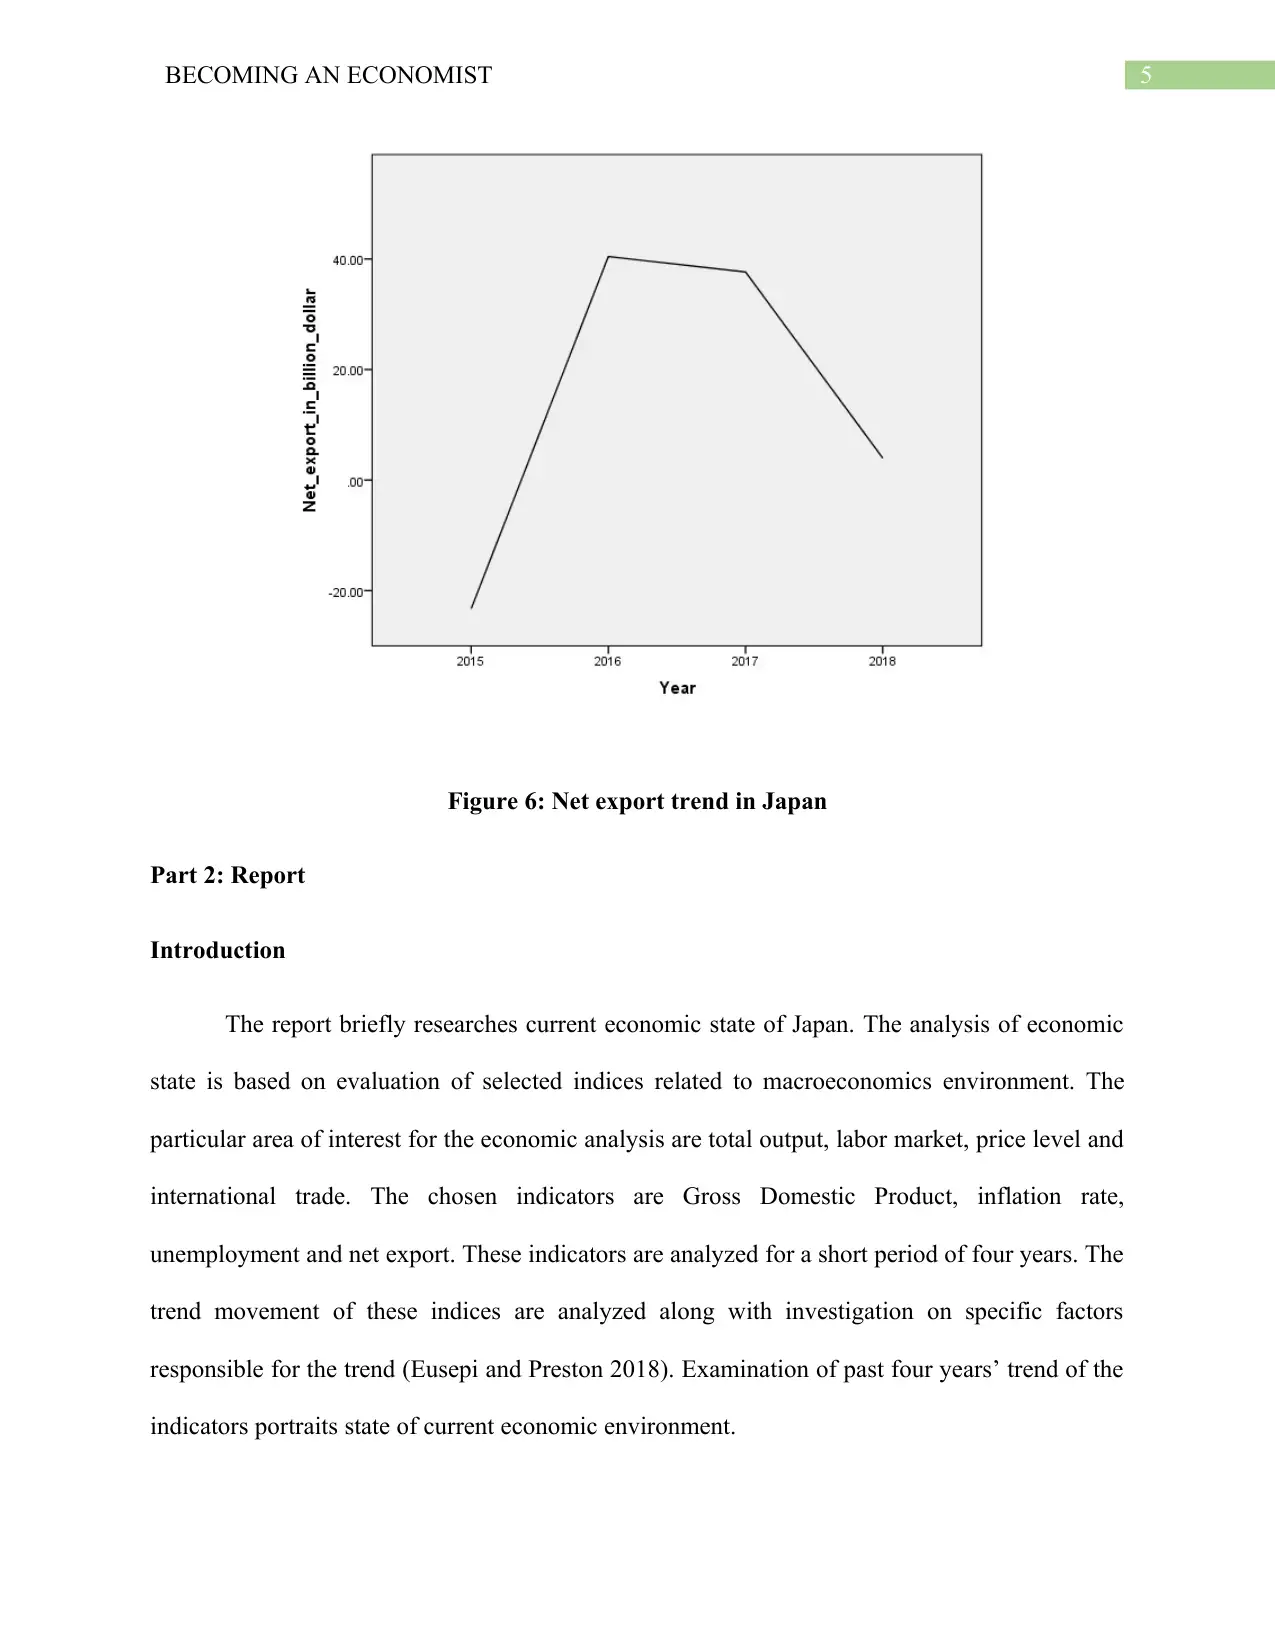
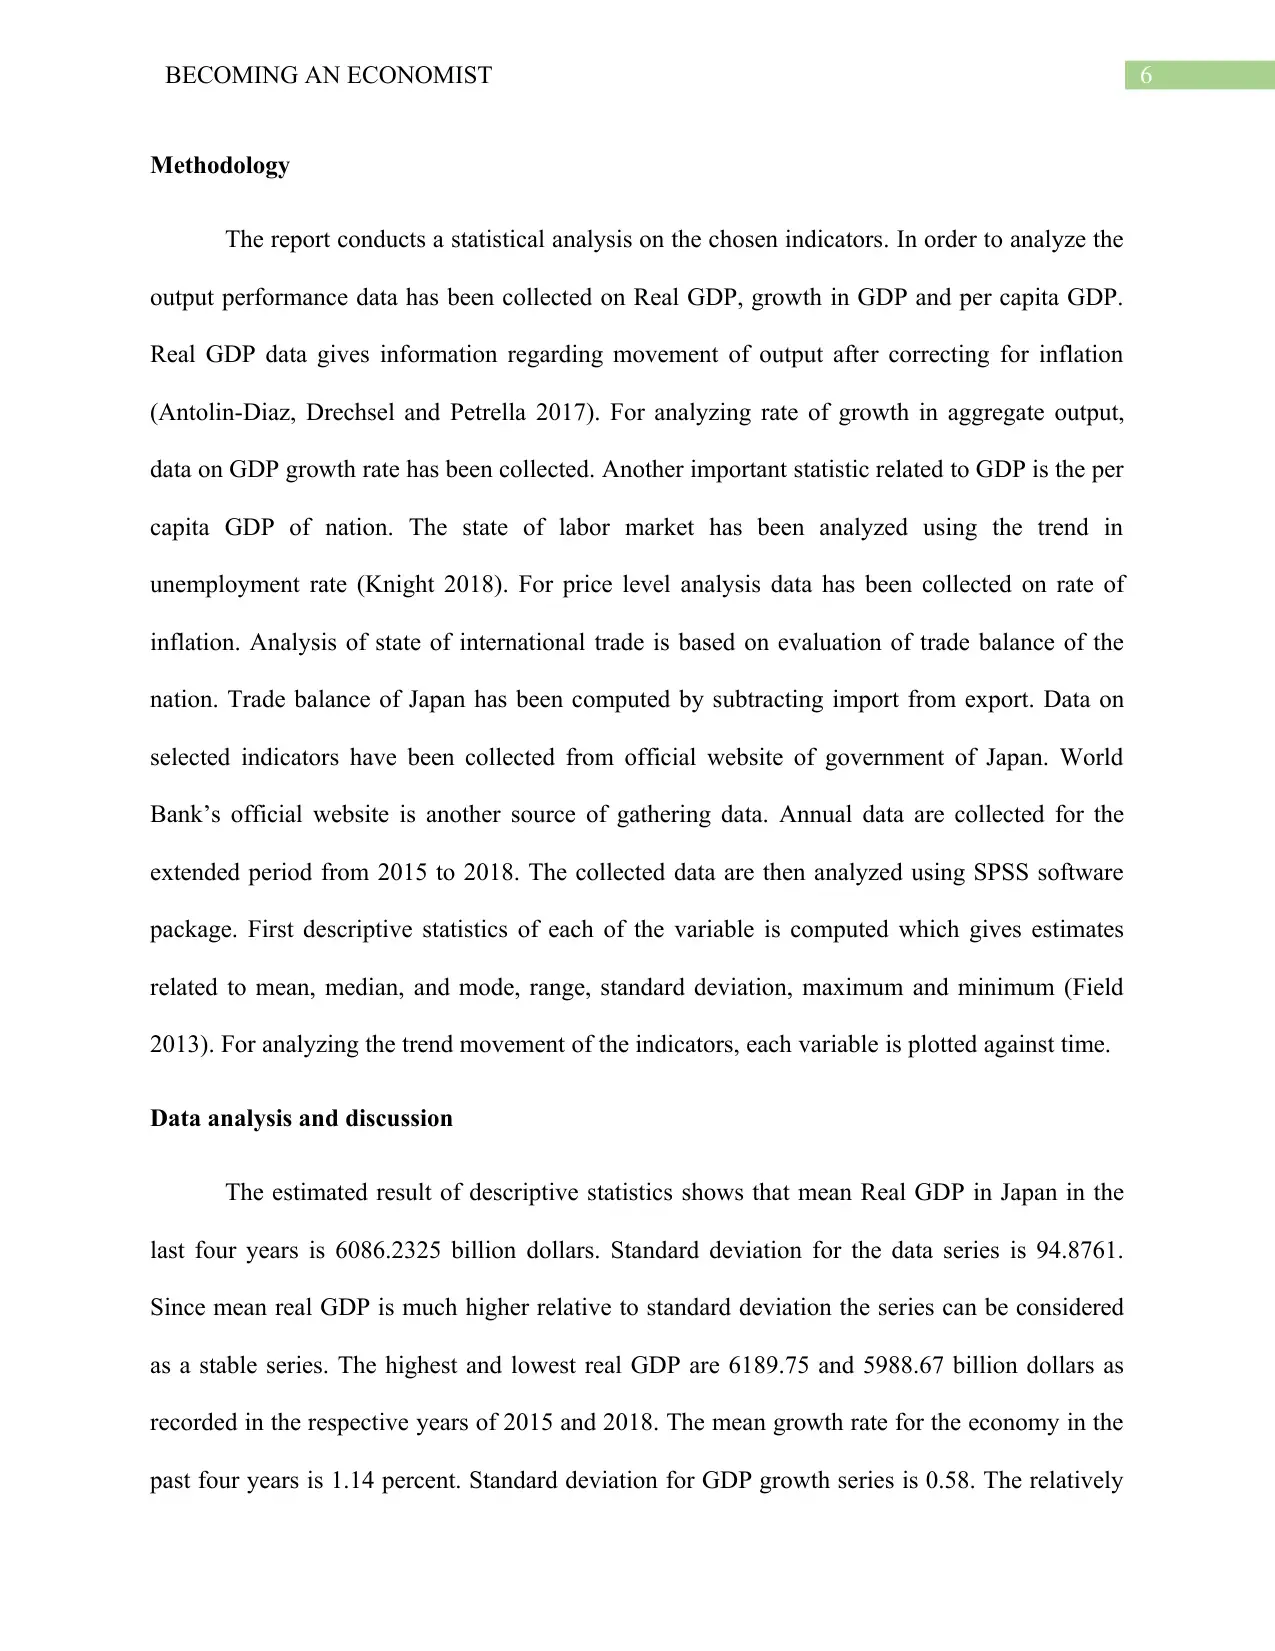
This report presents an economic analysis of Japan's macroeconomic performance from 2015 to 2018. It investigates key economic indicators, including Real GDP, inflation, unemployment, and net exports, utilizing SPSS software for statistical analysis. The report includes descriptive statistics and graphical analysis to examine trends and fluctuations in these indicators. The introduction outlines the scope, focusing on total output, labor market, price levels, and international trade. The methodology details data collection from government and World Bank sources, followed by SPSS analysis to compute descriptive statistics and trend movements. The data analysis reveals trends in GDP, growth rates, per capita GDP, unemployment, inflation, and trade balance, discussing factors influencing these trends, such as business spending, global growth, trade tensions, and fiscal policies. The report concludes with a summary of Japan's economic performance, noting steady GDP growth, recent declines in economic growth rate, low inflation, and a recent fall in trade balance. References to relevant economic literature are included.
tabler-icon-diamond-filled.svg

Contribute Materials

Your contribution can guide someone’s learning journey. Share your documents today.
Document Page
Running head: BECOMING AN ECONOMIST
Becoming an Economist
Name of the Student
Name of the University
Course ID
tabler-icon-diamond-filled.svg

Secure Best Marks with AI Grader

Need help grading? Try our AI Grader for instant feedback on your assignments.
Document Page
1BECOMING AN ECONOMIST
Table of Contents
Part 1: SPSS Analysis......................................................................................................................2
Descriptive Statistics for the selected variables...........................................................................2
Graphical analysis of the selected variables................................................................................2
Part 2: Report...................................................................................................................................5
Introduction..................................................................................................................................5
Methodology................................................................................................................................6
Data analysis and discussion.......................................................................................................6
Conclusion...................................................................................................................................8
References........................................................................................................................................9
Document Page
2BECOMING AN ECONOMIST
Part 1: SPSS Analysis
Descriptive Statistics for the selected variables
Table 1: Descriptive statistics of Real GDP, Inflation, Unemployment and Net export
Graphical analysis of the selected variables
Figure 1: Real GDP trend in Japan
Document Page
3BECOMING AN ECONOMIST
Figure 2: Real GDP growth trend in Japan
Figure 3: Per capita real GDP trend in Japan
tabler-icon-diamond-filled.svg

Secure Best Marks with AI Grader

Need help grading? Try our AI Grader for instant feedback on your assignments.
Document Page
4BECOMING AN ECONOMIST
Figure 4: Unemployment trend in Japan
Figure 5: Inflation trend in Japan
Document Page
5BECOMING AN ECONOMIST
Figure 6: Net export trend in Japan
Part 2: Report
Introduction
The report briefly researches current economic state of Japan. The analysis of economic
state is based on evaluation of selected indices related to macroeconomics environment. The
particular area of interest for the economic analysis are total output, labor market, price level and
international trade. The chosen indicators are Gross Domestic Product, inflation rate,
unemployment and net export. These indicators are analyzed for a short period of four years. The
trend movement of these indices are analyzed along with investigation on specific factors
responsible for the trend (Eusepi and Preston 2018). Examination of past four years’ trend of the
indicators portraits state of current economic environment.
Document Page
6BECOMING AN ECONOMIST
Methodology
The report conducts a statistical analysis on the chosen indicators. In order to analyze the
output performance data has been collected on Real GDP, growth in GDP and per capita GDP.
Real GDP data gives information regarding movement of output after correcting for inflation
(Antolin-Diaz, Drechsel and Petrella 2017). For analyzing rate of growth in aggregate output,
data on GDP growth rate has been collected. Another important statistic related to GDP is the per
capita GDP of nation. The state of labor market has been analyzed using the trend in
unemployment rate (Knight 2018). For price level analysis data has been collected on rate of
inflation. Analysis of state of international trade is based on evaluation of trade balance of the
nation. Trade balance of Japan has been computed by subtracting import from export. Data on
selected indicators have been collected from official website of government of Japan. World
Bank’s official website is another source of gathering data. Annual data are collected for the
extended period from 2015 to 2018. The collected data are then analyzed using SPSS software
package. First descriptive statistics of each of the variable is computed which gives estimates
related to mean, median, and mode, range, standard deviation, maximum and minimum (Field
2013). For analyzing the trend movement of the indicators, each variable is plotted against time.
Data analysis and discussion
The estimated result of descriptive statistics shows that mean Real GDP in Japan in the
last four years is 6086.2325 billion dollars. Standard deviation for the data series is 94.8761.
Since mean real GDP is much higher relative to standard deviation the series can be considered
as a stable series. The highest and lowest real GDP are 6189.75 and 5988.67 billion dollars as
recorded in the respective years of 2015 and 2018. The mean growth rate for the economy in the
past four years is 1.14 percent. Standard deviation for GDP growth series is 0.58. The relatively
tabler-icon-diamond-filled.svg

Paraphrase This Document

Need a fresh take? Get an instant paraphrase of this document with our AI Paraphraser
Document Page
7BECOMING AN ECONOMIST
smaller standard deviation implies that the economy grew almost at a stable rate (Rees 2018).
Highest growth rate for the economy is 1.93 percent accounted in 2017. The slowest growth rate
for the economy is 0.61 percent as accounted in 2016. For per capita GDP, the average estimate
is 47976.2775 dollar. Variation is much smaller as obtained from the smaller standard deviation
of 423.3059. The average unemployment rate of Japan is 2.92 percent which is relatively
smaller. Unemployment rate does not vary as implied from the relatively smaller standard
deviation of 0.4272. The maximum and minimum unemployment rate are 3.40 percent and 2.40
percent recorded in the consecutive years of 2015 and 2018. Average rate of inflation in Japan is
0.53 which is much lower than the targeted rate of 2 percent. The price level analysis shows that
highest and lowest inflation rate are respectively 0.98 percent and -0.12 percent. Average trade
balance of Japan for the past four years is 14.6950. Trade balance fluctuated rapidly as observed
from the relatively larger standard deviation of 30. 2555. The accounted highest and lowest trade
balance are 40.44 and -23.28 billion dollars.
Although real GDP of Japan increased steadily, economic growth rate however fluctuated
for various reasons. Economic growth in Japan contracted in 2018 because of contraction in
business spending. Fall in global growth and trade tensions hamper the economic growth of
Japan. The rapid economic expansion of Japan helped the nation to go beyond the full
employment level. The fiscal stimulus and structural reforms contributed to a sharp fall in
unemployment rate. Despite the policy of quantitative easing and considerably low interest rate
inflation in Japan is at significantly low level. This is mainly due to low demand following a low
wage and decline in population growth (Porcellacchia 2016). Trade tension between United
States and China adversely affected trade position in Japan as observed from a decline in trade
balance.
Document Page
8BECOMING AN ECONOMIST
Document Page
9BECOMING AN ECONOMIST
Conclusion
The analysis of Japan’s macroeconomic performance shows that real GDP in Japan has
increased steadily. There is a recent decline in the rate of economic growth due to contraction in
business investment. Despite a strong labor market performance inflation rate remained at a low
level. Finally, analysis of international trade through net export shows a recent fall in trade
balance as a result of US-China trade war.
tabler-icon-diamond-filled.svg

Secure Best Marks with AI Grader

Need help grading? Try our AI Grader for instant feedback on your assignments.
Document Page
10BECOMING AN ECONOMIST
References
Antolin-Diaz, J., Drechsel, T. and Petrella, I., 2017. Tracking the slowdown in long-run GDP
growth. Review of Economics and Statistics, 99(2), pp.343-356.
Eusepi, S. and Preston, B., 2018. Fiscal foundations of inflation: imperfect knowledge. American
Economic Review, 108(9), pp.2551-89.
Field, A., 2013. Discovering statistics using IBM SPSS statistics. sage.
Knight, K.G., 2018. Unemployment: an economic analysis. Routledge.
Porcellacchia, D., 2016. Wage-price dynamics and structural reforms in Japan. International
Monetary Fund.
Rees, D.G., 2018. Essential statistics. Chapman and Hall/CRC.
chevron_up_icon
1 out of 11
circle_padding
hide_on_mobile
zoom_out_icon
logo.png

Your All-in-One AI-Powered Toolkit for Academic Success.

Available 24*7 on WhatsApp / Email

[object Object]