Principles of Economics Assignment: Beer and Labour Market Analysis
VerifiedAdded on 2022/11/28
|12
|2328
|417
Homework Assignment
AI Summary
This economics assignment delves into the principles of economics by analyzing the beer and labour markets. The assignment begins by comparing beer consumption patterns between Australia and the United States, discussing the best measures for effective comparison and exploring the factors influencing consumption differences, including population, income levels, and government regulations. It then examines the price elasticity of beer demand, considering factors that affect it. The assignment also includes a graphical representation of excise tax on beer. The second part of the assignment focuses on the labour market, defining and differentiating between wage growth and real wage growth. It analyzes wage growth trends in Australia and the United States, and explores the effects of minimum wage laws, including the impact on foreign students. The assignment utilizes data and figures to support its analysis, providing a comprehensive overview of key economic concepts and their real-world applications. The assignment demonstrates the student's understanding of economic principles through market analysis and policy implications.
Running head: Principles of Economics
Principles of Economics
Name of the Student
Name of the University
Student ID
Principles of Economics
Name of the Student
Name of the University
Student ID
Paraphrase This Document
Need a fresh take? Get an instant paraphrase of this document with our AI Paraphraser
1
Principles of Economics
Table of Contents
Beer Market.......................................................................................................................2
Answer 1........................................................................................................................2
Answer 2........................................................................................................................2
Answer 3........................................................................................................................2
Answer 4........................................................................................................................3
Answer 5........................................................................................................................4
Answer 6........................................................................................................................4
Labour Market....................................................................................................................5
Answer 1........................................................................................................................5
Answer 2........................................................................................................................5
Answer 3........................................................................................................................6
Answer 4........................................................................................................................7
References.........................................................................................................................8
2
Principles of Economics
Beer Market
Answer 1
In 2016, Australians consumed 173500 kilo litres of beer and was ranked at 24
based on total consumption of beer in that year. The other country that is being
considered for comparison with Australia is the United States. The United States was
ranked at 2nd position based on beer consumption in 2016. Total beer consumed by the
people of the United States in 2016 was recorded 24245000 kilo litres. After,
considering per capita consumption of beer it is observed that Australia is ranked at 23
and the United States at 21. The per capita consumption of Australia was 71.4 litres and
that of the United States was 74.8 litres (Kirinholdings.co.jp 2019). Thus, in total
consumption data that disparity in amount of consumption was due to the difference in
population between the two countries. However, in the case of per capita consumption
more detailed information about the patterns of beer consumption can be gathered.
Therefore, per capita consumption is the best measure to compare consumption
patterns of the two countries.
Answer 2
Australia and the United States are two different countries with different climatic
conditions. Population of the United States is much higher than Australia, nearly 15
times. Thus, if only total consumption is considered then consideration of absolute data
is suitable because it will reflect the total demand of beer generated by both the United
States and Australia. However, to understand individual demand of beer it is better to
consider per capita consumption of beer. In addition, if data on consumption of beer for
last five or ten years is considered then the trend of beer consumption for both the
countries can be understood (Livingston and Dietze 2016). Thus, the factors that
explains the difference in beer consumption between the two countries are population,
level of income, regional climatic conditions, personal preferences and government
rules against beer or alcohol consumption and the price of beer in the respective
countries.
⊘ This is a preview!⊘
Do you want full access?
Subscribe today to unlock all pages.
Trusted by 1+ million students worldwide
3
P
PT
Price D
S
Quantity
Q
T Q
Principles of Economics
Answer 3
Beer is an alcoholic beverage and is addictive, thus it is considered as a demerit
good. In case of demerit goods the price elasticity of demand is very inelastic and with
increase in price alteration in quantity demanded for beer is proportionately low. The
addictive nature of beer is the main factor the impacts the price elasticity of demand of
the product (Musolino 2015). The other factors that imact the price elasticity of demand
of beer are availability of substitute beverages and their price, health issues related to
beer and its substitutes, income level of the customer and the preference of alcoholic
drinks. Hence, all these factors are effective in impacting the price elasticity of demand
but it varies widely with the taste of customer.
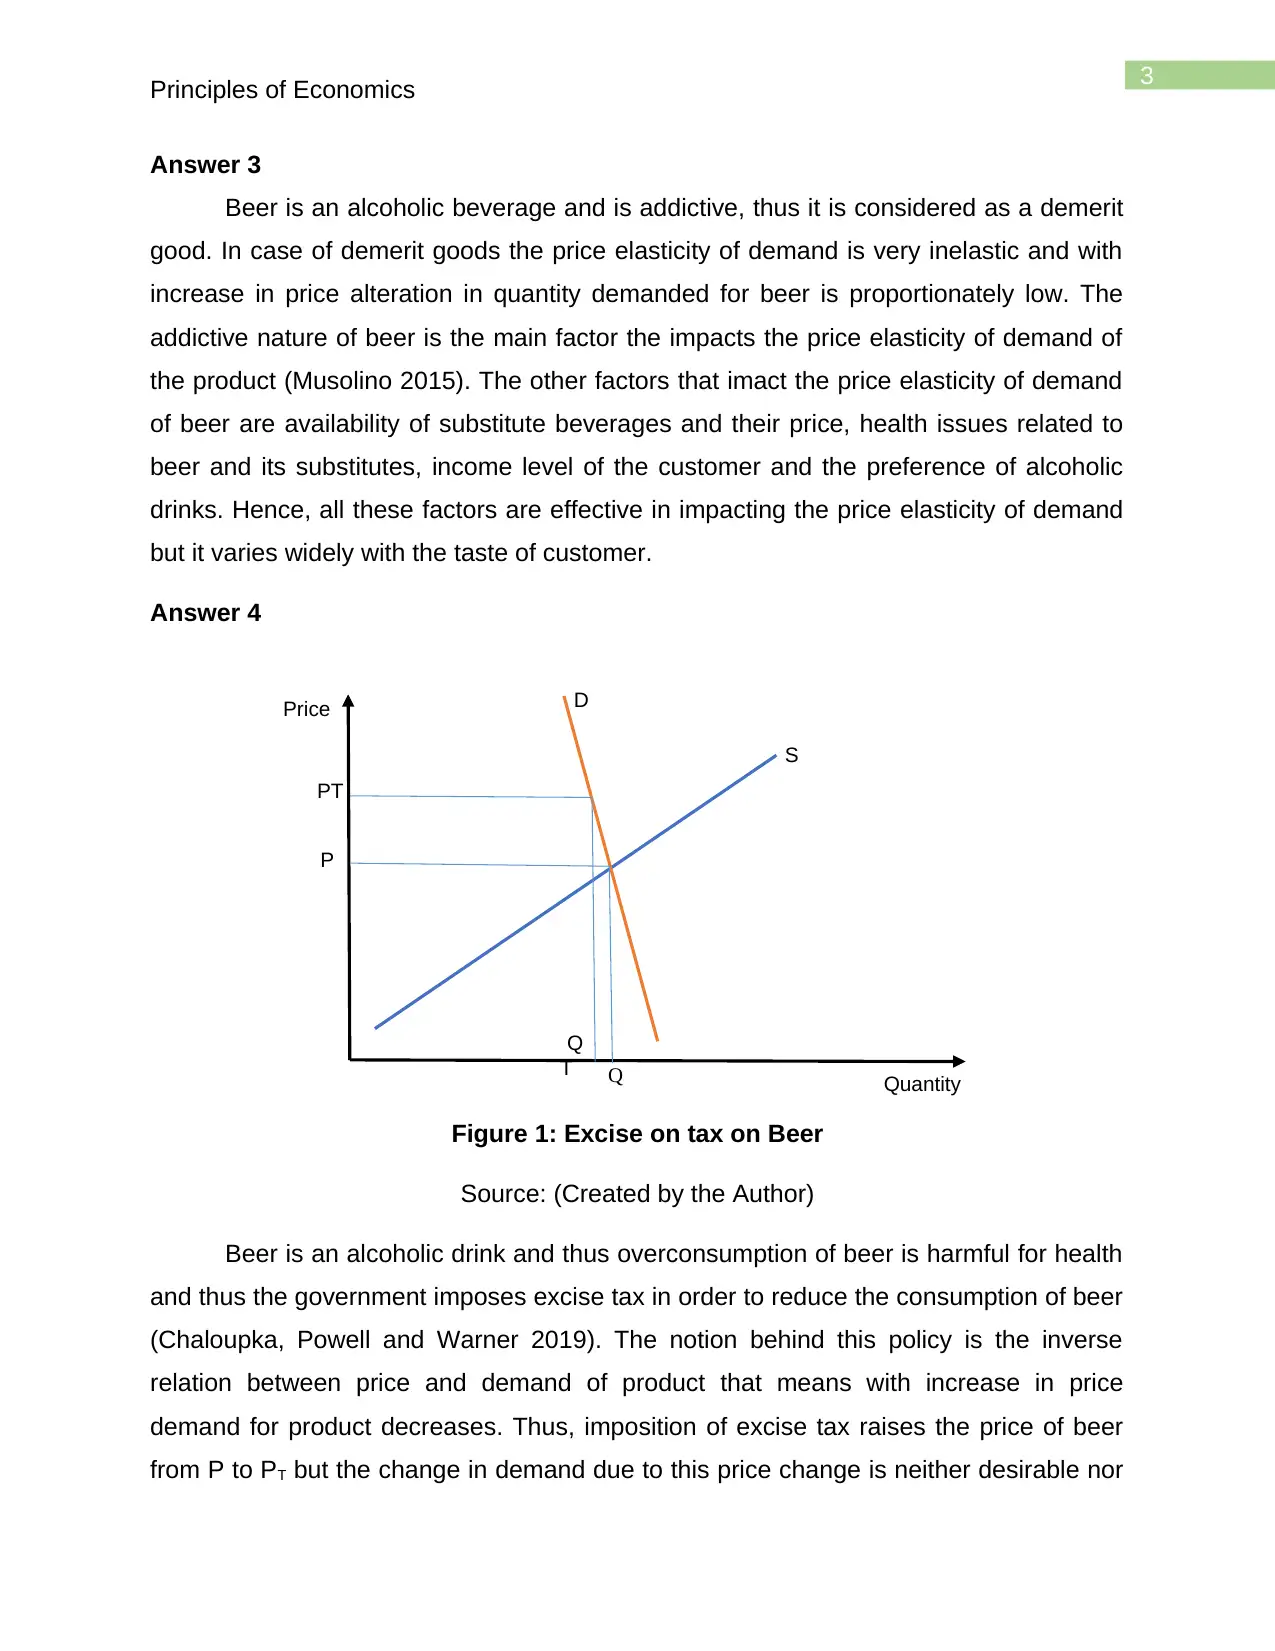
Answer 4
Figure 1: Excise on tax on Beer
Source: (Created by the Author)
Beer is an alcoholic drink and thus overconsumption of beer is harmful for health
and thus the government imposes excise tax in order to reduce the consumption of beer
(Chaloupka, Powell and Warner 2019). The notion behind this policy is the inverse
relation between price and demand of product that means with increase in price
demand for product decreases. Thus, imposition of excise tax raises the price of beer
from P to PT but the change in demand due to this price change is neither desirable nor
P
PT
Price D
S
Quantity
Q
T Q
Principles of Economics
Answer 3
Beer is an alcoholic beverage and is addictive, thus it is considered as a demerit
good. In case of demerit goods the price elasticity of demand is very inelastic and with
increase in price alteration in quantity demanded for beer is proportionately low. The
addictive nature of beer is the main factor the impacts the price elasticity of demand of
the product (Musolino 2015). The other factors that imact the price elasticity of demand
of beer are availability of substitute beverages and their price, health issues related to
beer and its substitutes, income level of the customer and the preference of alcoholic
drinks. Hence, all these factors are effective in impacting the price elasticity of demand
but it varies widely with the taste of customer.
Answer 4
Figure 1: Excise on tax on Beer
Source: (Created by the Author)
Beer is an alcoholic drink and thus overconsumption of beer is harmful for health
and thus the government imposes excise tax in order to reduce the consumption of beer
(Chaloupka, Powell and Warner 2019). The notion behind this policy is the inverse
relation between price and demand of product that means with increase in price
demand for product decreases. Thus, imposition of excise tax raises the price of beer
from P to PT but the change in demand due to this price change is neither desirable nor
Paraphrase This Document
Need a fresh take? Get an instant paraphrase of this document with our AI Paraphraser
4
Principles of Economics
significant. This happens because the demand curve of beer is very inelastic due to its
addictive nature (Jawad et al. 2018). Thus, beer is considered as demerit good.
Therefore, the fall in demand is from Q to QT, which is very low for change in demand
causing due to imposition of excise tax. The effect of excise tax is thus negligible and
ineffective in reduction of demand for beer.
Answer 5
Alcohol is an unhealthy beverage and it causes various kind of diseases and
health issues such as obesity, cirrhosis of liver, cholesterol, heart diseases and many
others. Thus, it is really harmful for health. Therefore, a person that consumes alcohol
increases expenses in many ways. Firstly, the cost of alcohol consumption is accrued
by the consumer and with that if any health issue occurs the extra cost of medical
treatment will come as extra burden. These are the monetary cost that a consumer of
alcohol accrues. On the other hand, there is additional health cost because after
occurrence of disease the health will become weak (Davoren et al. 2016). The
government is worried about the alcohol consumption and wishes to reduce alcohol
consumption in the country in order to improve the health of the citizens since health is
directly related to working skill and efficiency. Moreover, reduction of alcohol
consumption will decrease the mortality rate and expenses made in medical sector and
thereby more savings might be generated and welfare of the economy will rise.
Answer 6
In order to reduce the consumption of alcohol the Australian government enacted
various policies other than imposition of tax. The policies are drink driving, legal age for
drinking and restriction on selling alcohol, labelling and restriction on location of
drinking. All these policies are quite effective in reducing consumption of alcohol. Drink
driving restrict drivers from drinking while driving or driving after drinking (de Wit et al.
2017). Restricting age of alcohol consumption decreases the amount of consumption as
before a certain age individuals are not allowed to consume alcohol and violation will
attract state punishment. These are the most effective policies to reduce alcohol
consumption, however, the other policies are also effective as restriction on location
reduces the alcohol consumption as people cannot consume in any places they wish to.

5
Principles of Economics
Thus, the government is successful enough to reduce the consumption of alcohol by
implementing these policies and it seems that these are much more effective than
taxing alcohol consumption.
Principles of Economics
Thus, the government is successful enough to reduce the consumption of alcohol by
implementing these policies and it seems that these are much more effective than
taxing alcohol consumption.
⊘ This is a preview!⊘
Do you want full access?
Subscribe today to unlock all pages.
Trusted by 1+ million students worldwide
6
Principles of Economics
Labour Market
Answer 1
Wage growth is the rise in income of individuals of a country during a certain
period of time. Usually, the period of wage growth is considered a year because in most
of the sectors the rise in wage or salary get revised or increased in an interval of one
year. However, in the growth in wage rate does not consider the change in inflation rate
that means the purchasing power of individuals does not increase by the amount of
increase in wage rate (Verdugo 2016). Thus, to understand the true increase in
purchasing power of individuals it is necessary to find the actual change in wage and is
commonly known as real wage growth. Real wage growth considers the change in
inflation rate and excludes the effect of inflation rate in the growth in wage rate. It can be
thus inferred that the real wage growth reflects the actual increase in purchasing power
of an individual.
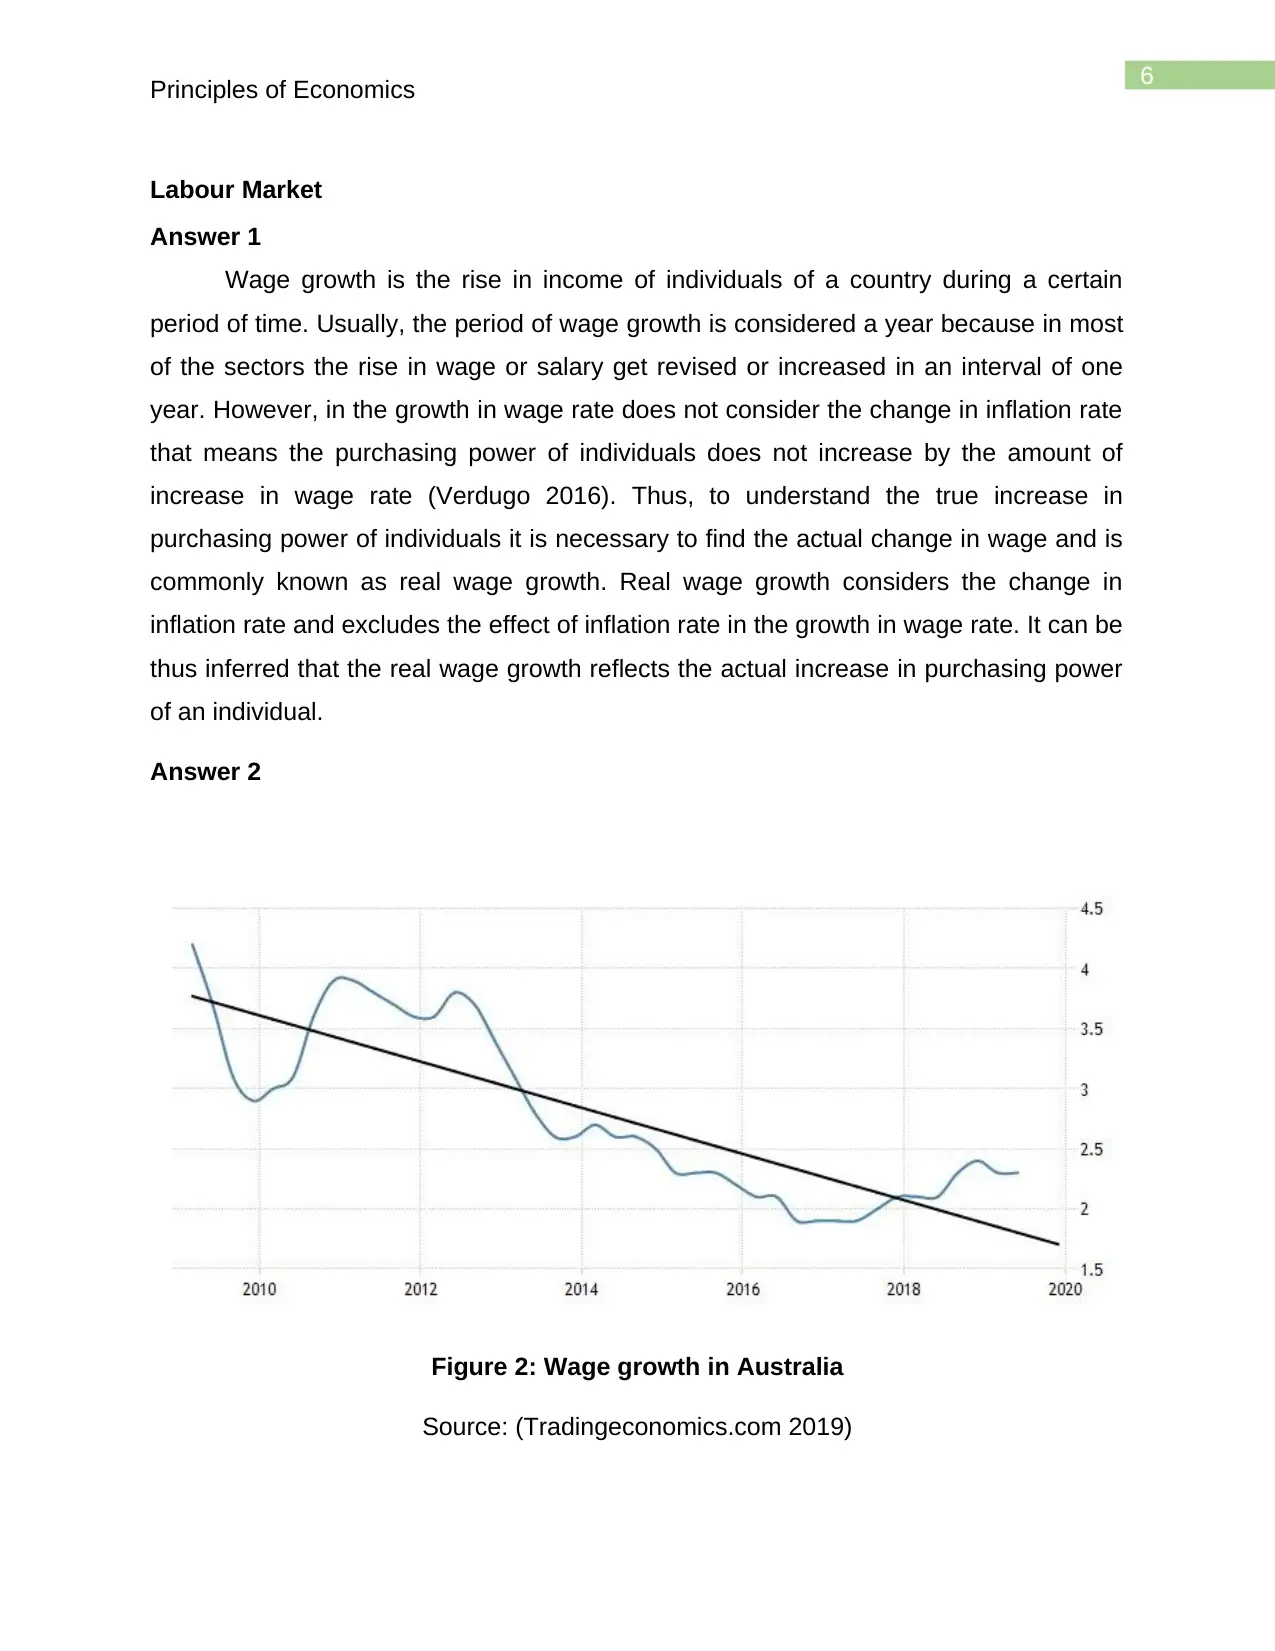
Answer 2
Figure 2: Wage growth in Australia
Source: (Tradingeconomics.com 2019)
Principles of Economics
Labour Market
Answer 1
Wage growth is the rise in income of individuals of a country during a certain
period of time. Usually, the period of wage growth is considered a year because in most
of the sectors the rise in wage or salary get revised or increased in an interval of one
year. However, in the growth in wage rate does not consider the change in inflation rate
that means the purchasing power of individuals does not increase by the amount of
increase in wage rate (Verdugo 2016). Thus, to understand the true increase in
purchasing power of individuals it is necessary to find the actual change in wage and is
commonly known as real wage growth. Real wage growth considers the change in
inflation rate and excludes the effect of inflation rate in the growth in wage rate. It can be
thus inferred that the real wage growth reflects the actual increase in purchasing power
of an individual.
Answer 2
Figure 2: Wage growth in Australia
Source: (Tradingeconomics.com 2019)
Paraphrase This Document
Need a fresh take? Get an instant paraphrase of this document with our AI Paraphraser

7
Principles of Economics
Principles of Economics
8
Principles of Economics
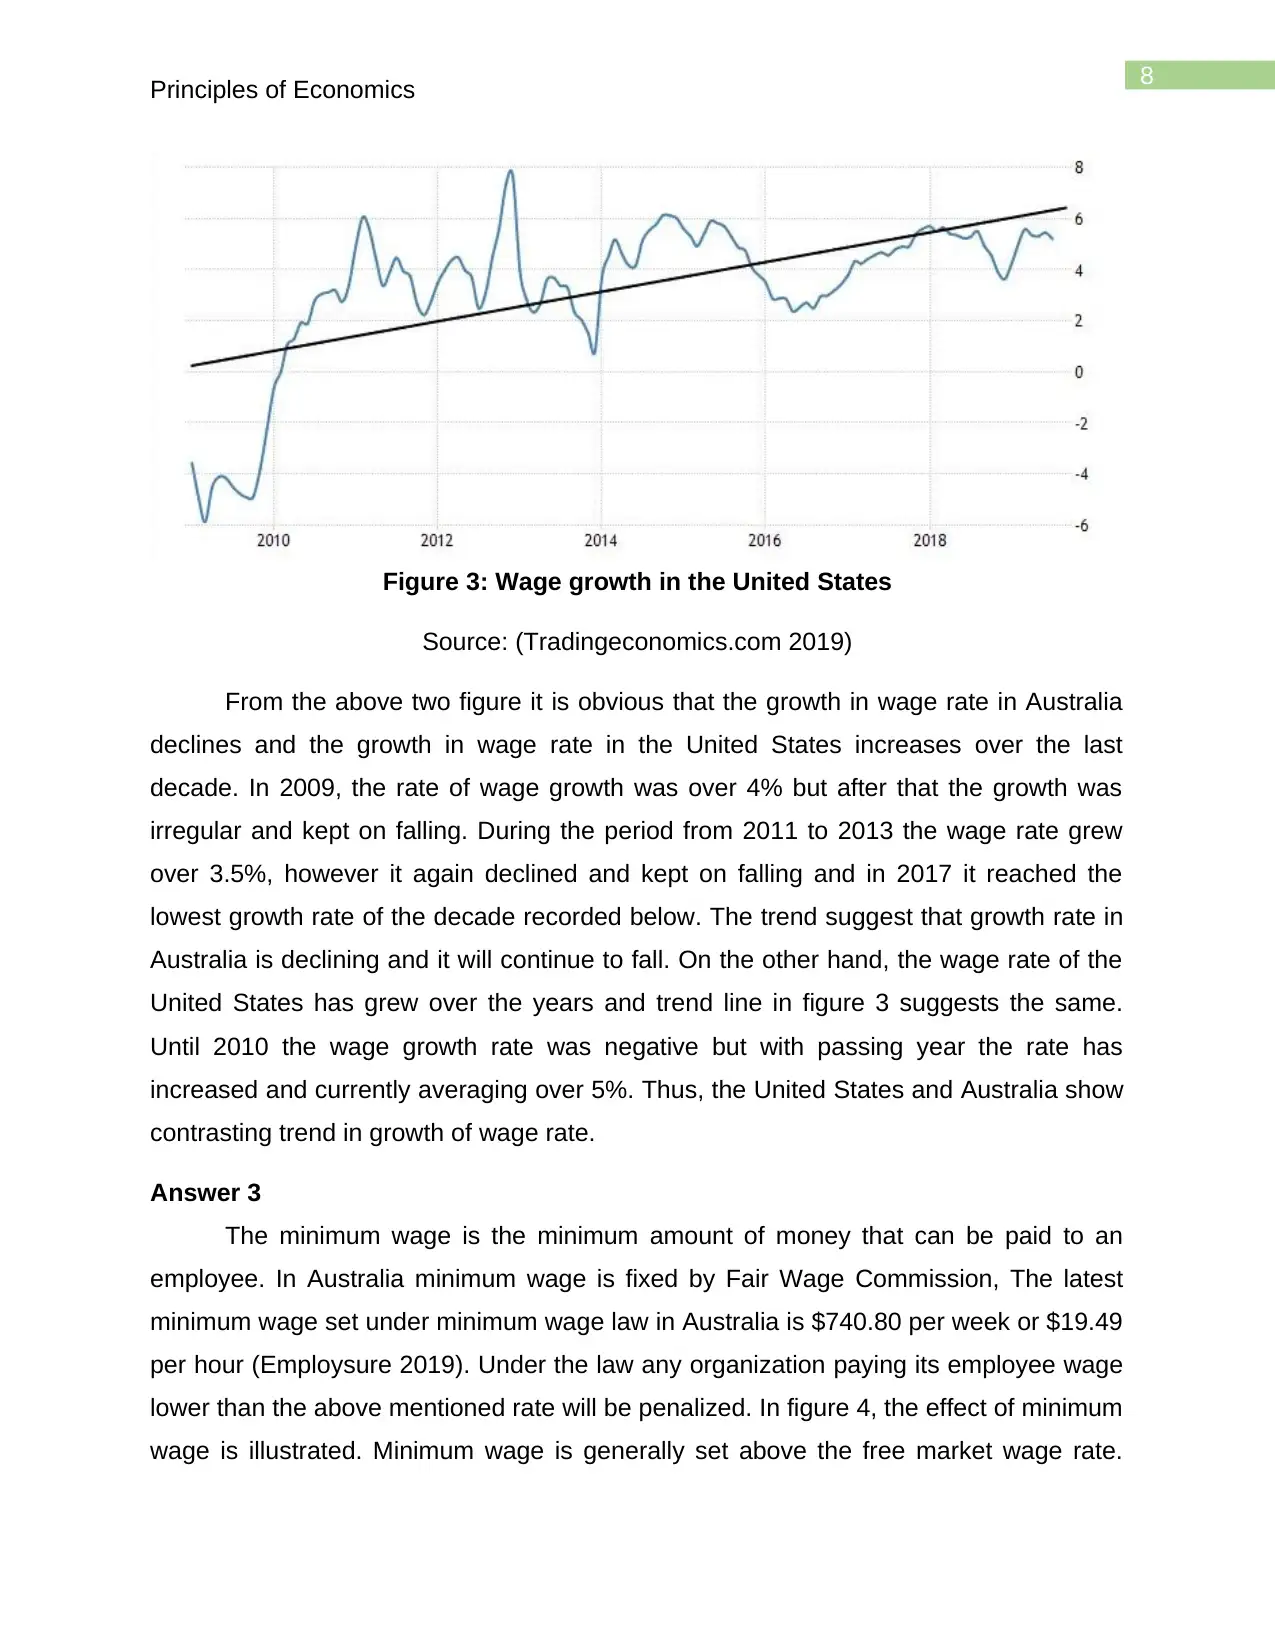
Figure 3: Wage growth in the United States
Source: (Tradingeconomics.com 2019)
From the above two figure it is obvious that the growth in wage rate in Australia
declines and the growth in wage rate in the United States increases over the last
decade. In 2009, the rate of wage growth was over 4% but after that the growth was
irregular and kept on falling. During the period from 2011 to 2013 the wage rate grew
over 3.5%, however it again declined and kept on falling and in 2017 it reached the
lowest growth rate of the decade recorded below. The trend suggest that growth rate in
Australia is declining and it will continue to fall. On the other hand, the wage rate of the
United States has grew over the years and trend line in figure 3 suggests the same.
Until 2010 the wage growth rate was negative but with passing year the rate has
increased and currently averaging over 5%. Thus, the United States and Australia show
contrasting trend in growth of wage rate.
Answer 3
The minimum wage is the minimum amount of money that can be paid to an
employee. In Australia minimum wage is fixed by Fair Wage Commission, The latest
minimum wage set under minimum wage law in Australia is $740.80 per week or $19.49
per hour (Employsure 2019). Under the law any organization paying its employee wage
lower than the above mentioned rate will be penalized. In figure 4, the effect of minimum
wage is illustrated. Minimum wage is generally set above the free market wage rate.
Principles of Economics
Figure 3: Wage growth in the United States
Source: (Tradingeconomics.com 2019)
From the above two figure it is obvious that the growth in wage rate in Australia
declines and the growth in wage rate in the United States increases over the last
decade. In 2009, the rate of wage growth was over 4% but after that the growth was
irregular and kept on falling. During the period from 2011 to 2013 the wage rate grew
over 3.5%, however it again declined and kept on falling and in 2017 it reached the
lowest growth rate of the decade recorded below. The trend suggest that growth rate in
Australia is declining and it will continue to fall. On the other hand, the wage rate of the
United States has grew over the years and trend line in figure 3 suggests the same.
Until 2010 the wage growth rate was negative but with passing year the rate has
increased and currently averaging over 5%. Thus, the United States and Australia show
contrasting trend in growth of wage rate.
Answer 3
The minimum wage is the minimum amount of money that can be paid to an
employee. In Australia minimum wage is fixed by Fair Wage Commission, The latest
minimum wage set under minimum wage law in Australia is $740.80 per week or $19.49
per hour (Employsure 2019). Under the law any organization paying its employee wage
lower than the above mentioned rate will be penalized. In figure 4, the effect of minimum
wage is illustrated. Minimum wage is generally set above the free market wage rate.
⊘ This is a preview!⊘
Do you want full access?
Subscribe today to unlock all pages.
Trusted by 1+ million students worldwide
9
JS
W
W
M
Wage D
S
JobsJDJ*
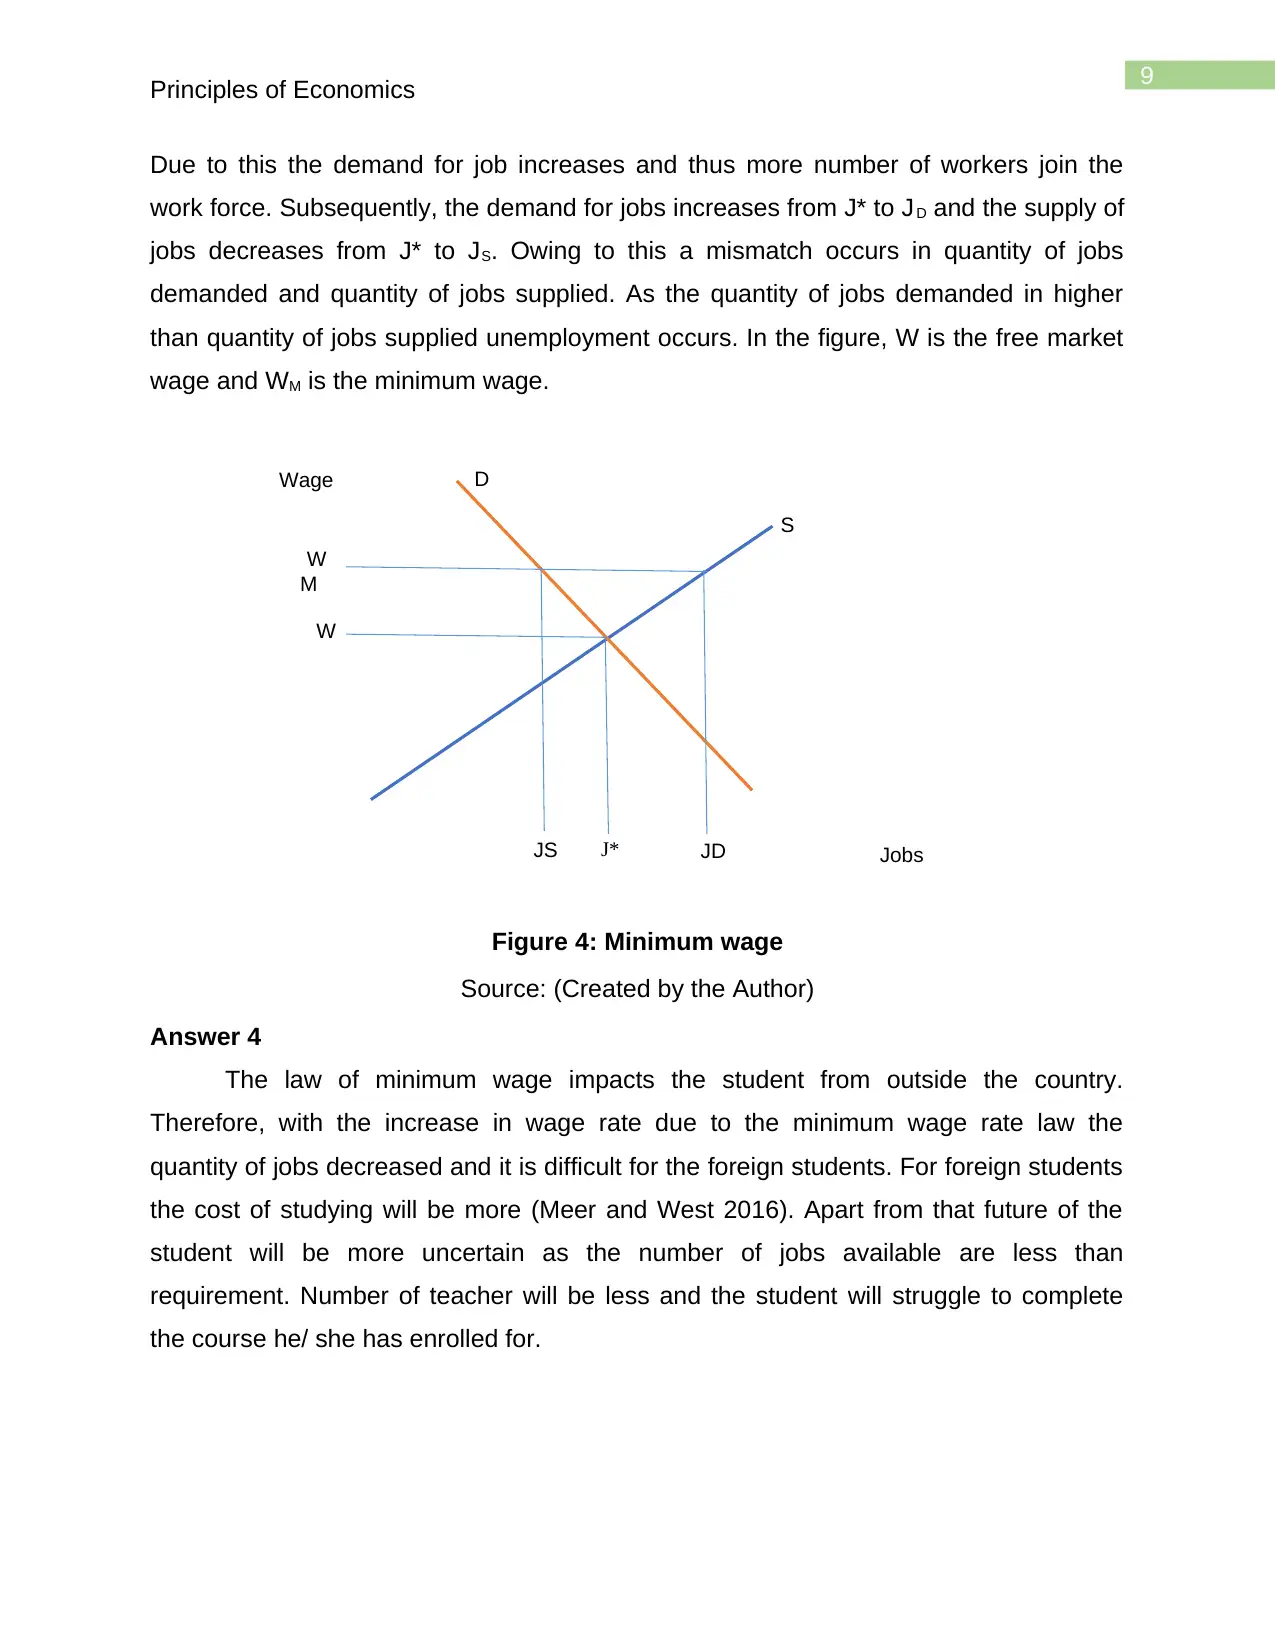
Principles of Economics
Due to this the demand for job increases and thus more number of workers join the
work force. Subsequently, the demand for jobs increases from J* to JD and the supply of
jobs decreases from J* to JS. Owing to this a mismatch occurs in quantity of jobs
demanded and quantity of jobs supplied. As the quantity of jobs demanded in higher
than quantity of jobs supplied unemployment occurs. In the figure, W is the free market
wage and WM is the minimum wage.
Figure 4: Minimum wage
Source: (Created by the Author)
Answer 4
The law of minimum wage impacts the student from outside the country.
Therefore, with the increase in wage rate due to the minimum wage rate law the
quantity of jobs decreased and it is difficult for the foreign students. For foreign students
the cost of studying will be more (Meer and West 2016). Apart from that future of the
student will be more uncertain as the number of jobs available are less than
requirement. Number of teacher will be less and the student will struggle to complete
the course he/ she has enrolled for.
JS
W
W
M
Wage D
S
JobsJDJ*
Principles of Economics
Due to this the demand for job increases and thus more number of workers join the
work force. Subsequently, the demand for jobs increases from J* to JD and the supply of
jobs decreases from J* to JS. Owing to this a mismatch occurs in quantity of jobs
demanded and quantity of jobs supplied. As the quantity of jobs demanded in higher
than quantity of jobs supplied unemployment occurs. In the figure, W is the free market
wage and WM is the minimum wage.
Figure 4: Minimum wage
Source: (Created by the Author)
Answer 4
The law of minimum wage impacts the student from outside the country.
Therefore, with the increase in wage rate due to the minimum wage rate law the
quantity of jobs decreased and it is difficult for the foreign students. For foreign students
the cost of studying will be more (Meer and West 2016). Apart from that future of the
student will be more uncertain as the number of jobs available are less than
requirement. Number of teacher will be less and the student will struggle to complete
the course he/ she has enrolled for.
Paraphrase This Document
Need a fresh take? Get an instant paraphrase of this document with our AI Paraphraser
10
Principles of Economics
References
Chaloupka, F.J., Powell, L.M. and Warner, K.E., 2019. The use of excise taxes to
reduce tobacco, alcohol, and sugary beverage consumption. Annual review of public
health, 40, pp.187-201.
Davoren, M.P., Demant, J., Shiely, F. and Perry, I.J., 2016. Alcohol consumption among
university students in Ireland and the United Kingdom from 2002 to 2014: a systematic
review. BMC public health, 16(1), p.173.
de Wit, A., van Gils, P., Over, E., Lokkerbol, J., Smit, F., Mosca, I., Spit, W., de
Kinderen, R. and Evers, S., 2017. VP129 Social Cost Benefit Analysis (SCBA) Of Three
Alcohol Policy Measures. International Journal of Technology Assessment in Health
Care, 33(S1), pp.207-207.
Employsure (2019). Minimum Wages Australia | Award Wages 2019 | Employsure
Guides. [online] Employsure. Available at: https://employsure.com.au/guides/wage-and-
pay/minimum-wage-australia/.
Jawad, M., Lee, J.T., Glantz, S. and Millett, C., 2018. Price elasticity of demand of non-
cigarette tobacco products: a systematic review and meta-analysis. Tobacco
control, 27(6), pp.689-695.
Kirinholdings.co.jp (2019). Kirin Beer University Report Global Beer Consumption by
Country in 2016 | 2017 | News Releases | Kirin Holdings. [online] Kirinholdings.co.jp.
Available at: https://www.kirinholdings.co.jp/english/news/2017/1221_01.html [Accessed
11 Sep. 2019].
Livingston, M. and Dietze, P., 2016. National survey data can be used to measure
trends in population alcohol consumption in Australia. Australian and New Zealand
journal of public health, 40(3), pp.233-235.
Meer, J. and West, J., 2016. Effects of the minimum wage on employment
dynamics. Journal of Human Resources, 51(2), pp.500-522.
11
Principles of Economics
Musolino, F., 2015. Effectiveness and Efficiency Trade-Off in the Demerit Goods
Taxation: a Non-Standard Approach. Journal of Mathematical Economics and
Finance, 1(1 (1)), pp.34-45.
Tradingeconomics.com (2019). Australia Annual Change in Hourly Rates of Pay | 2019
| Data | Chart. [online] Tradingeconomics.com. Available at:
https://tradingeconomics.com/australia/wage-growth.
Tradingeconomics.com (2019). United States Wages and Salaries Growth | 2019 | Data
| Chart | Calendar. [online] Tradingeconomics.com. Available at:
https://tradingeconomics.com/united-states/wage-growth.
Verdugo, G., 2016. Real wage cyclicality in the Eurozone before and during the Great
Recession: Evidence from micro data. European Economic Review, 82, pp.46-69.
⊘ This is a preview!⊘
Do you want full access?
Subscribe today to unlock all pages.
Trusted by 1+ million students worldwide
1 out of 12
Related Documents


Your All-in-One AI-Powered Toolkit for Academic Success.
+13062052269
info@desklib.com
Available 24*7 on WhatsApp / Email
![[object Object]](/_next/static/media/star-bottom.7253800d.svg)
Unlock your academic potential
Copyright © 2020–2026 A2Z Services. All Rights Reserved. Developed and managed by ZUCOL.