Business Economics: Beer Consumption, Taxes, and Labor Market Analysis
VerifiedAdded on 2023/06/07
|12
|2568
|475
Report
AI Summary
This report provides a comprehensive analysis of the beer market in Australia, comparing its consumption patterns with those of the Czech Republic, attributing the differences to factors like price and cultural significance. It delves into the price elasticity of demand for beer, the impact of excise taxes on consumption, and the government's cost-benefit analysis of policies aimed at reducing alcohol consumption. Furthermore, the report examines the Australian labor market, focusing on real wage growth, inflation, and the effects of minimum wage regulations, comparing these aspects with those of the United States. The analysis incorporates relevant economic principles and data to offer insights into market dynamics and policy implications. Desklib provides access to this and similar solved assignments for students seeking academic assistance.
Running head: BUSINESS ECONOMICS
Business Economics
Name of the Student:
Name of the University:
Author note:
Business Economics
Name of the Student:
Name of the University:
Author note:
Paraphrase This Document
Need a fresh take? Get an instant paraphrase of this document with our AI Paraphraser
1BUSINESS ECONOMICS
Market for beer
Answer 1
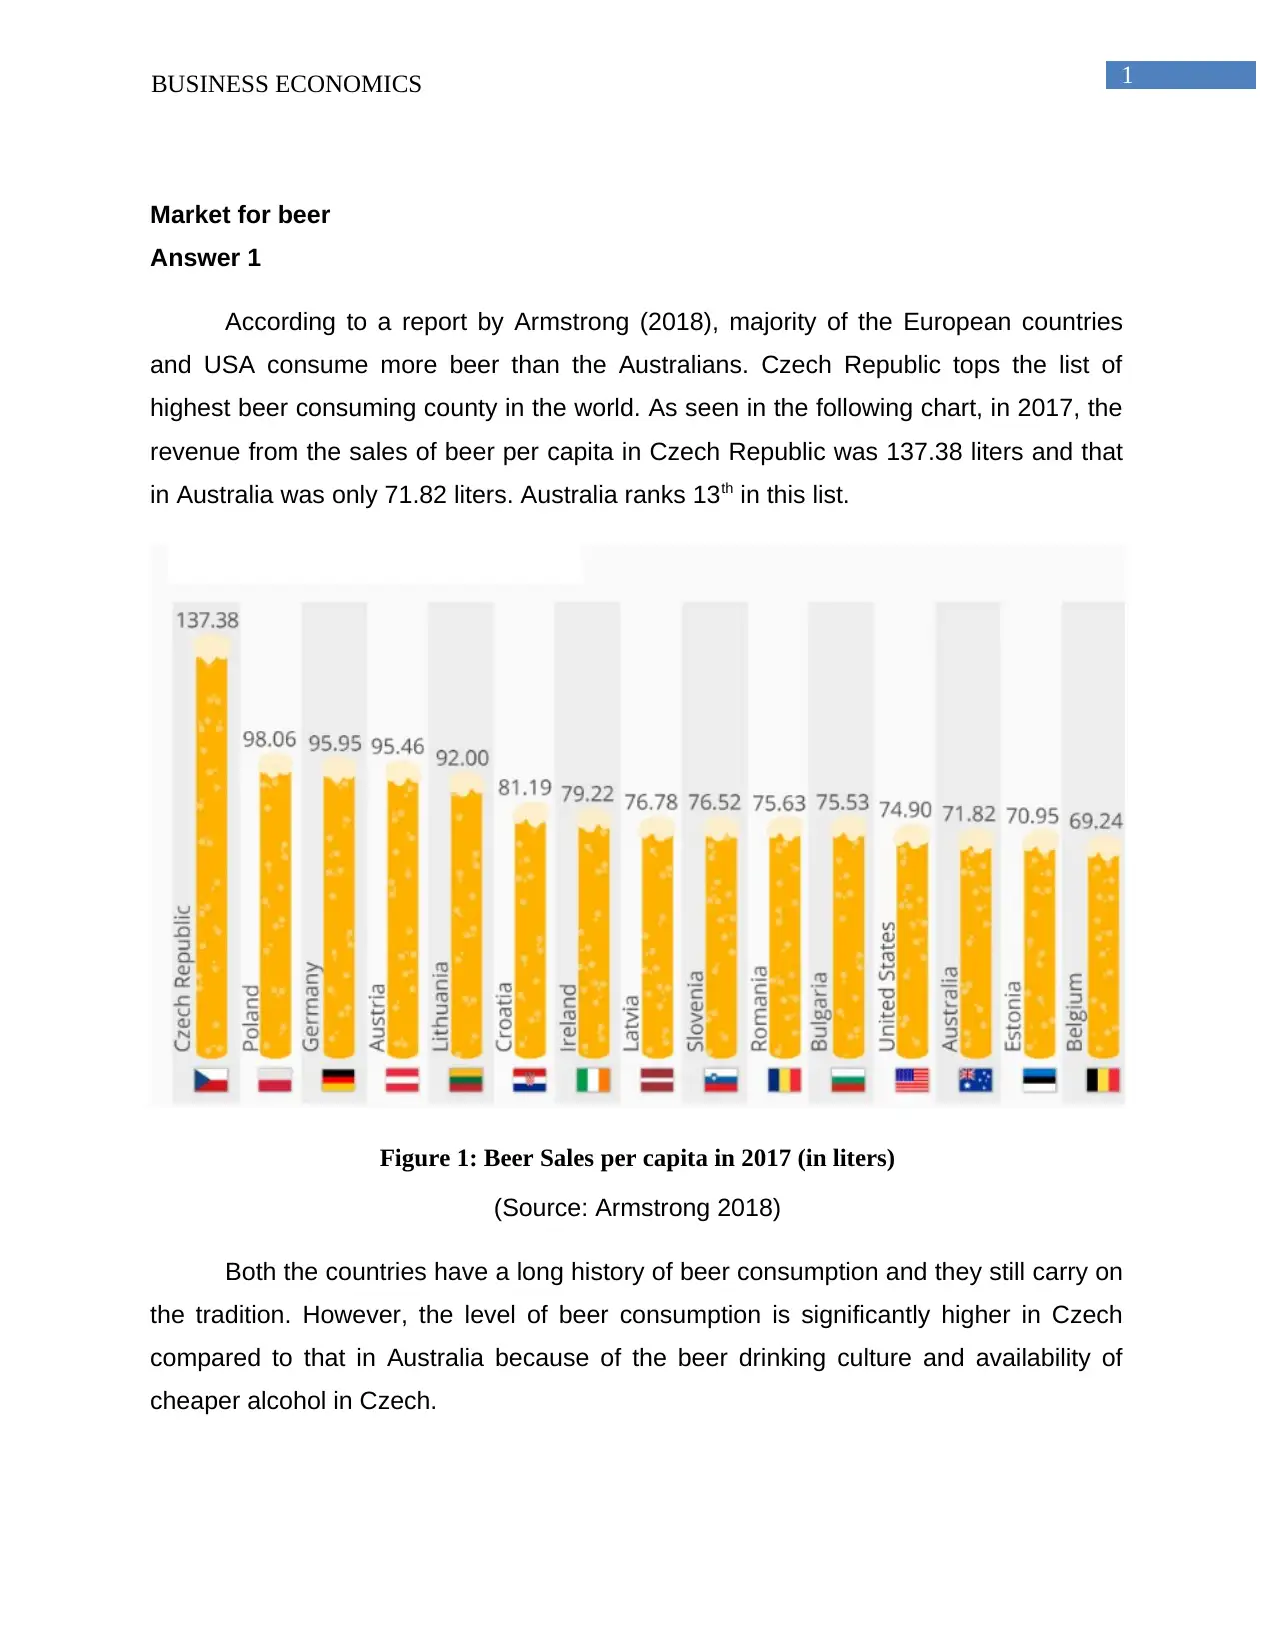
According to a report by Armstrong (2018), majority of the European countries
and USA consume more beer than the Australians. Czech Republic tops the list of
highest beer consuming county in the world. As seen in the following chart, in 2017, the
revenue from the sales of beer per capita in Czech Republic was 137.38 liters and that
in Australia was only 71.82 liters. Australia ranks 13th in this list.
Figure 1: Beer Sales per capita in 2017 (in liters)
(Source: Armstrong 2018)
Both the countries have a long history of beer consumption and they still carry on
the tradition. However, the level of beer consumption is significantly higher in Czech
compared to that in Australia because of the beer drinking culture and availability of
cheaper alcohol in Czech.
Market for beer
Answer 1
According to a report by Armstrong (2018), majority of the European countries
and USA consume more beer than the Australians. Czech Republic tops the list of
highest beer consuming county in the world. As seen in the following chart, in 2017, the
revenue from the sales of beer per capita in Czech Republic was 137.38 liters and that
in Australia was only 71.82 liters. Australia ranks 13th in this list.
Figure 1: Beer Sales per capita in 2017 (in liters)
(Source: Armstrong 2018)
Both the countries have a long history of beer consumption and they still carry on
the tradition. However, the level of beer consumption is significantly higher in Czech
compared to that in Australia because of the beer drinking culture and availability of
cheaper alcohol in Czech.
2BUSINESS ECONOMICS
Secondary data on the sales of the beer would reflect the differences in the beer
consumption among two countries, as seen above. The chart on the sales data is
effective for a visual representation of the comparison between two countries. Hence,
secondary data on the beer consumption comparison should be collected from an
authentic website to fulfill the objective of effective comparison.
Answer 2
The difference between the beer consumption between Australia and Czech
Republic can be attributed to the following factors.
Cheaper beer in Czech: the price of beer is extremely cheap in Czech than in
Australia. According to Numbeo.com (2018), a 0.5 liter draught of domestic beer costs
around 7 AUD in Australia while it costs around 1.88 AUD in Czech Republic. Thus,
there is a price difference of almost 73.16% for beer in Czech and Australia. Similarly,
for 0.33 liter bottle of imported beer costs 8 AUD in Australia while 2.51 AUD in Czech,
with a price difference of 68.96%. Beer is relatively much cheaper in Czech than in
Australia due to higher production.
Culture: Czech Republic acknowledges historical significance of beer as a part of their
culture. They consider beer drinking as a part of their lifestyle. The Czech beer is one of
the finest quality beers in the world. It is found that, the Czech women feel that drinking
less beer is a matter of shame to their culture (Scott 2013). According to them, beer has
many benefits, such as, keeping the kidneys healthy, reducing blood pressure, good
skin, stronger bones, reducing risk of heart attack and cancer (Jirasova 2016). On the
other hand, the Australians are also a beer drinking nation. However, the trend has
been changing towards wine drinking. People’s tastes and preferences are changing,
based on income level, and health awareness.
Health issues: the Australians are becoming more and more concerned about their
health issues and hence, the overall alcohol consumption is falling. They feel wine is
better for health and thus, wine consumption has increased significantly (Germov and
McIntyre 2013). However, there is no such issue regarding beer consumption in Czech
⊘ This is a preview!⊘
Do you want full access?
Subscribe today to unlock all pages.
Trusted by 1+ million students worldwide
3BUSINESS ECONOMICS
P1
P2
Q1Q2
Relatively inelastic demand curve for beer
Price
Quantity demanded
and the finest quality beer is produced there, leading to a rise in the beer consumption
(Groundwater 2017).
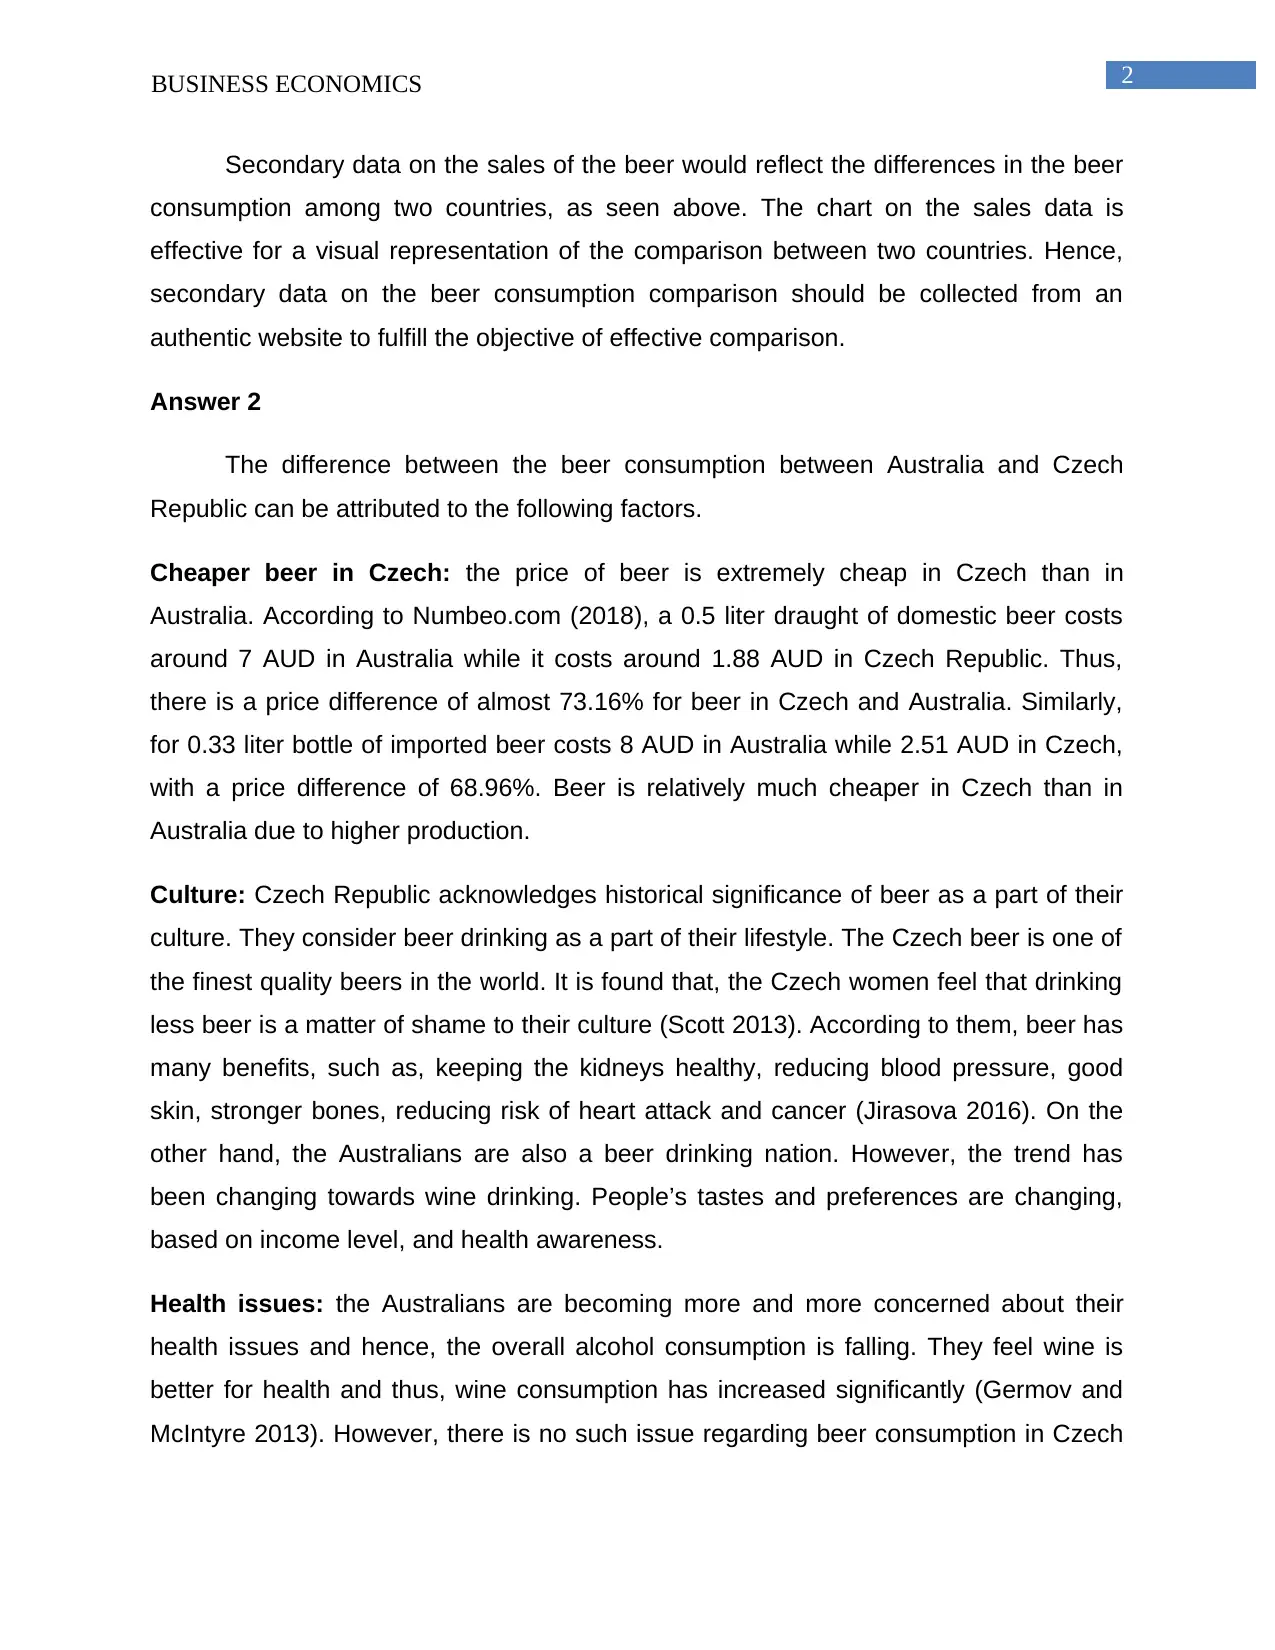
Answer 3
Price elasticity of demand explains the percentage change in the demand for one
unit of a product or service due to one percentage change in its price (Varian 2014).
Beer is a normal good and not a luxury good in Australia. Drinking beer is a part of their
tradition and culture and hence, people are mostly price insensitive for beer. Thus,
demand elasticity for beer is relatively price inelastic, that is, one percentage change in
its price does not affect the demand for beer significantly in the Australian market.
Figure 2: Relatively inelastic demand curve for beer in Australia
As seen from the above diagram, due to relatively inelastic demand curve for
beer in Australia, one unit of price rise led to a very small decline in the quantity
demanded for beer.
P1
P2
Q1Q2
Relatively inelastic demand curve for beer
Price
Quantity demanded
and the finest quality beer is produced there, leading to a rise in the beer consumption
(Groundwater 2017).
Answer 3
Price elasticity of demand explains the percentage change in the demand for one
unit of a product or service due to one percentage change in its price (Varian 2014).
Beer is a normal good and not a luxury good in Australia. Drinking beer is a part of their
tradition and culture and hence, people are mostly price insensitive for beer. Thus,
demand elasticity for beer is relatively price inelastic, that is, one percentage change in
its price does not affect the demand for beer significantly in the Australian market.
Figure 2: Relatively inelastic demand curve for beer in Australia
As seen from the above diagram, due to relatively inelastic demand curve for
beer in Australia, one unit of price rise led to a very small decline in the quantity
demanded for beer.
Paraphrase This Document
Need a fresh take? Get an instant paraphrase of this document with our AI Paraphraser

4BUSINESS ECONOMICS
5BUSINESS ECONOMICS
P1
P2
Q1Q2
Excise tax
Price
Quantity demanded
Pt
S1
St
D
Tax revenue
A
B
C
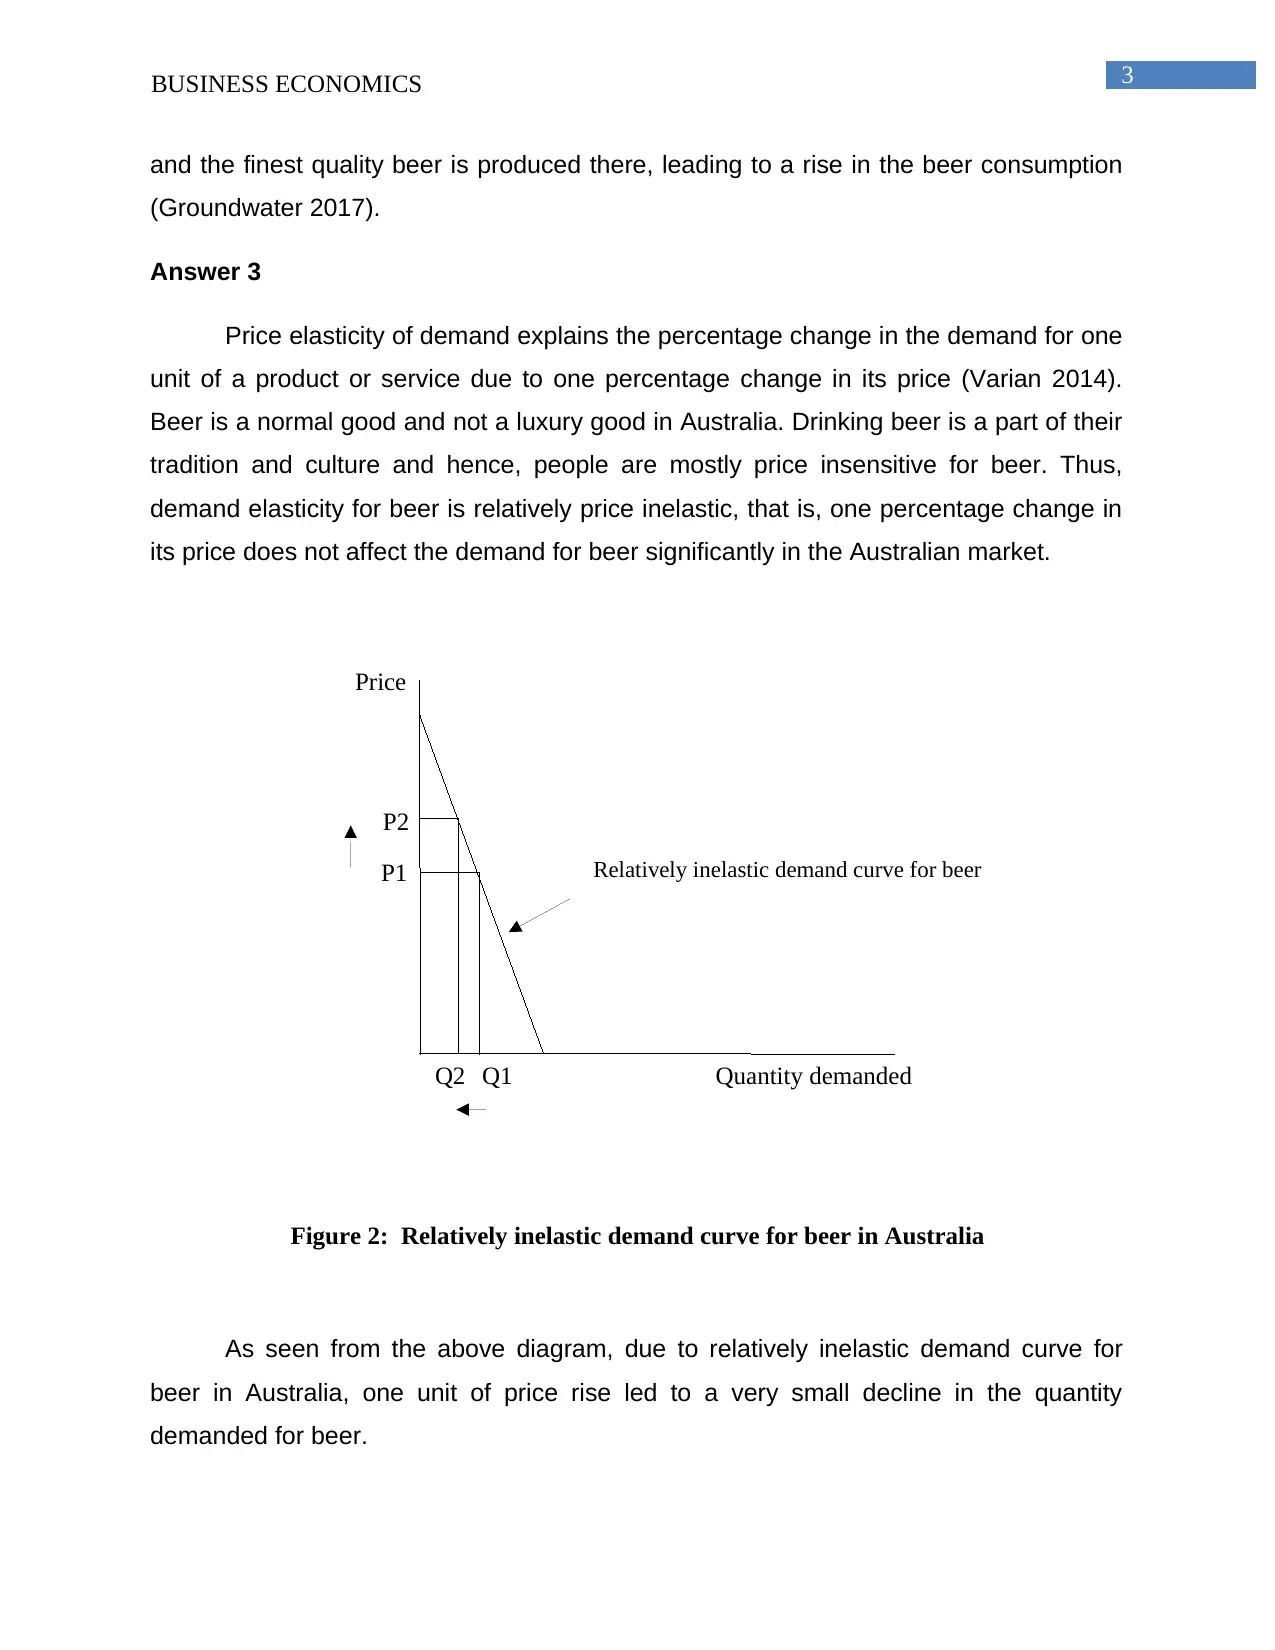
Answer 4
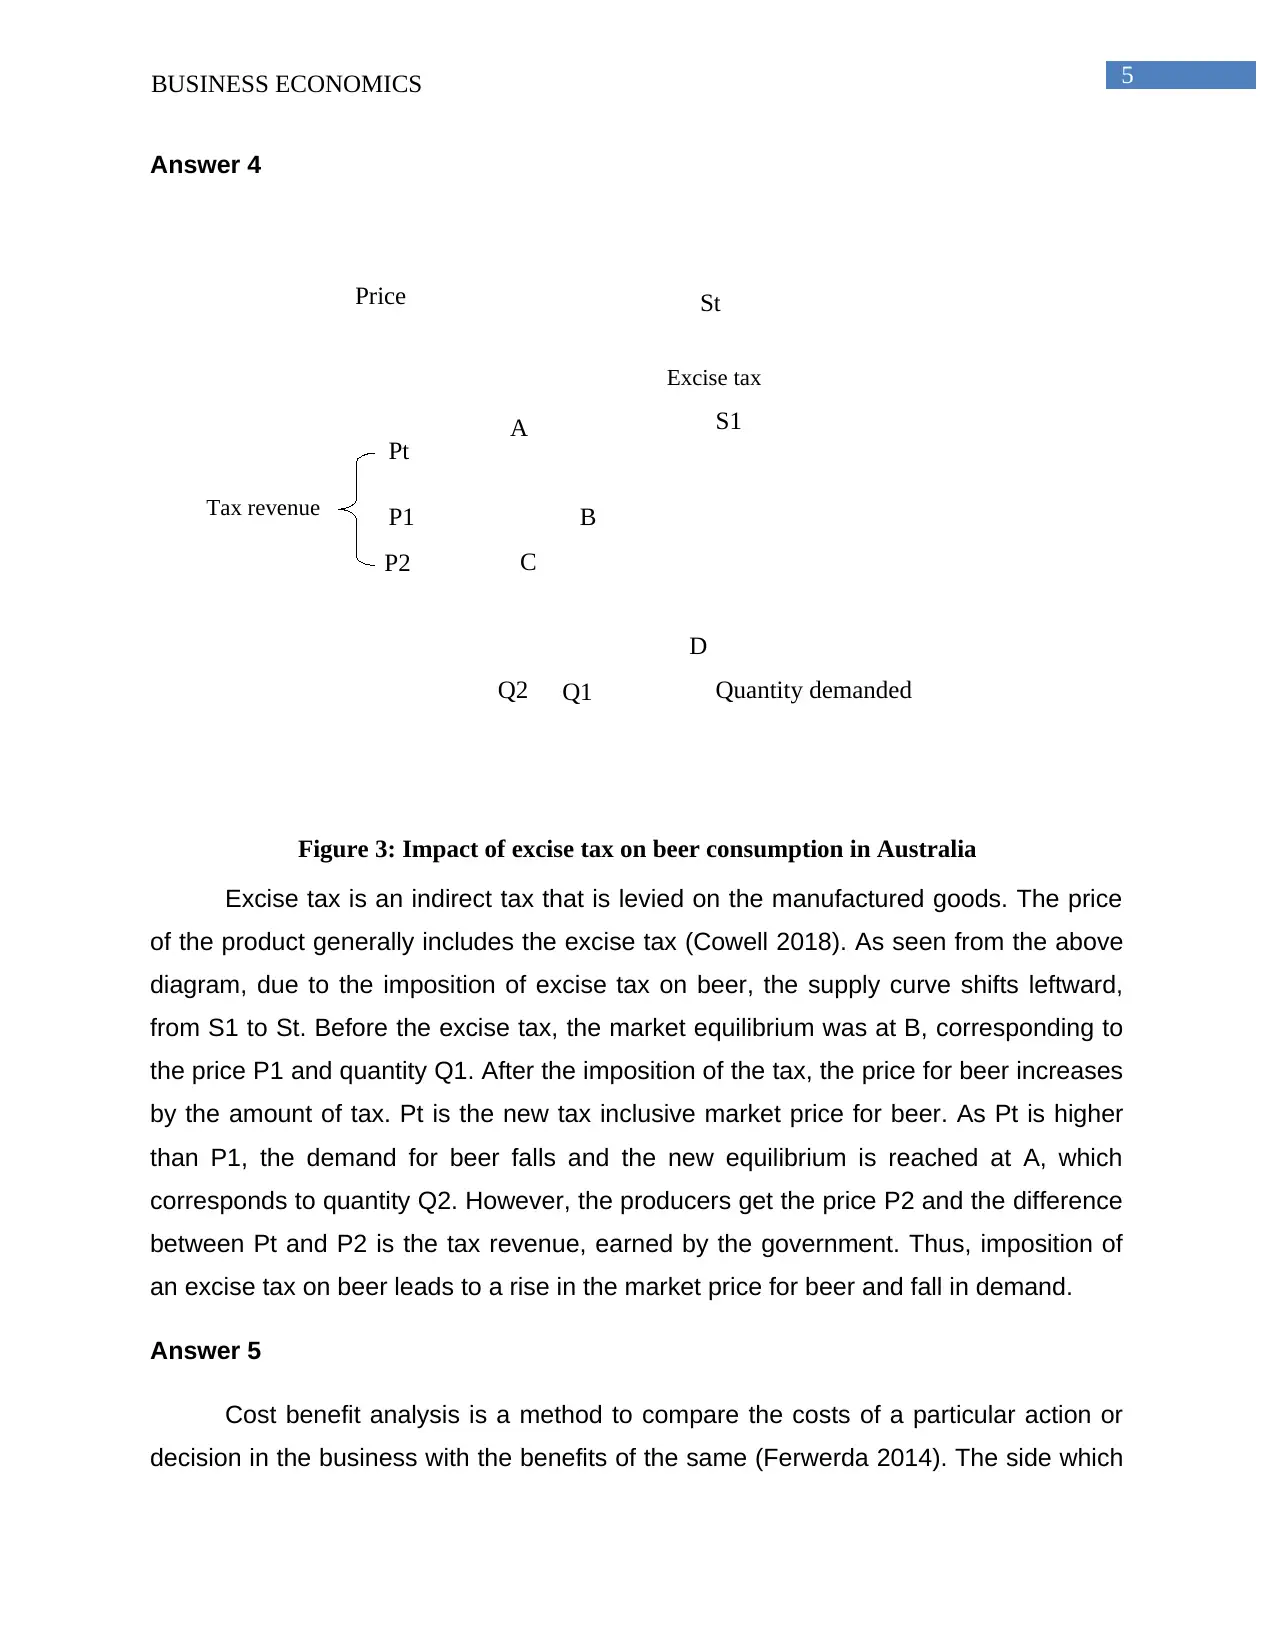
Figure 3: Impact of excise tax on beer consumption in Australia
Excise tax is an indirect tax that is levied on the manufactured goods. The price
of the product generally includes the excise tax (Cowell 2018). As seen from the above
diagram, due to the imposition of excise tax on beer, the supply curve shifts leftward,
from S1 to St. Before the excise tax, the market equilibrium was at B, corresponding to
the price P1 and quantity Q1. After the imposition of the tax, the price for beer increases
by the amount of tax. Pt is the new tax inclusive market price for beer. As Pt is higher
than P1, the demand for beer falls and the new equilibrium is reached at A, which
corresponds to quantity Q2. However, the producers get the price P2 and the difference
between Pt and P2 is the tax revenue, earned by the government. Thus, imposition of
an excise tax on beer leads to a rise in the market price for beer and fall in demand.
Answer 5
Cost benefit analysis is a method to compare the costs of a particular action or
decision in the business with the benefits of the same (Ferwerda 2014). The side which
P1
P2
Q1Q2
Excise tax
Price
Quantity demanded
Pt
S1
St
D
Tax revenue
A
B
C
Answer 4
Figure 3: Impact of excise tax on beer consumption in Australia
Excise tax is an indirect tax that is levied on the manufactured goods. The price
of the product generally includes the excise tax (Cowell 2018). As seen from the above
diagram, due to the imposition of excise tax on beer, the supply curve shifts leftward,
from S1 to St. Before the excise tax, the market equilibrium was at B, corresponding to
the price P1 and quantity Q1. After the imposition of the tax, the price for beer increases
by the amount of tax. Pt is the new tax inclusive market price for beer. As Pt is higher
than P1, the demand for beer falls and the new equilibrium is reached at A, which
corresponds to quantity Q2. However, the producers get the price P2 and the difference
between Pt and P2 is the tax revenue, earned by the government. Thus, imposition of
an excise tax on beer leads to a rise in the market price for beer and fall in demand.
Answer 5
Cost benefit analysis is a method to compare the costs of a particular action or
decision in the business with the benefits of the same (Ferwerda 2014). The side which
⊘ This is a preview!⊘
Do you want full access?
Subscribe today to unlock all pages.
Trusted by 1+ million students worldwide
6BUSINESS ECONOMICS
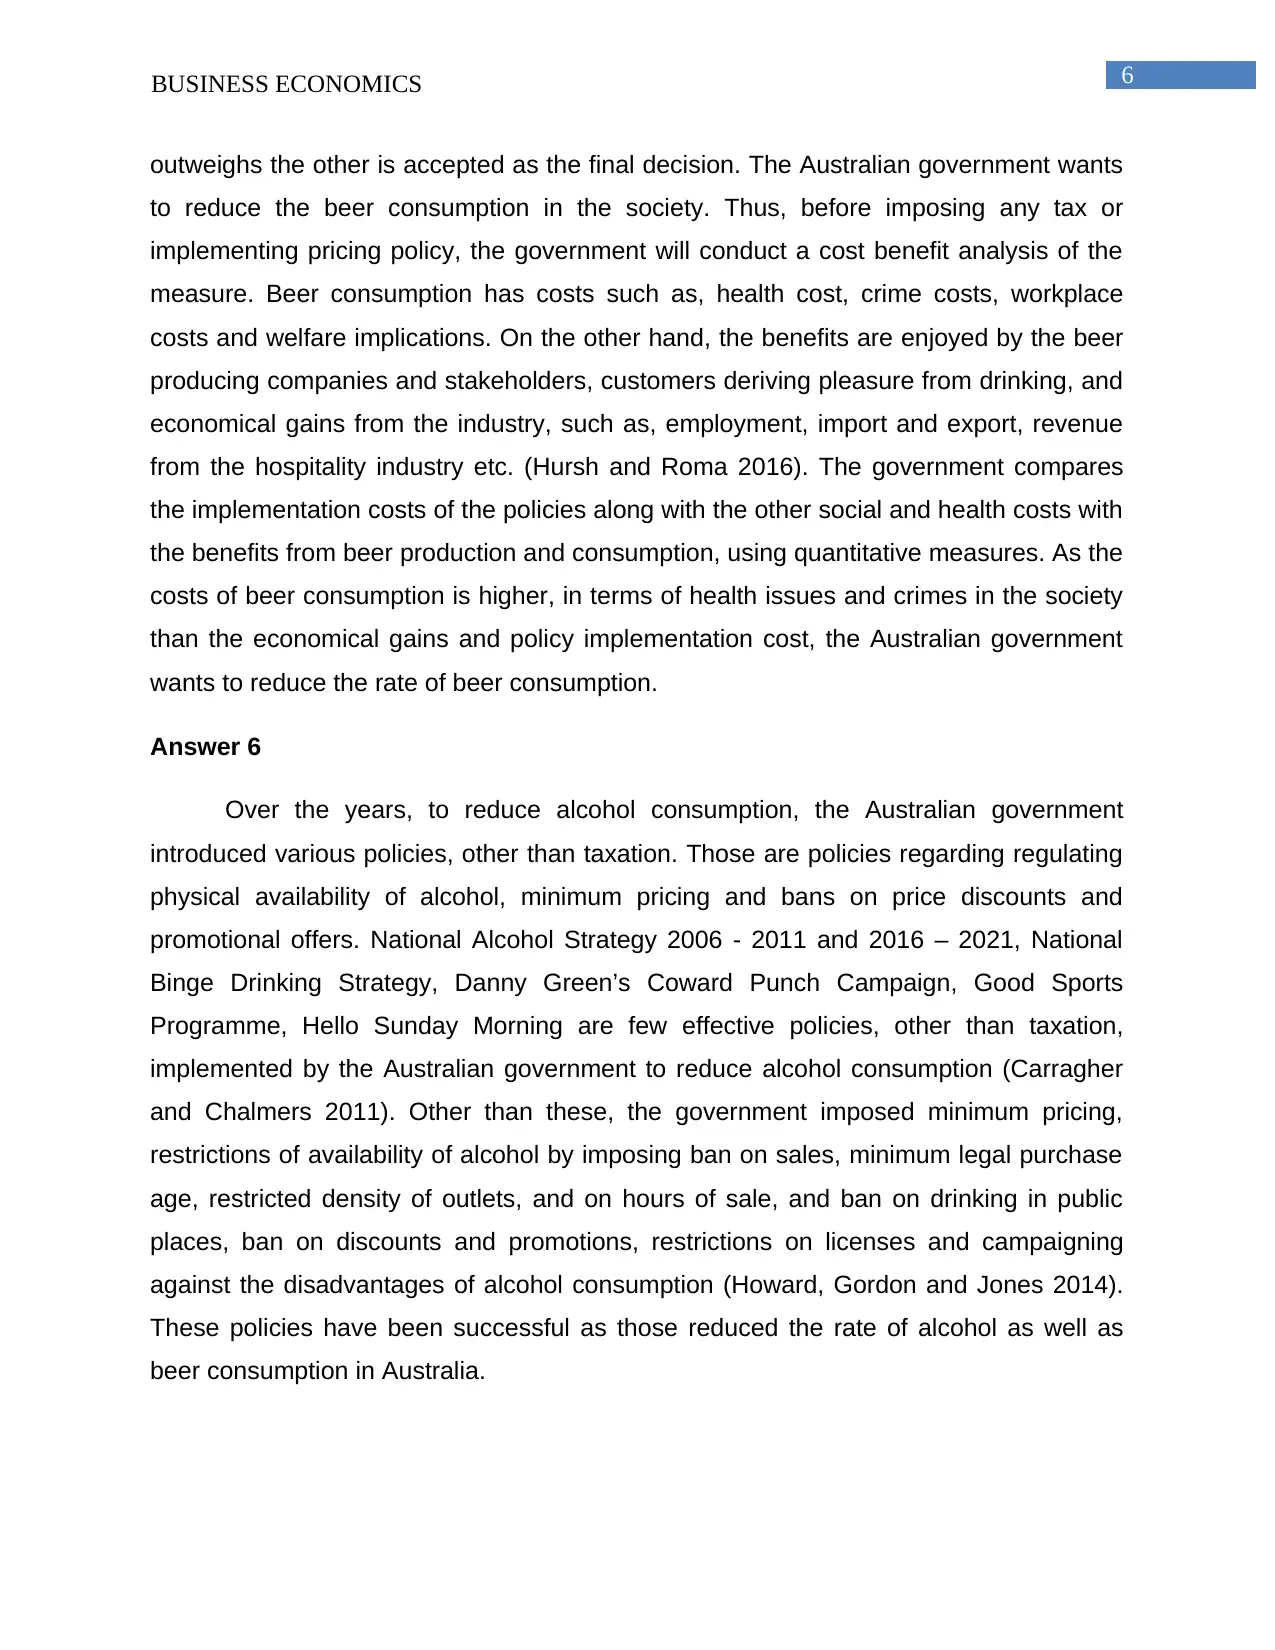
outweighs the other is accepted as the final decision. The Australian government wants
to reduce the beer consumption in the society. Thus, before imposing any tax or
implementing pricing policy, the government will conduct a cost benefit analysis of the
measure. Beer consumption has costs such as, health cost, crime costs, workplace
costs and welfare implications. On the other hand, the benefits are enjoyed by the beer
producing companies and stakeholders, customers deriving pleasure from drinking, and
economical gains from the industry, such as, employment, import and export, revenue
from the hospitality industry etc. (Hursh and Roma 2016). The government compares
the implementation costs of the policies along with the other social and health costs with
the benefits from beer production and consumption, using quantitative measures. As the
costs of beer consumption is higher, in terms of health issues and crimes in the society
than the economical gains and policy implementation cost, the Australian government
wants to reduce the rate of beer consumption.
Answer 6
Over the years, to reduce alcohol consumption, the Australian government
introduced various policies, other than taxation. Those are policies regarding regulating
physical availability of alcohol, minimum pricing and bans on price discounts and
promotional offers. National Alcohol Strategy 2006 - 2011 and 2016 – 2021, National
Binge Drinking Strategy, Danny Green’s Coward Punch Campaign, Good Sports
Programme, Hello Sunday Morning are few effective policies, other than taxation,
implemented by the Australian government to reduce alcohol consumption (Carragher
and Chalmers 2011). Other than these, the government imposed minimum pricing,
restrictions of availability of alcohol by imposing ban on sales, minimum legal purchase
age, restricted density of outlets, and on hours of sale, and ban on drinking in public
places, ban on discounts and promotions, restrictions on licenses and campaigning
against the disadvantages of alcohol consumption (Howard, Gordon and Jones 2014).
These policies have been successful as those reduced the rate of alcohol as well as
beer consumption in Australia.
Paraphrase This Document
Need a fresh take? Get an instant paraphrase of this document with our AI Paraphraser
7BUSINESS ECONOMICS
Labor market
Answer 1
Real wage refers to the wage that is adjusted for price rise in the economy, that
is, inflation. Hence, real wage growth refers to the growth in the wage, which is adjusted
for inflation (Varian 2014). Real wage growth helps in understanding the changes in the
standard of living. This is different from nominal wage, which represents the face value
of the wage which also includes the effect of inflation. Real wage growth measures the
changes in the purchasing power of money (Shimer 2017). It is possible that when
nominal wage growth is positive but the real wage growth is negative.
Answer 2
2007 2008 2009 2010 2011 2012 2013 2014 2015 2016
-1.0
0.0
1.0
2.0
3.0
4.0
5.0
2.3
4.4
1.8
2.8
3.3
1.8
2.4 2.5
1.5 1.3
2.9
3.8
-0.4
1.6
3.2
2.1
1.5 1.6
0.1
1.3
Inflation rate, Australia Vs USA, 2007-2016
Australia Inflation,
consumer prices (annual
%)
United States Inflation,
consumer prices (annual
%)
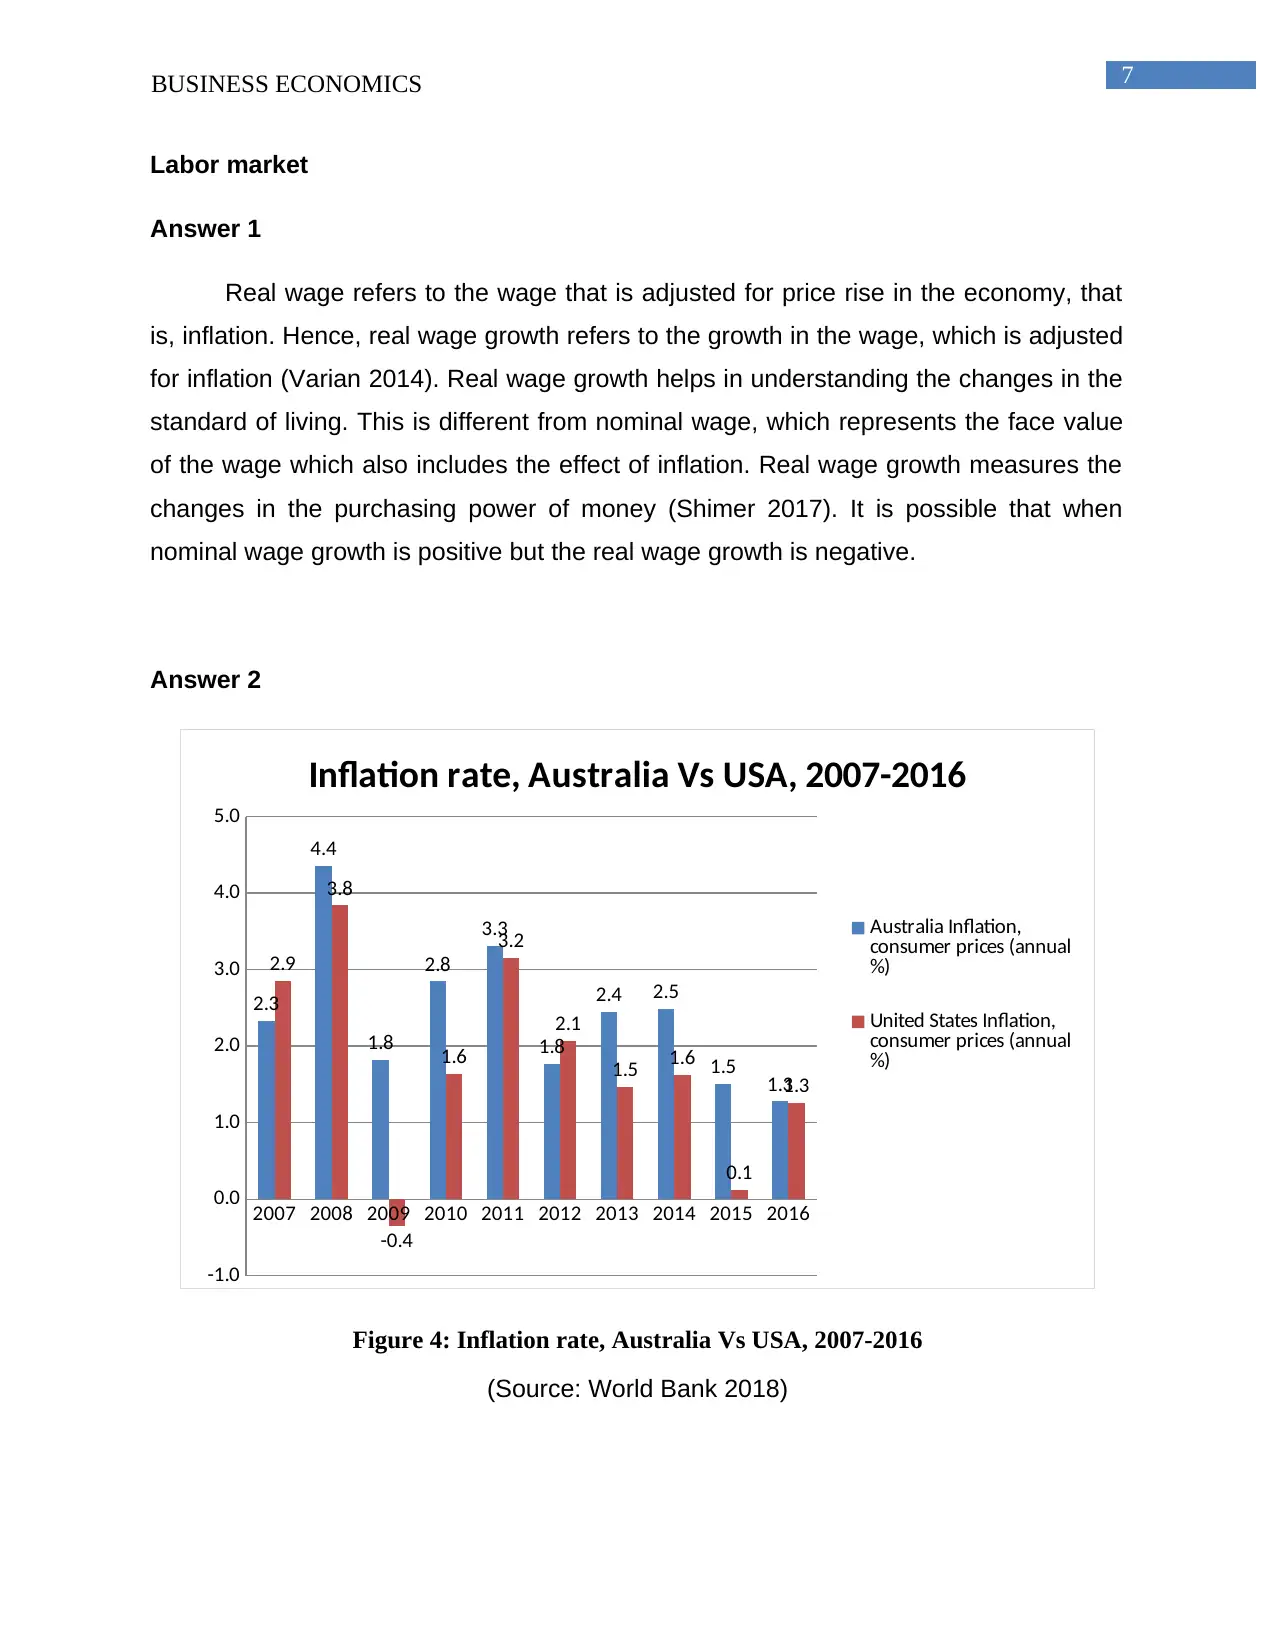
Figure 4: Inflation rate, Australia Vs USA, 2007-2016
(Source: World Bank 2018)
Labor market
Answer 1
Real wage refers to the wage that is adjusted for price rise in the economy, that
is, inflation. Hence, real wage growth refers to the growth in the wage, which is adjusted
for inflation (Varian 2014). Real wage growth helps in understanding the changes in the
standard of living. This is different from nominal wage, which represents the face value
of the wage which also includes the effect of inflation. Real wage growth measures the
changes in the purchasing power of money (Shimer 2017). It is possible that when
nominal wage growth is positive but the real wage growth is negative.
Answer 2
2007 2008 2009 2010 2011 2012 2013 2014 2015 2016
-1.0
0.0
1.0
2.0
3.0
4.0
5.0
2.3
4.4
1.8
2.8
3.3
1.8
2.4 2.5
1.5 1.3
2.9
3.8
-0.4
1.6
3.2
2.1
1.5 1.6
0.1
1.3
Inflation rate, Australia Vs USA, 2007-2016
Australia Inflation,
consumer prices (annual
%)
United States Inflation,
consumer prices (annual
%)
Figure 4: Inflation rate, Australia Vs USA, 2007-2016
(Source: World Bank 2018)
8BUSINESS ECONOMICS
2007 2008 2009 2010 2011 2012 2013 2014 2015 2016 2017
0.0
5,000.0
10,000.0
15,000.0
20,000.0
25,000.0
Real minimum wages, Australia Vs USA, 2007 -
2017 (In 2017 constant prices at 2017 USD PPPs)
Australia
United States
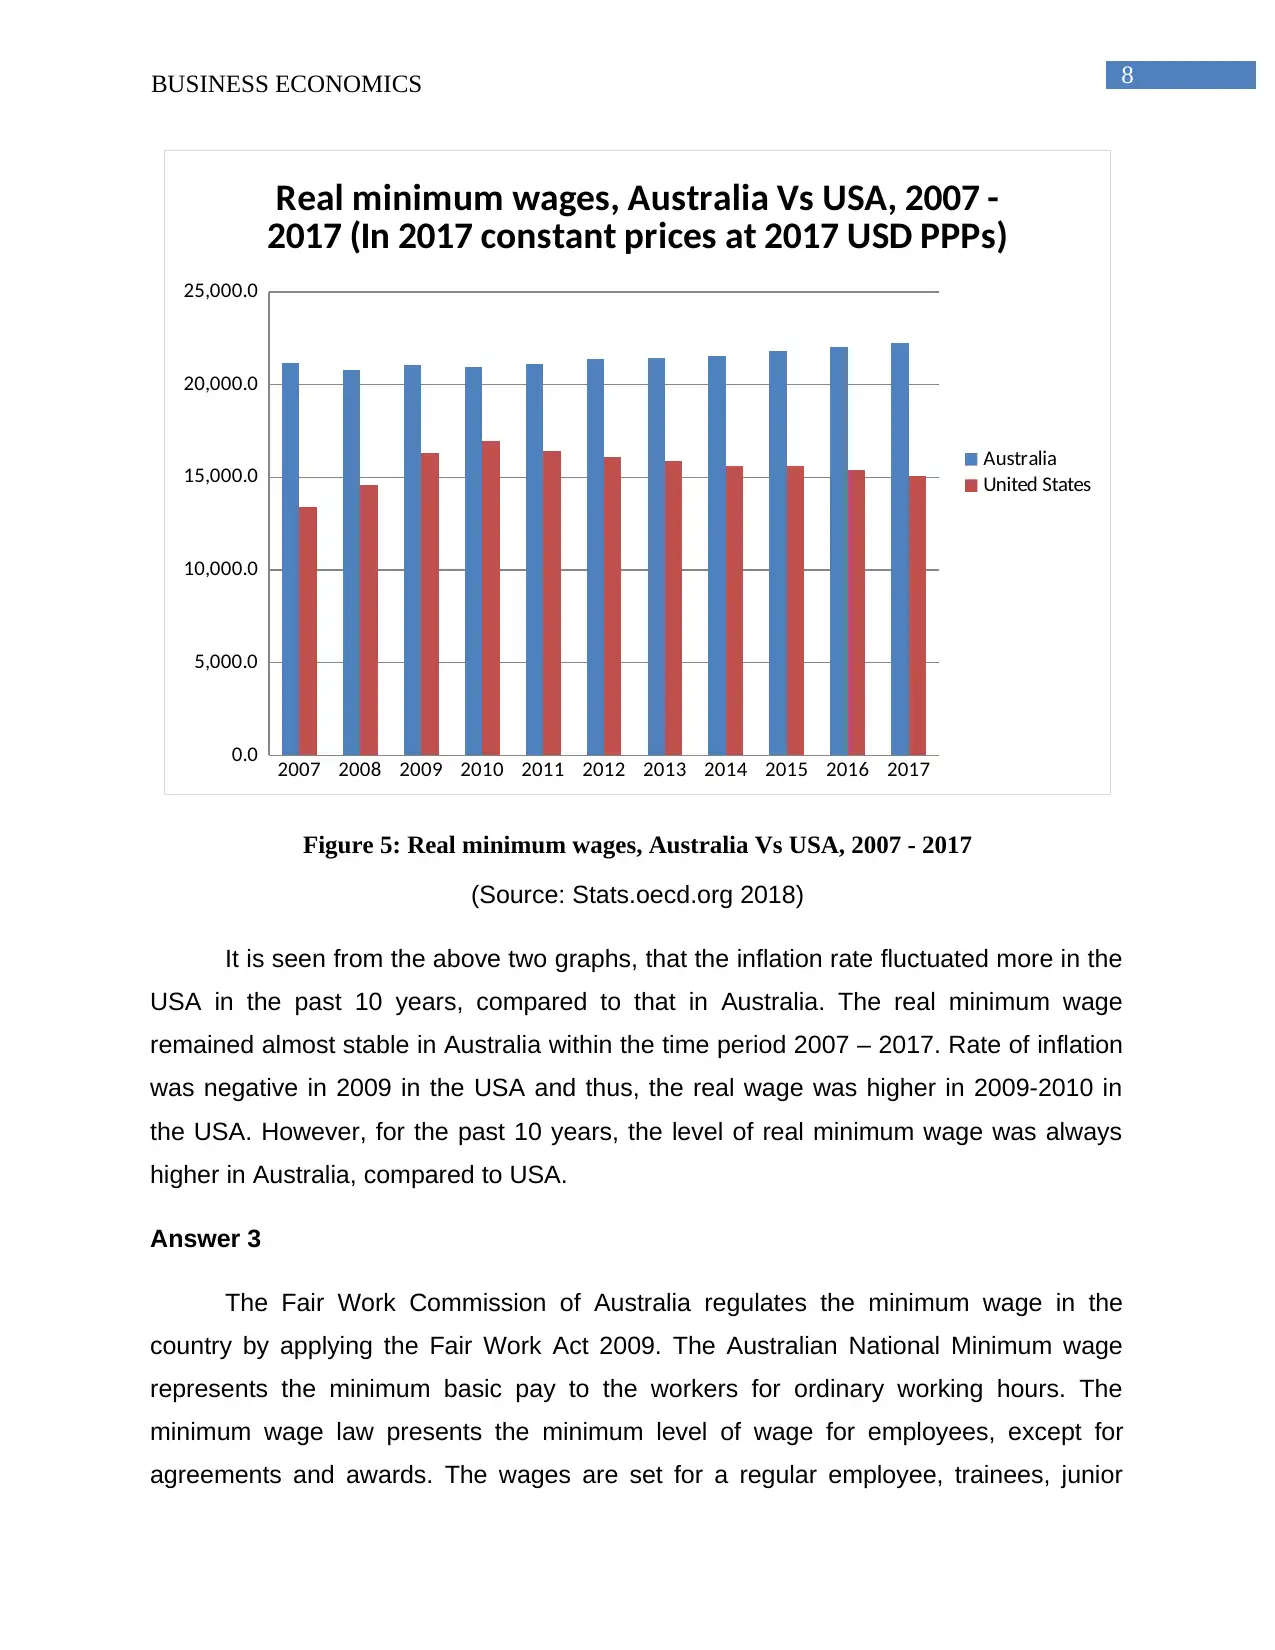
Figure 5: Real minimum wages, Australia Vs USA, 2007 - 2017
(Source: Stats.oecd.org 2018)
It is seen from the above two graphs, that the inflation rate fluctuated more in the
USA in the past 10 years, compared to that in Australia. The real minimum wage
remained almost stable in Australia within the time period 2007 – 2017. Rate of inflation
was negative in 2009 in the USA and thus, the real wage was higher in 2009-2010 in
the USA. However, for the past 10 years, the level of real minimum wage was always
higher in Australia, compared to USA.
Answer 3
The Fair Work Commission of Australia regulates the minimum wage in the
country by applying the Fair Work Act 2009. The Australian National Minimum wage
represents the minimum basic pay to the workers for ordinary working hours. The
minimum wage law presents the minimum level of wage for employees, except for
agreements and awards. The wages are set for a regular employee, trainees, junior
2007 2008 2009 2010 2011 2012 2013 2014 2015 2016 2017
0.0
5,000.0
10,000.0
15,000.0
20,000.0
25,000.0
Real minimum wages, Australia Vs USA, 2007 -
2017 (In 2017 constant prices at 2017 USD PPPs)
Australia
United States
Figure 5: Real minimum wages, Australia Vs USA, 2007 - 2017
(Source: Stats.oecd.org 2018)
It is seen from the above two graphs, that the inflation rate fluctuated more in the
USA in the past 10 years, compared to that in Australia. The real minimum wage
remained almost stable in Australia within the time period 2007 – 2017. Rate of inflation
was negative in 2009 in the USA and thus, the real wage was higher in 2009-2010 in
the USA. However, for the past 10 years, the level of real minimum wage was always
higher in Australia, compared to USA.
Answer 3
The Fair Work Commission of Australia regulates the minimum wage in the
country by applying the Fair Work Act 2009. The Australian National Minimum wage
represents the minimum basic pay to the workers for ordinary working hours. The
minimum wage law presents the minimum level of wage for employees, except for
agreements and awards. The wages are set for a regular employee, trainees, junior
⊘ This is a preview!⊘
Do you want full access?
Subscribe today to unlock all pages.
Trusted by 1+ million students worldwide
9BUSINESS ECONOMICS
employees, apprentices, disabled employees, and casual loading. The current minimum
wage before tax is AUD 18.93 per hour or AUD 719.20 per 38 hour week
(Fairwork.gov.au 2018).
Answer 4
Increase in minimum wage increases the disposable income of the workers.
Thus, purchasing power of a worker increases. He is now able to spend more money,
contributing in the increase in aggregate demand in the economy. This also contributes
in inflation in the economy. The intention of leaving the job reduces, leading to more job
satisfaction and motivation and more productivity. On the other hand, if the employer
has a restricted budget and minimum wage is increased, he might opt for a lay off if he
cannot compensate the same number of employees at higher wage. In that case, a
worker might be unemployed, which is a negative impact of rise in minimum wage.
Paraphrase This Document
Need a fresh take? Get an instant paraphrase of this document with our AI Paraphraser
10BUSINESS ECONOMICS
References
Armstrong, M., 2018. Infographic: The Countries Drinking the Most Beer. [online]
Statista Infographics. Available at: https://www.statista.com/chart/12510/the-countries-
drinking-the-most-beer/ [Accessed 3 Sep. 2018].
Carragher, N. and Chalmers, J., 2011. What are the options? pricing and taxation policy
reforms to redress excessive alcohol consumption and related harms in Australia.
[online] Bocsar.nsw.gov.au. Available at:
http://www.bocsar.nsw.gov.au/Documents/r59a.pdf [Accessed 3 Sep. 2018].
Cowell, F., 2018. Microeconomics: principles and analysis. Oxford University Press.
Fairwork.gov.au, 2018. Minimum wages. [online] Fair Work Ombudsman. Available at:
https://www.fairwork.gov.au/how-we-will-help/templates-and-guides/fact-sheets/
minimum-workplace-entitlements/minimum-wages [Accessed 3 Sep. 2018].
Ferwerda, J., 2014. Cost-benefit analysis. Chapters, pp.1-1.
Germov, J. and McIntyre, J., 2013. The rise of Australia as a wine nation. [online] The
Conversation. Available at: https://theconversation.com/the-rise-of-australia-as-a-wine-
nation-14875 [Accessed 3 Sep. 2018].
Groundwater, B., 2017. Nine countries that like a drink even more than Aussies do.
[online] Traveller. Available at: http://www.traveller.com.au/countries-that-enjoy-drinking-
alcohol-even-more-than-australia-gv2ngo [Accessed 3 Sep. 2018].
Howard, S., Gordon, R. and Jones, S. (2014). Australian alcohol policy 2001–2013 and
implications for public health. BMC Public Health, [online] 14(1). Available at:
https://www.ncbi.nlm.nih.gov/pmc/articles/PMC4155079/ [Accessed 3 Sep. 2018].
Hursh, S.R. and Roma, P.G., 2016. Behavioral economics and the analysis of
consumption and choice. Managerial and Decision Economics, 37(4-5), pp.224-238.
11BUSINESS ECONOMICS
Jirasova, R., 2016. TOP 20 beer drinking countries. [online] BFT Blog. Available at:
http://blog.businesstripfriend.com/article/top-20-beer-drinking-countries [Accessed 3
Sep. 2018].
Numbeo.com, 2018. Cost Of Living Comparison Between Australia And Czech
Republic. [online] Numbeo.com. Available at:
https://www.numbeo.com/cost-of-living/compare_countries_result.jsp?
country1=Australia&country2=Czech+Republic [Accessed 3 Sep. 2018].
Radio.cz, 2017. Culture of Beer in the Czech Lands | Radio Prague. [online] Radio
Praha. Available at: https://www.radio.cz/en/static/czech-beer/culture [Accessed 3 Sep.
2018].
Scott, R., 2013. The Czech Relationship with Alcohol - Prague, Czech Republic. [online]
Expats.cz for Jobs in Prague - Prague Real Estate in the Czech Republic. Available at:
https://news.expats.cz/czech-culture/the-czech-relationship-with-alcohol/ [Accessed 3
Sep. 2018].
Shimer, R., 2017. Labor Markets. Journal of Political Economy, 125(6), pp.1834-1840.
Stats.oecd.org, 2018. Real minimum wages. [online] Stats.oecd.org. Available at:
https://stats.oecd.org/Index.aspx?DataSetCode=AV_AN_WAGE# [Accessed 3 Sep.
2018].
Varian, H.R., 2014. Intermediate Microeconomics: A Modern Approach: Ninth
International Student Edition. WW Norton & Company.
World Bank, 2018. Inflation, consumer prices (annual %) | Data. [online]
Data.worldbank.org. Available at: https://data.worldbank.org/indicator/FP.CPI.TOTL.ZG
[Accessed 3 Sep. 2018].
⊘ This is a preview!⊘
Do you want full access?
Subscribe today to unlock all pages.
Trusted by 1+ million students worldwide
1 out of 12
Related Documents


Your All-in-One AI-Powered Toolkit for Academic Success.
+13062052269
info@desklib.com
Available 24*7 on WhatsApp / Email
![[object Object]](/_next/static/media/star-bottom.7253800d.svg)
Unlock your academic potential
Copyright © 2020–2026 A2Z Services. All Rights Reserved. Developed and managed by ZUCOL.