Finance Report: TVM, Bond Valuation, Risk, and Company Performance
VerifiedAdded on  2023/01/23
|21
|3440
|67
Report
AI Summary
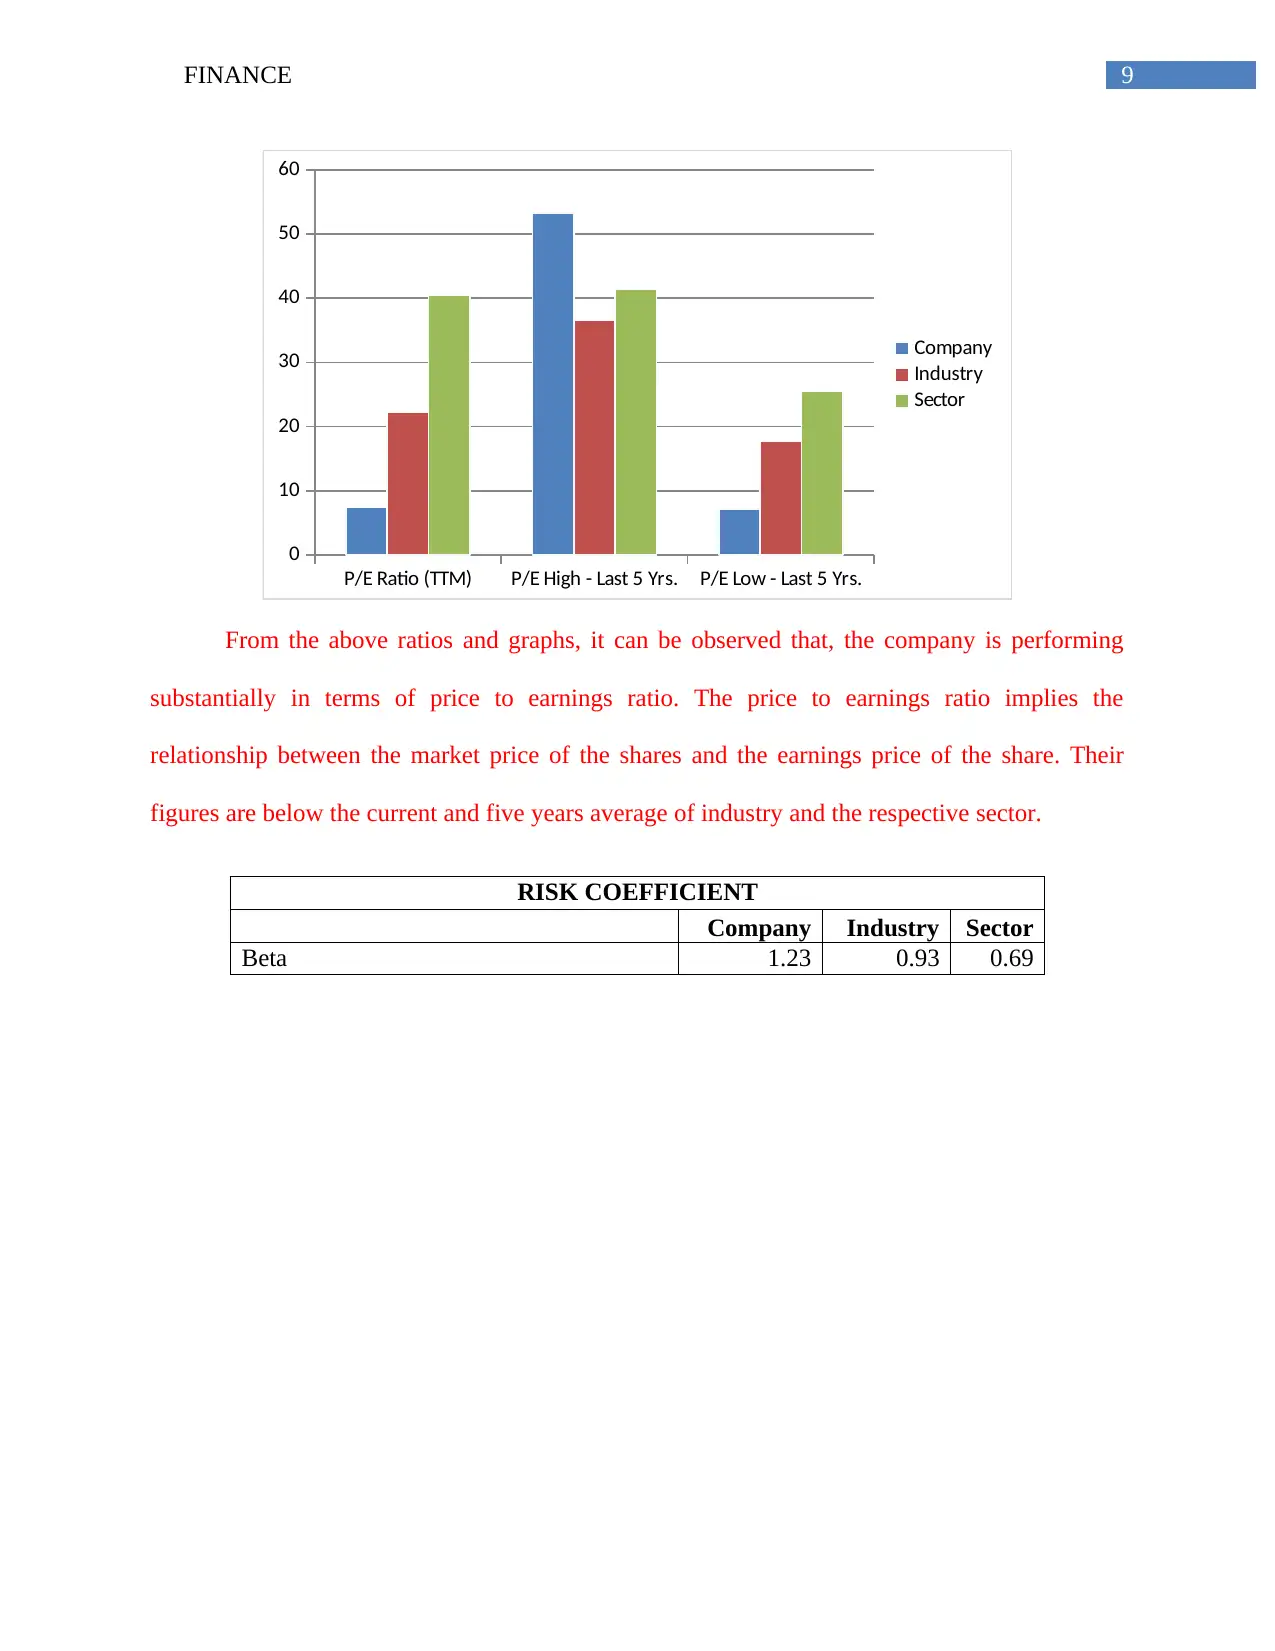
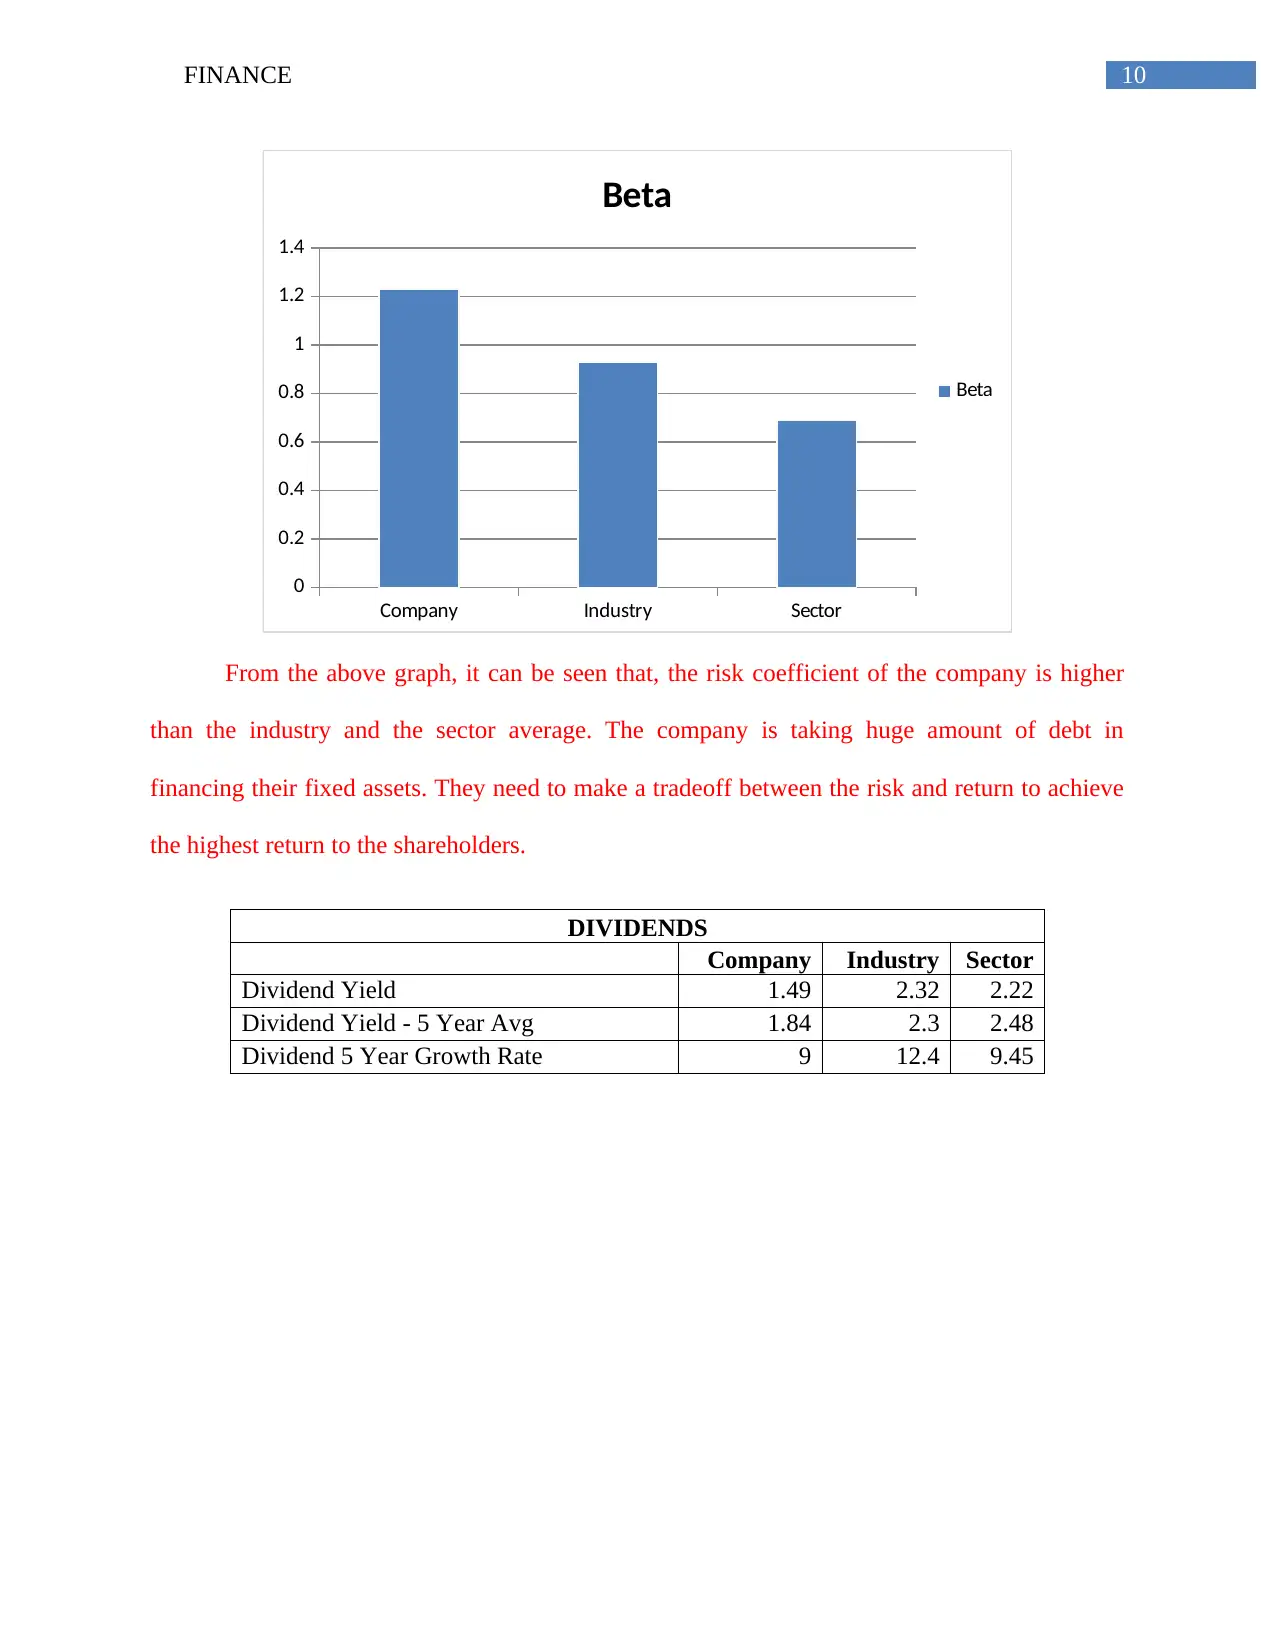
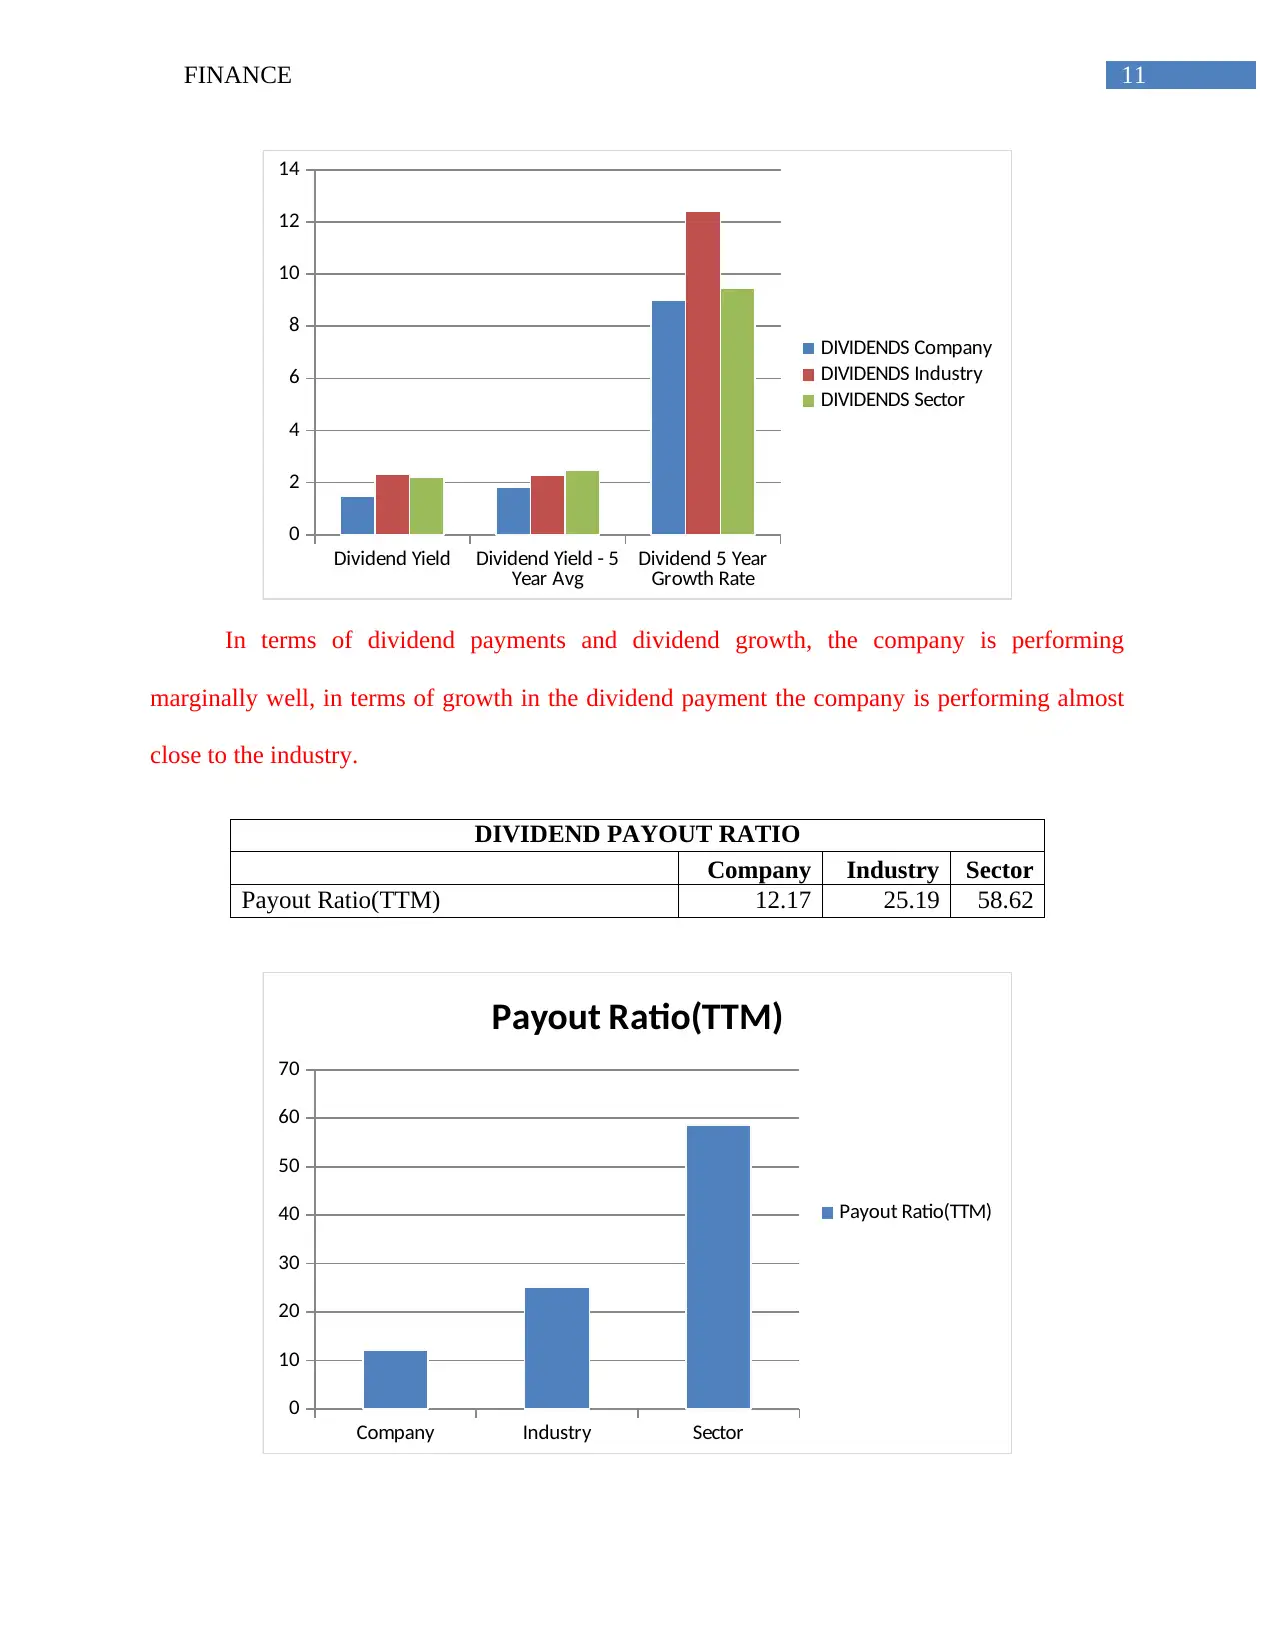
This finance report presents a comprehensive analysis of various financial concepts and a case study of Bega Cheese Limited. The report begins with an examination of the time value of money (TVM) and bond valuation, including calculations of discounted values, expected revenue, effective interest rates, installment amounts, and yield to maturity. It then delves into risk and return estimates, applying the Capital Asset Pricing Model (CAPM) to determine expected rates of return for different companies and portfolios. Finally, the report provides an overview of Bega Cheese Limited, evaluating its financial performance through key ratios and graphical representations, including price-to-earnings ratio, beta, dividend yield, and profitability metrics, offering insights into the company's strengths and weaknesses and concluding with recommendations based on the analysis.

Running head: FINANCE
Finance
Name of the Student:
Name of the University:
Author’s note:
Finance
Name of the Student:
Name of the University:
Author’s note:
Paraphrase This Document
Need a fresh take? Get an instant paraphrase of this document with our AI Paraphraser

1FINANCE
Table of Contents
Answer to question 1: TVM and Bond valuation............................................................................2
Sub part (a):.................................................................................................................................2
Sub part (b):.................................................................................................................................2
Sub part (c):.................................................................................................................................2
Sub part (d):.................................................................................................................................3
Sub part (e):.................................................................................................................................3
Sub part (f):..................................................................................................................................4
Answer to question 2: Risk and return estimates.............................................................................4
Sub part (a):.................................................................................................................................4
Sub part (b):.................................................................................................................................5
Answer to question 3: Risk and return analysis of the company:....................................................5
Overview of the company:...........................................................................................................5
Financial Performance:................................................................................................................5
Risk and Return measures of the company:..............................................................................12
Conclusion and recommendation:.............................................................................................13
References and bibliography:........................................................................................................14

2FINANCE
⊘ This is a preview!⊘
Do you want full access?
Subscribe today to unlock all pages.

Trusted by 1+ million students worldwide

3FINANCE
Answer to question 1: TVM and Bond valuation
Sub part (a):
Computation of Discounted value of the instalments
Monthly Instalment Amount $ 10,000
Number of years 4
Number of Payment per year 12
Annual Discount rate 7%
Discounted Value of the instalment $ 4,17,602
In computation of the present value of the installments, a discount rate of 7% has been
considered and a total number of 7 years have been taken. The present value of the installments
over the period is the discounted value, which the bank can allow.
Sub part (b):
Computation of Expected Revenue in 5 years with a
7.40 % growth rate
Annual Operating Revenue $ 1,438.28
Annual growth rate 7.40%
Number of Years 5
Expected annual revenue in 5 years $ 2,055.25
To arrive at the sales of the fifth year, annual sales have been compounded with the
annual growth rate. As the growth will be assumed annually, the compounding technique has
been used to arrive at the expected sales in the fifth year.
Sub part (c):
Computation of Effective Annual Interest Rates for the following loans
Loan A Loan B Loan C
Loan Amount 7.00% 7% 6.97%
Compounding terms Semi-annually Monthly Quarterly
Paraphrase This Document
Need a fresh take? Get an instant paraphrase of this document with our AI Paraphraser

4FINANCE
Compounding period in a year 2 12 4
Effective annual interest rate (EAR) 7.12% 7.18% 7.15%
Effective annual rate of interest is the equivalent rate of the same interest payment as paid
throughout the year in all those above interest-compounding periods. It can be compounded by
taking into consideration the total annual affect of the interest. The same compounding and
discounting technique has been used to compute the effective interest annually.
Sub part (d):
Computation of Instalment amount for the purchase of
property
Value of the property $ 8,11,000
Annual Interest rate 3.80%
Number of years 10
Number of payments per year 4
Quarterly Instalment Amount $ 24,466
To compute the amount of monthly installment per quarter, which is required to be paid
for purchasing the property with a financing option, the annual interest rate is converted into
quarterly interest rate as the value of the loan as the full value of the property has been
considered. The installments will be paid quarterly and hence the interest rate is to be considered
quarterly. The installment amount can be computed by compounding those figures as $24,466
per quarter.
Sub part (e):
Computation of Yield to maturity of the bond
Par value of the bond 100
Years till maturity 8
Annual coupon rate 5.60%
Current price 117

5FINANCE
Yield to maturity 3.16%
Yield to maturity means the total return as a percentage of the investment, which can be
earned by holding the investment till the maturity. The present value of the investment is more
than the face value; it means the investor will be realizing a less amount than his investment
from the capital yield. Hence, the total yield to maturity becomes less than the coupon rate. From
such type of an investment a total of 3.16% can be earned by holding it till the maturity.
Sub part (f):
Computation of Coupon payment for a required rate of return
Par value of the bond $ 1,000
Years till maturity 6
Number of payments per year 2
Annual coupon rate 7.00%
Required rate of return 4.10%
Current price $ 1,153
Coupon payment $ 51
To compute the Coupon payment of the bond, Firstly, the present value of the bond is
calculated by considering the required rate of return, and then, the coupon payment has been
calculated by applying the PMT formula and taking the coupon rate.
Answer to question 2: Risk and return estimates
Sub part (a):
Computation of Expected rate of return Under CAPM
model
Particulars BGA Hypothetical
Company
Risk free rate 1.94% 1.94%
⊘ This is a preview!⊘
Do you want full access?
Subscribe today to unlock all pages.

Trusted by 1+ million students worldwide

6FINANCE
Market risk premium 6% 6%
Risk coefficient (Beta) 1.23 -0.2
Expected return 9.32% 0.74%
The risk free rate has been taken as the yield to maturity of 10 years Australian bond as
per recent sources and records. The risk coefficient of the company or the company beta has
been taken as 1.23 as per the recent source as on 20 April 2019. Taking all those risk factors and
applying the CAPM model the expected rate of return of the company has been computed as
9.23%. It can be evidenced that the risk coefficient of the company is higher that is why the
expected rate of return is higher. On the other hand, as the second company is having a negative
risk coefficient, the expected rate of return is very low.
Sub part (b):
Computation of portfolio beta and expected return
Percentage of shares in the portfolio 50% 50%
Expected Return 9.32% 0.74%
Beta of the company 1.23 -0.2
Weightage of beta in the portfolio 0.615 -0.1
Port Folio Beta 0.52
Expected Portfolio return 5.03%
The portfolio has been constructed taking 50% of the BGA stocks and 50% of the second
company. The portfolio beta has been computed taking the two beta multiplied by respective
weight. The expected rate of return is computed by applying the CAPM model considering the
portfolio beta, risk free rate and the risk premium.
Paraphrase This Document
Need a fresh take? Get an instant paraphrase of this document with our AI Paraphraser

7FINANCE
Answer to question 3: Risk and return analysis of the company:
Overview of the company:
Bega Cheese Limited is an Australian company dealing in dairy and associated
agricultural products. Bega Cheese limited is an Australian stock exchange listed company and
they are known for their special cheese. They are having a huge in house farm and a production
and packaging system to meet the customers’ needs with improved, innovative and quality
products. They have been performing well financially and operationally for the last couple of
years. Their shares are currently quoting at 4.90AUD in the Australian Stock Exchange
(begacheese.com.au 2019).
Financial Performance:
Bega Cheese Limited is performing financially well for the last couple of years. As can
be seen from their annual reports and financial performance parameters, they are having a long
term growth rate of 10.56 % in their sales. They are increasing their investment and production
with the increasing demand for their products in the domestic as well as international market, but
their overall growth rate in their stock price is negative as they are having a very low net mergin
for the last year. The company is having a 37.6 total debt to equity ratio, which is below the
industry average of 51.91. it implies the company is assuming lower risk to manage their capital
structure and to finance their long term capital needs, but still they are making a well tradeoff
between their debt and equity which resulted in a 48.05 % EPS growth rate for the company,
which is only 8.07 % for the industry (reuters.com 2019). Their key financial performance
parameters and ratios can be tabulated as under with comparative charts to compare their
performance with the industry averages.

8FINANCE
Chart showing fluctuation in the share price of BEGA Cheese
VALUATION RATIOS
Company Industry Sector
P/E Ratio (TTM) 7.42 22.27 40.49
P/E High - Last 5 Yrs. 53.23 36.54 41.37
P/E Low - Last 5 Yrs. 7.17 17.69 25.46
Chart showing fluctuation in the share price of BEGA Cheese
VALUATION RATIOS
Company Industry Sector
P/E Ratio (TTM) 7.42 22.27 40.49
P/E High - Last 5 Yrs. 53.23 36.54 41.37
P/E Low - Last 5 Yrs. 7.17 17.69 25.46
⊘ This is a preview!⊘
Do you want full access?
Subscribe today to unlock all pages.

Trusted by 1+ million students worldwide

9FINANCE
P/E Ratio (TTM) P/E High - Last 5 Yrs. P/E Low - Last 5 Yrs.
0
10
20
30
40
50
60
Company
Industry
Sector
From the above ratios and graphs, it can be observed that, the company is performing
substantially in terms of price to earnings ratio. The price to earnings ratio implies the
relationship between the market price of the shares and the earnings price of the share. Their
figures are below the current and five years average of industry and the respective sector.
RISK COEFFICIENT
Company Industry Sector
Beta 1.23 0.93 0.69
Paraphrase This Document
Need a fresh take? Get an instant paraphrase of this document with our AI Paraphraser

10FINANCE
Company Industry Sector
0
0.2
0.4
0.6
0.8
1
1.2
1.4
Beta
Beta
From the above graph, it can be seen that, the risk coefficient of the company is higher
than the industry and the sector average. The company is taking huge amount of debt in
financing their fixed assets. They need to make a tradeoff between the risk and return to achieve
the highest return to the shareholders.
DIVIDENDS
Company Industry Sector
Dividend Yield 1.49 2.32 2.22
Dividend Yield - 5 Year Avg 1.84 2.3 2.48
Dividend 5 Year Growth Rate 9 12.4 9.45
Company Industry Sector
0
0.2
0.4
0.6
0.8
1
1.2
1.4
Beta
Beta
From the above graph, it can be seen that, the risk coefficient of the company is higher
than the industry and the sector average. The company is taking huge amount of debt in
financing their fixed assets. They need to make a tradeoff between the risk and return to achieve
the highest return to the shareholders.
DIVIDENDS
Company Industry Sector
Dividend Yield 1.49 2.32 2.22
Dividend Yield - 5 Year Avg 1.84 2.3 2.48
Dividend 5 Year Growth Rate 9 12.4 9.45

11FINANCE
Dividend Yield Dividend Yield - 5
Year Avg Dividend 5 Year
Growth Rate
0
2
4
6
8
10
12
14
DIVIDENDS Company
DIVIDENDS Industry
DIVIDENDS Sector
In terms of dividend payments and dividend growth, the company is performing
marginally well, in terms of growth in the dividend payment the company is performing almost
close to the industry.
DIVIDEND PAYOUT RATIO
Company Industry Sector
Payout Ratio(TTM) 12.17 25.19 58.62
Company Industry Sector
0
10
20
30
40
50
60
70
Payout Ratio(TTM)
Payout Ratio(TTM)
⊘ This is a preview!⊘
Do you want full access?
Subscribe today to unlock all pages.

Trusted by 1+ million students worldwide
1 out of 21
Related Documents
Your All-in-One AI-Powered Toolkit for Academic Success.
 +13062052269
info@desklib.com
Available 24*7 on WhatsApp / Email
Unlock your academic potential
Copyright © 2020–2025 A2Z Services. All Rights Reserved. Developed and managed by ZUCOL.


