Comprehensive Financial Analysis of Bega Cheese Limited (2014-2016)
VerifiedAdded on 2023/06/06
|13
|3564
|194
Report
AI Summary
This report presents a financial statement analysis of Bega Cheese Limited, a leading Australian dairy company, examining its performance from 2014 to 2016 using ratio analysis. The analysis reveals a decline in overall financial performance during 2015 and 2016 compared to 2014, with deteriorating profitability and increasing gearing ratios. While solvency remained normal until 2016, efficiency in managing assets like inventories and accounts receivables was lacking, leading to excessive funds tied up in these assets. The report assesses profitability using Return on Equity (ROE), Return on Assets (ROA), and Net Profit Margin (NPM), and evaluates efficiency through inventory turnover, asset turnover, and accounts receivable settlement periods. Liquidity is assessed using current and quick ratios, and gearing is also analyzed. The report concludes with recommendations and highlights the need for improved working capital management and strategic reinvestment decisions to enhance financial performance. Graphs are used to clearly represent the financial performance of Bega from different aspects.

Financial Statement Analysis
BEGA CHEESE LIMITED
BEGA CHEESE LIMITED
Paraphrase This Document
Need a fresh take? Get an instant paraphrase of this document with our AI Paraphraser
Financial Statement Analysis 1
Executive Summary:
This report presents the financial statement analysis of one of the leading dairy corporation of
Australia, Bega Cheese Limited. The company is listed on the Australian Stock Exchange.
The analysis of financial performance of the company in 2014, 2015 and 2016 is undertaken
using the ratio analysis technique. It has been observed that the overall financial performance
of Bega has declined in 2015 and 2016 as compared to 2014. The profitability position of
business have deteriorated over the last three reported years as depicted by the declining
profitability ratios and increasing gearing ratios. Though, the solvency position is normal up
till 2016 but the gearing ratios of company have shown declining trend over the 3 years.
Also, the assets like inventories and accounts receivables of Bega are not found to be
efficiently managed by the company and hence excessive funds are tied up in holding these
assets. The working capital management practices of the business are not found to be
adequate enough as indicated by the weak current and quick ratios results. The use of graphs
has been made to clearly represent the state of financial performance of Bega from different
aspects.
Financial Statement Analysis 2
Table of Contents
Executive Summary:.............................................................................................................................1
Introduction...........................................................................................................................................3
Purpose of Analysis...........................................................................................................................3
Background of Bega..........................................................................................................................3
Financial analysis of Bega Cheese Limited...........................................................................................4
Profitability........................................................................................................................................4
Efficiency:.........................................................................................................................................6
Liquidity:...........................................................................................................................................7
Gearing:.............................................................................................................................................9
Recommendations and Conclusion......................................................................................................10
References:..........................................................................................................................................12
Appendix:............................................................................................................................................14
⊘ This is a preview!⊘
Do you want full access?
Subscribe today to unlock all pages.
Trusted by 1+ million students worldwide
Financial Statement Analysis 3
Introduction
Purpose of Analysis
The financial statements of the entity are prepared to meet the information needs of its
various stakeholders. Particularly, the providers of the finance are always keen to know about
the financial performance of the company in which they have invested their funds in order to
earn return on their investments. For the purpose of evaluating the financial strengths as well
as weakness of the company use of various tools and techniques can be made. Ratio analysis
is one of those important financial management techniques, which can be used to assess the
financial health of the business. In the present report, ratio analysis is conducted on the
financial statements of the Bega Cheese Limited for the years 2014, 2015 and 2016. As a part
of ratio analysis, the key components of financial statements are taken into account and ratios
in relation to such components have been determined and analysed by making comparative
study of all the three years.
Background of Bega Cheese Limited
Bega Cheese Limited is an Australian leading producer and supplier of cheese and other
associated food products. It was incorporated in 1899. It is specialised in supplying the
cheddar cheese in the local as well as international retail and service market. Bega Limited
exports its dairy and other food products to around 40 different countries such as Middle
East, North East, Pacific Island, Southeast Asia and Central as well as South America
(Bloomberg, 2018). It contributes positively to the national economy of Australia by
exporting its products for more than $100 million annually. Bega operates within the dairy
industry of Australia. Dairy farming is regarded as one of the main sectors in Australian
economy (Dairy Australia, 2017). Australian dairy was ranked third largest agricultural
commodity in farmgate value in 2016-17. Australia’s dairy farms are primarily owner
operated Small Medium Enterprises (ACCC, 2017). Bega Limited has two main segments:
Bega Cheese segment and Tatura Milk segment. In 1993, it had set up its 1st spray dying plant
at Tatura which produced large quantities of childhood nutritional powder. Bega is also
involved in the activities of contract packaging for various private proprietor brands,
supermarket brands and products of other dairy firms into their own brand packages. Bega
Limited has gained a sound reputation in the market as one of the most trusted iconic brands
in Australian company for its cheese products.
Paraphrase This Document
Need a fresh take? Get an instant paraphrase of this document with our AI Paraphraser
Financial Statement Analysis 4
Financial analysis of Bega Cheese Limited
Profitability
2014 2015 2016
0%
5%
10%
15%
20%
25%
Return on
shareholder's
equity
Return on assets
Net profit margin
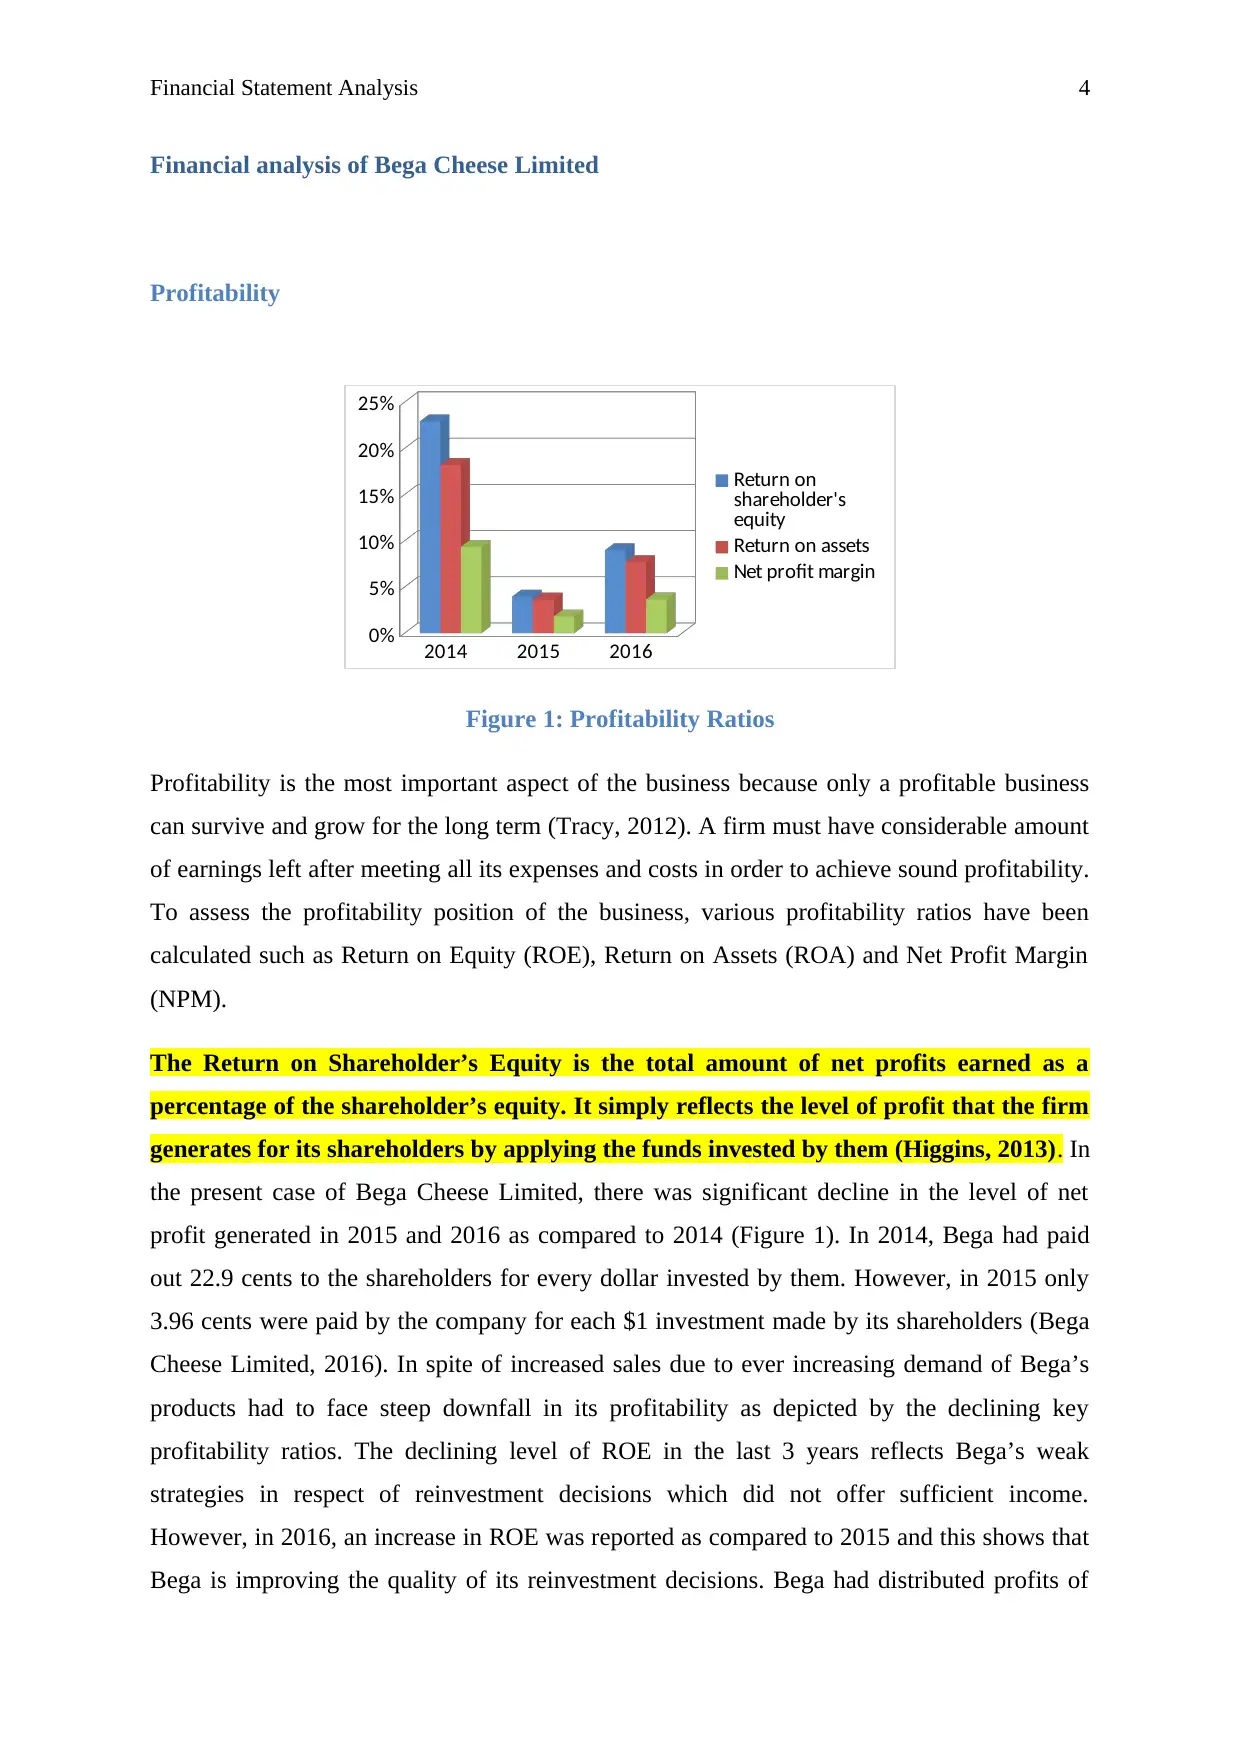
Figure 1: Profitability Ratios
Profitability is the most important aspect of the business because only a profitable business
can survive and grow for the long term (Tracy, 2012). A firm must have considerable amount
of earnings left after meeting all its expenses and costs in order to achieve sound profitability.
To assess the profitability position of the business, various profitability ratios have been
calculated such as Return on Equity (ROE), Return on Assets (ROA) and Net Profit Margin
(NPM).
The Return on Shareholder’s Equity is the total amount of net profits earned as a
percentage of the shareholder’s equity. It simply reflects the level of profit that the firm
generates for its shareholders by applying the funds invested by them (Higgins, 2013). In
the present case of Bega Cheese Limited, there was significant decline in the level of net
profit generated in 2015 and 2016 as compared to 2014 (Figure 1). In 2014, Bega had paid
out 22.9 cents to the shareholders for every dollar invested by them. However, in 2015 only
3.96 cents were paid by the company for each $1 investment made by its shareholders (Bega
Cheese Limited, 2016). In spite of increased sales due to ever increasing demand of Bega’s
products had to face steep downfall in its profitability as depicted by the declining key
profitability ratios. The declining level of ROE in the last 3 years reflects Bega’s weak
strategies in respect of reinvestment decisions which did not offer sufficient income.
However, in 2016, an increase in ROE was reported as compared to 2015 and this shows that
Bega is improving the quality of its reinvestment decisions. Bega had distributed profits of
Financial analysis of Bega Cheese Limited
Profitability
2014 2015 2016
0%
5%
10%
15%
20%
25%
Return on
shareholder's
equity
Return on assets
Net profit margin
Figure 1: Profitability Ratios
Profitability is the most important aspect of the business because only a profitable business
can survive and grow for the long term (Tracy, 2012). A firm must have considerable amount
of earnings left after meeting all its expenses and costs in order to achieve sound profitability.
To assess the profitability position of the business, various profitability ratios have been
calculated such as Return on Equity (ROE), Return on Assets (ROA) and Net Profit Margin
(NPM).
The Return on Shareholder’s Equity is the total amount of net profits earned as a
percentage of the shareholder’s equity. It simply reflects the level of profit that the firm
generates for its shareholders by applying the funds invested by them (Higgins, 2013). In
the present case of Bega Cheese Limited, there was significant decline in the level of net
profit generated in 2015 and 2016 as compared to 2014 (Figure 1). In 2014, Bega had paid
out 22.9 cents to the shareholders for every dollar invested by them. However, in 2015 only
3.96 cents were paid by the company for each $1 investment made by its shareholders (Bega
Cheese Limited, 2016). In spite of increased sales due to ever increasing demand of Bega’s
products had to face steep downfall in its profitability as depicted by the declining key
profitability ratios. The declining level of ROE in the last 3 years reflects Bega’s weak
strategies in respect of reinvestment decisions which did not offer sufficient income.
However, in 2016, an increase in ROE was reported as compared to 2015 and this shows that
Bega is improving the quality of its reinvestment decisions. Bega had distributed profits of
Financial Statement Analysis 5
8.99 cents as the dividend for every $1 of shareholder’s investment. The profit distribution in
2015 was quite lower than distribution of 22.9 cents which was made in 2014. Bega’s
profitability condition in 2016 was not as satisfactory as it was in 2014 but it was better than
that of 2015. In 2014, Bega had also earned a profit on sales of shares which had significantly
contributed to its total earnings.
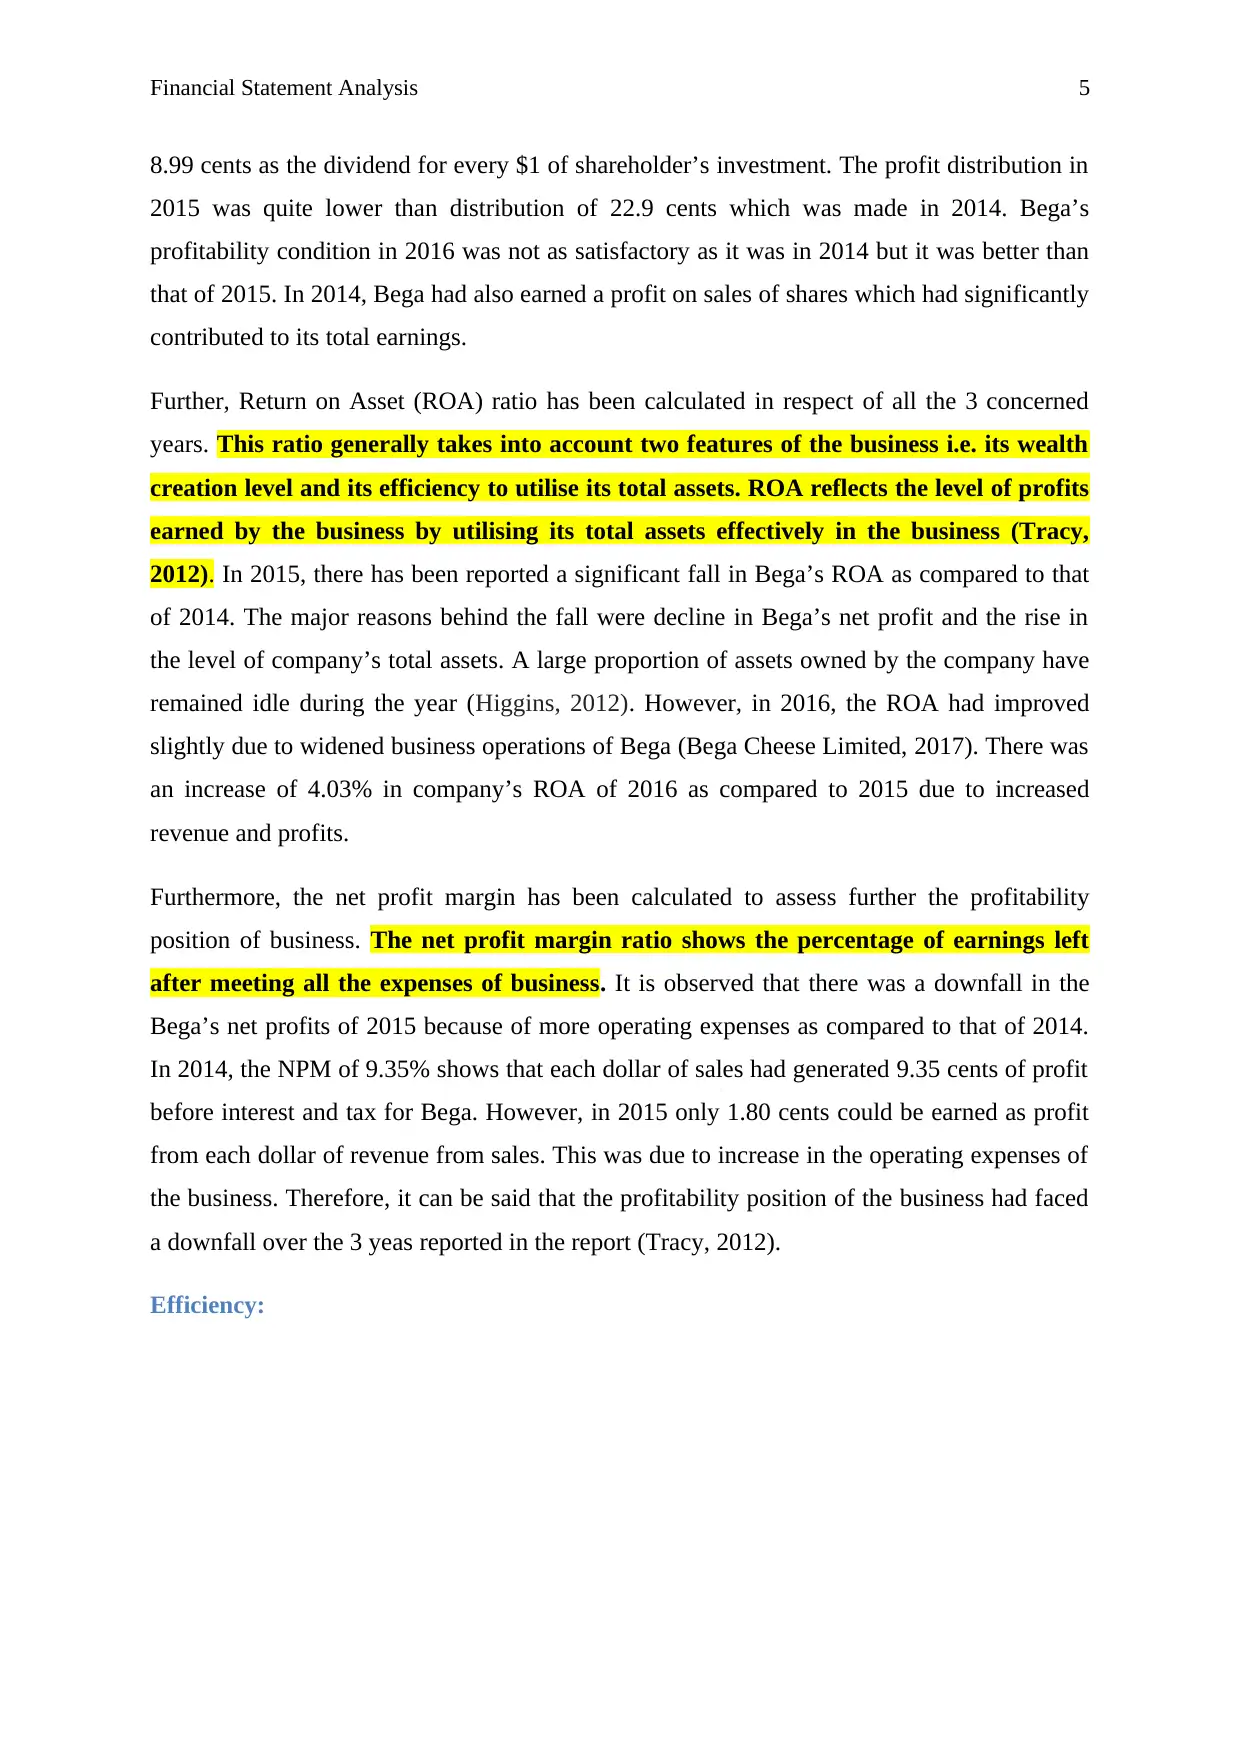
Further, Return on Asset (ROA) ratio has been calculated in respect of all the 3 concerned
years. This ratio generally takes into account two features of the business i.e. its wealth
creation level and its efficiency to utilise its total assets. ROA reflects the level of profits
earned by the business by utilising its total assets effectively in the business (Tracy,
2012). In 2015, there has been reported a significant fall in Bega’s ROA as compared to that
of 2014. The major reasons behind the fall were decline in Bega’s net profit and the rise in
the level of company’s total assets. A large proportion of assets owned by the company have
remained idle during the year (Higgins, 2012). However, in 2016, the ROA had improved
slightly due to widened business operations of Bega (Bega Cheese Limited, 2017). There was
an increase of 4.03% in company’s ROA of 2016 as compared to 2015 due to increased
revenue and profits.
Furthermore, the net profit margin has been calculated to assess further the profitability
position of business. The net profit margin ratio shows the percentage of earnings left
after meeting all the expenses of business. It is observed that there was a downfall in the
Bega’s net profits of 2015 because of more operating expenses as compared to that of 2014.
In 2014, the NPM of 9.35% shows that each dollar of sales had generated 9.35 cents of profit
before interest and tax for Bega. However, in 2015 only 1.80 cents could be earned as profit
from each dollar of revenue from sales. This was due to increase in the operating expenses of
the business. Therefore, it can be said that the profitability position of the business had faced
a downfall over the 3 yeas reported in the report (Tracy, 2012).
Efficiency:
8.99 cents as the dividend for every $1 of shareholder’s investment. The profit distribution in
2015 was quite lower than distribution of 22.9 cents which was made in 2014. Bega’s
profitability condition in 2016 was not as satisfactory as it was in 2014 but it was better than
that of 2015. In 2014, Bega had also earned a profit on sales of shares which had significantly
contributed to its total earnings.
Further, Return on Asset (ROA) ratio has been calculated in respect of all the 3 concerned
years. This ratio generally takes into account two features of the business i.e. its wealth
creation level and its efficiency to utilise its total assets. ROA reflects the level of profits
earned by the business by utilising its total assets effectively in the business (Tracy,
2012). In 2015, there has been reported a significant fall in Bega’s ROA as compared to that
of 2014. The major reasons behind the fall were decline in Bega’s net profit and the rise in
the level of company’s total assets. A large proportion of assets owned by the company have
remained idle during the year (Higgins, 2012). However, in 2016, the ROA had improved
slightly due to widened business operations of Bega (Bega Cheese Limited, 2017). There was
an increase of 4.03% in company’s ROA of 2016 as compared to 2015 due to increased
revenue and profits.
Furthermore, the net profit margin has been calculated to assess further the profitability
position of business. The net profit margin ratio shows the percentage of earnings left
after meeting all the expenses of business. It is observed that there was a downfall in the
Bega’s net profits of 2015 because of more operating expenses as compared to that of 2014.
In 2014, the NPM of 9.35% shows that each dollar of sales had generated 9.35 cents of profit
before interest and tax for Bega. However, in 2015 only 1.80 cents could be earned as profit
from each dollar of revenue from sales. This was due to increase in the operating expenses of
the business. Therefore, it can be said that the profitability position of the business had faced
a downfall over the 3 yeas reported in the report (Tracy, 2012).
Efficiency:
⊘ This is a preview!⊘
Do you want full access?
Subscribe today to unlock all pages.
Trusted by 1+ million students worldwide
Financial Statement Analysis 6
2014 2015 2016
0
20
40
60
80
100
120
140
160
180
200
Inventory turnover
period (days)
Settlement period for
Accounts Receivable
(days)
Asset Turnover
Period (days)
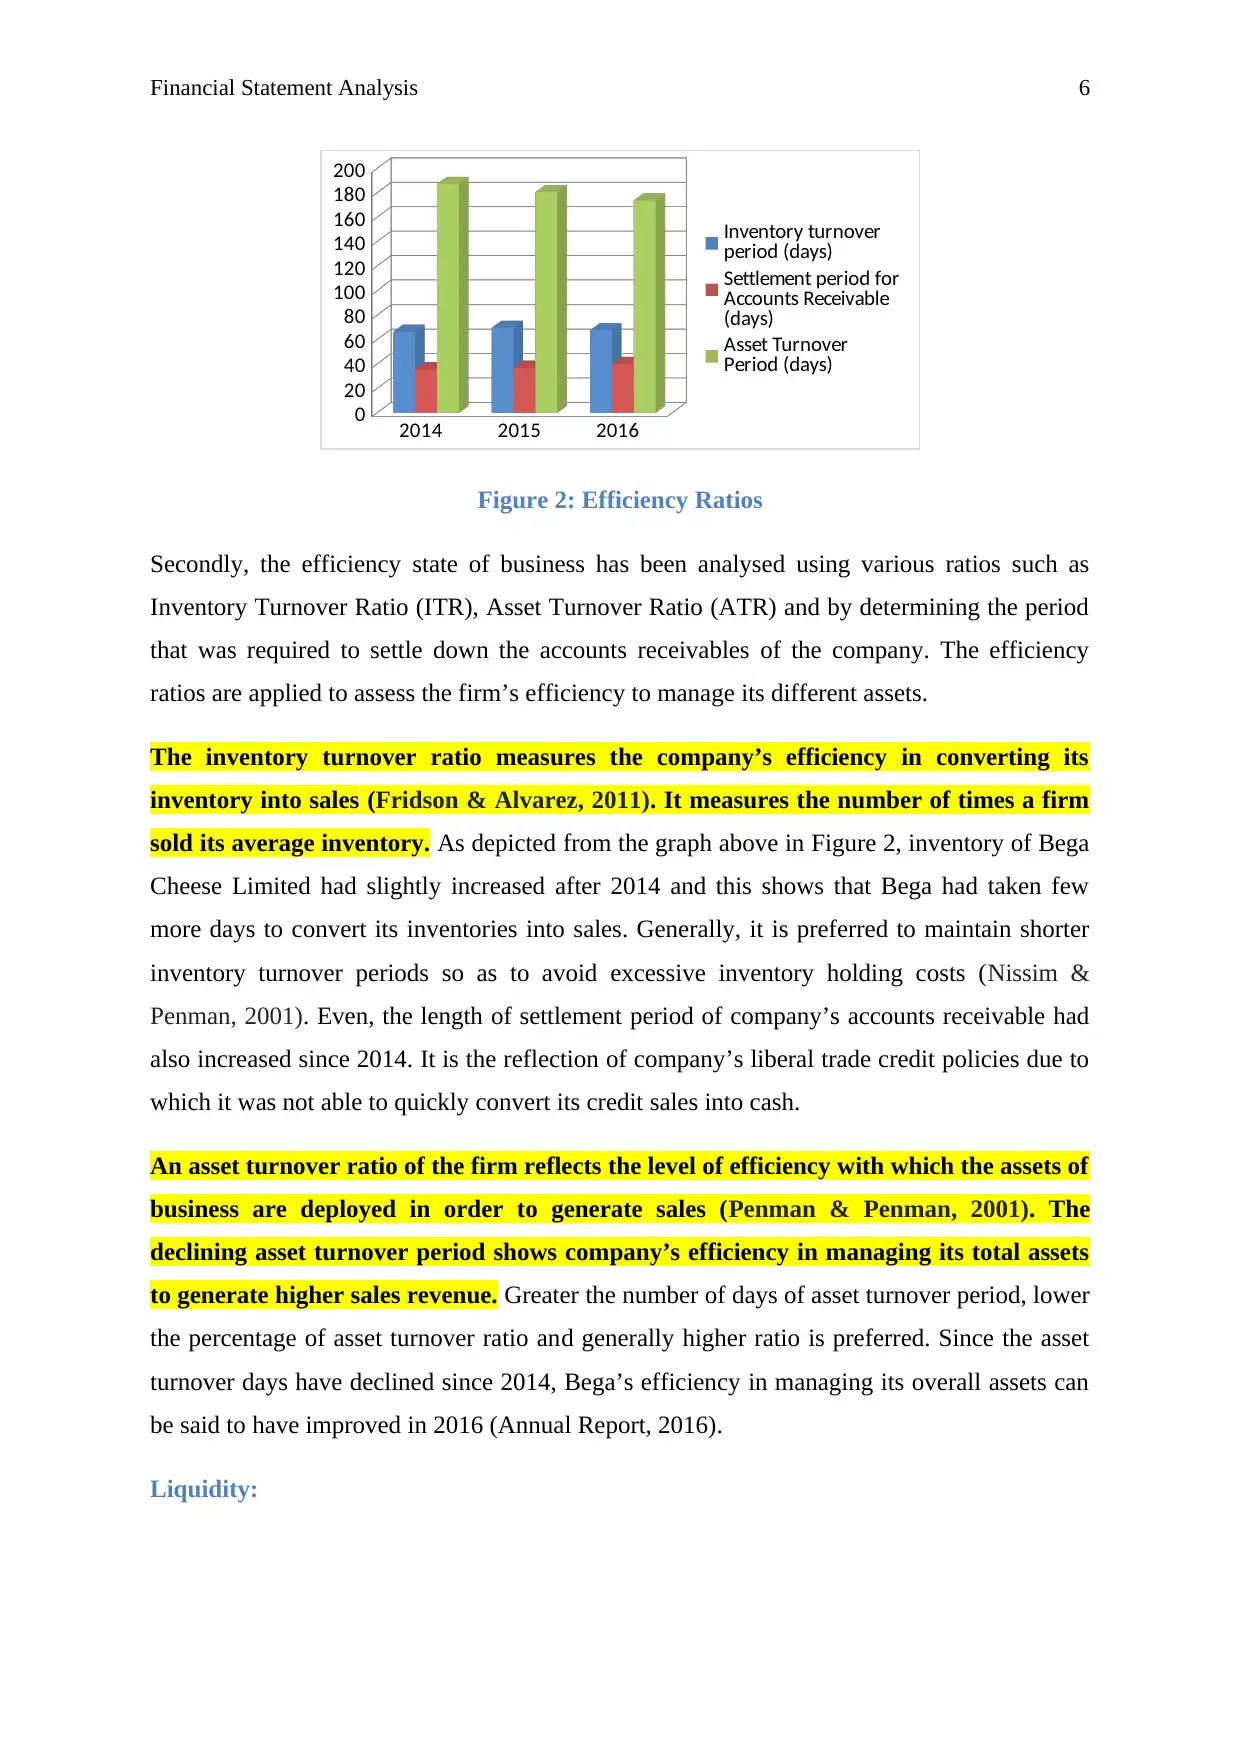
Figure 2: Efficiency Ratios
Secondly, the efficiency state of business has been analysed using various ratios such as
Inventory Turnover Ratio (ITR), Asset Turnover Ratio (ATR) and by determining the period
that was required to settle down the accounts receivables of the company. The efficiency
ratios are applied to assess the firm’s efficiency to manage its different assets.
The inventory turnover ratio measures the company’s efficiency in converting its
inventory into sales (Fridson & Alvarez, 2011). It measures the number of times a firm
sold its average inventory. As depicted from the graph above in Figure 2, inventory of Bega
Cheese Limited had slightly increased after 2014 and this shows that Bega had taken few
more days to convert its inventories into sales. Generally, it is preferred to maintain shorter
inventory turnover periods so as to avoid excessive inventory holding costs (Nissim &
Penman, 2001). Even, the length of settlement period of company’s accounts receivable had
also increased since 2014. It is the reflection of company’s liberal trade credit policies due to
which it was not able to quickly convert its credit sales into cash.
An asset turnover ratio of the firm reflects the level of efficiency with which the assets of
business are deployed in order to generate sales (Penman & Penman, 2001). The
declining asset turnover period shows company’s efficiency in managing its total assets
to generate higher sales revenue. Greater the number of days of asset turnover period, lower
the percentage of asset turnover ratio and generally higher ratio is preferred. Since the asset
turnover days have declined since 2014, Bega’s efficiency in managing its overall assets can
be said to have improved in 2016 (Annual Report, 2016).
Liquidity:
2014 2015 2016
0
20
40
60
80
100
120
140
160
180
200
Inventory turnover
period (days)
Settlement period for
Accounts Receivable
(days)
Asset Turnover
Period (days)
Figure 2: Efficiency Ratios
Secondly, the efficiency state of business has been analysed using various ratios such as
Inventory Turnover Ratio (ITR), Asset Turnover Ratio (ATR) and by determining the period
that was required to settle down the accounts receivables of the company. The efficiency
ratios are applied to assess the firm’s efficiency to manage its different assets.
The inventory turnover ratio measures the company’s efficiency in converting its
inventory into sales (Fridson & Alvarez, 2011). It measures the number of times a firm
sold its average inventory. As depicted from the graph above in Figure 2, inventory of Bega
Cheese Limited had slightly increased after 2014 and this shows that Bega had taken few
more days to convert its inventories into sales. Generally, it is preferred to maintain shorter
inventory turnover periods so as to avoid excessive inventory holding costs (Nissim &
Penman, 2001). Even, the length of settlement period of company’s accounts receivable had
also increased since 2014. It is the reflection of company’s liberal trade credit policies due to
which it was not able to quickly convert its credit sales into cash.
An asset turnover ratio of the firm reflects the level of efficiency with which the assets of
business are deployed in order to generate sales (Penman & Penman, 2001). The
declining asset turnover period shows company’s efficiency in managing its total assets
to generate higher sales revenue. Greater the number of days of asset turnover period, lower
the percentage of asset turnover ratio and generally higher ratio is preferred. Since the asset
turnover days have declined since 2014, Bega’s efficiency in managing its overall assets can
be said to have improved in 2016 (Annual Report, 2016).
Liquidity:
Paraphrase This Document
Need a fresh take? Get an instant paraphrase of this document with our AI Paraphraser
Financial Statement Analysis 7
2014 2015 2016
0.00
0.20
0.40
0.60
0.80
1.00
1.20
1.40
1.60
1.80
2.00
Current Ratio
(times)
Quick Asset Ratio
(times)
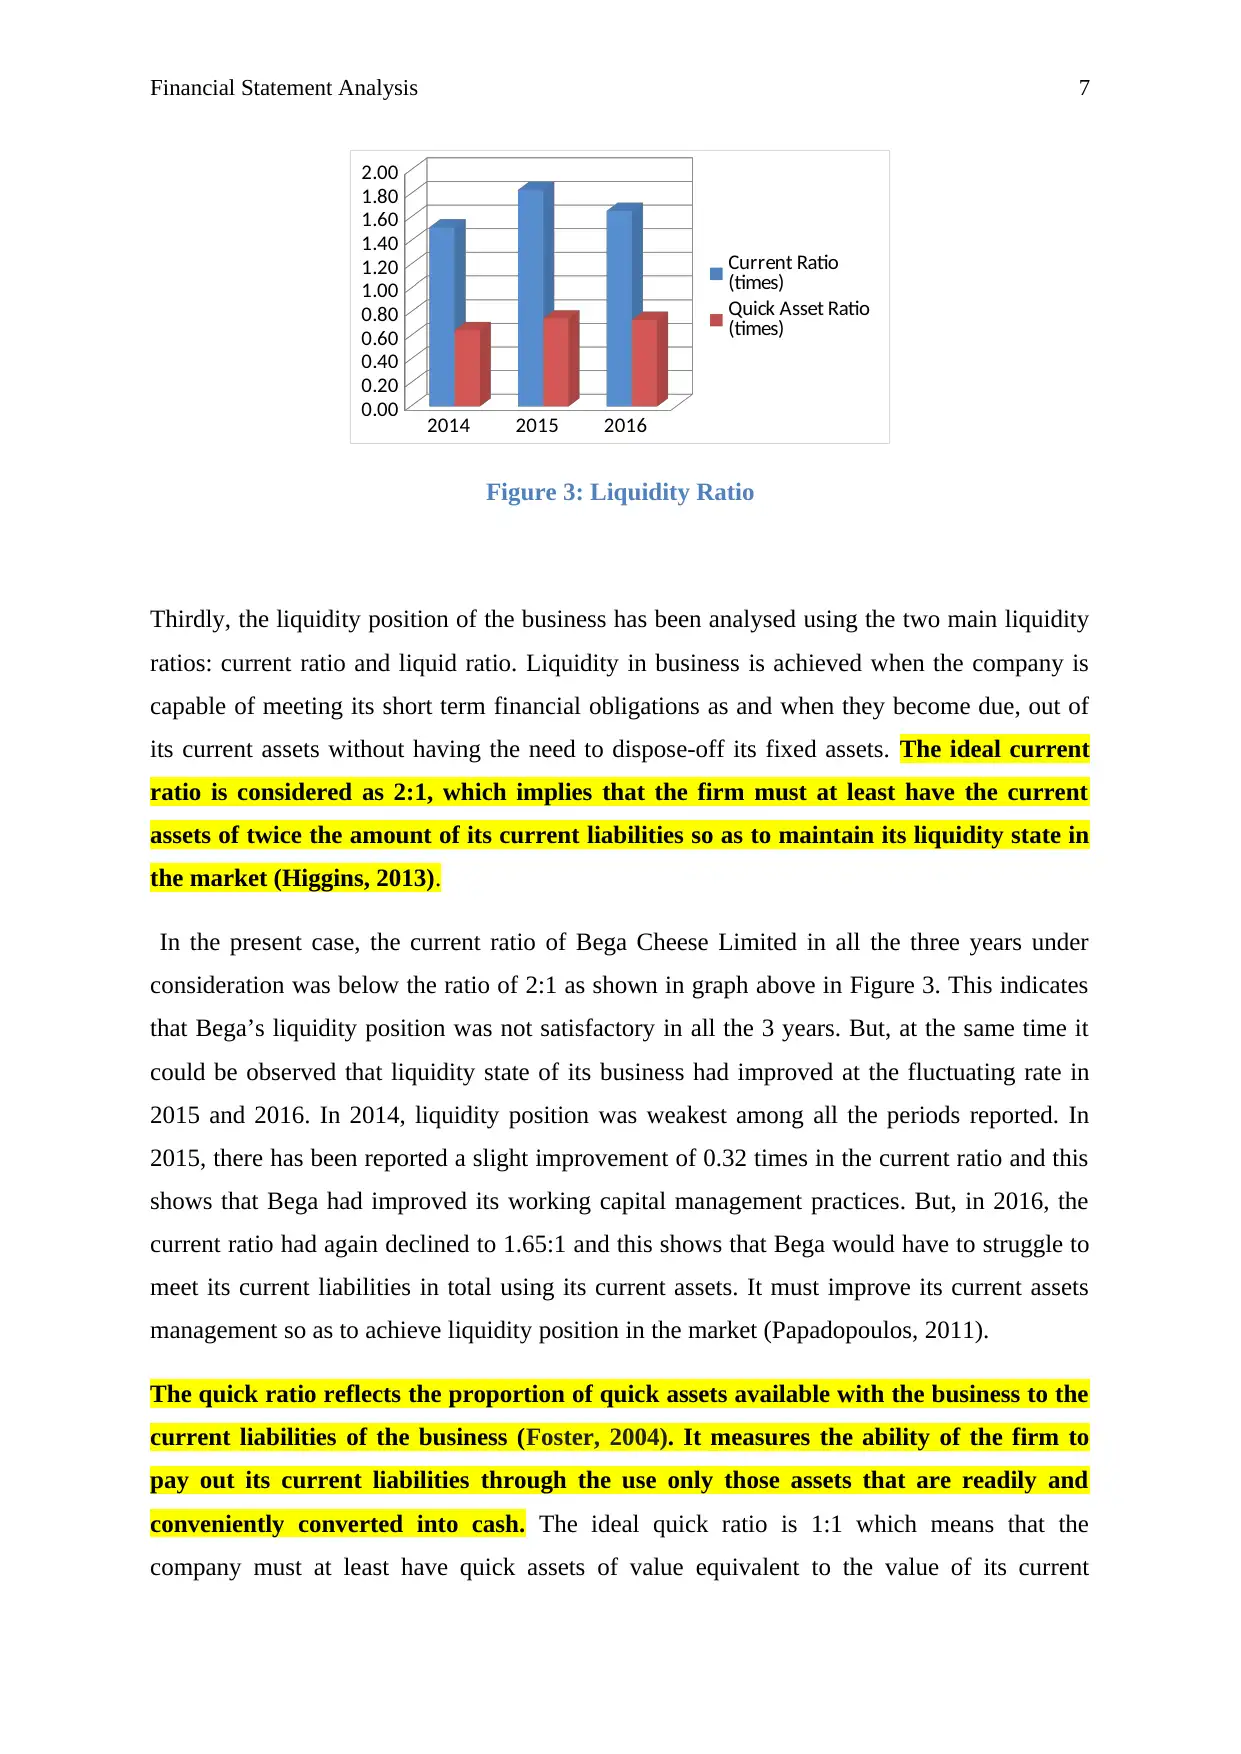
Figure 3: Liquidity Ratio
Thirdly, the liquidity position of the business has been analysed using the two main liquidity
ratios: current ratio and liquid ratio. Liquidity in business is achieved when the company is
capable of meeting its short term financial obligations as and when they become due, out of
its current assets without having the need to dispose-off its fixed assets. The ideal current
ratio is considered as 2:1, which implies that the firm must at least have the current
assets of twice the amount of its current liabilities so as to maintain its liquidity state in
the market (Higgins, 2013).
In the present case, the current ratio of Bega Cheese Limited in all the three years under
consideration was below the ratio of 2:1 as shown in graph above in Figure 3. This indicates
that Bega’s liquidity position was not satisfactory in all the 3 years. But, at the same time it
could be observed that liquidity state of its business had improved at the fluctuating rate in
2015 and 2016. In 2014, liquidity position was weakest among all the periods reported. In
2015, there has been reported a slight improvement of 0.32 times in the current ratio and this
shows that Bega had improved its working capital management practices. But, in 2016, the
current ratio had again declined to 1.65:1 and this shows that Bega would have to struggle to
meet its current liabilities in total using its current assets. It must improve its current assets
management so as to achieve liquidity position in the market (Papadopoulos, 2011).
The quick ratio reflects the proportion of quick assets available with the business to the
current liabilities of the business (Foster, 2004). It measures the ability of the firm to
pay out its current liabilities through the use only those assets that are readily and
conveniently converted into cash. The ideal quick ratio is 1:1 which means that the
company must at least have quick assets of value equivalent to the value of its current
2014 2015 2016
0.00
0.20
0.40
0.60
0.80
1.00
1.20
1.40
1.60
1.80
2.00
Current Ratio
(times)
Quick Asset Ratio
(times)
Figure 3: Liquidity Ratio
Thirdly, the liquidity position of the business has been analysed using the two main liquidity
ratios: current ratio and liquid ratio. Liquidity in business is achieved when the company is
capable of meeting its short term financial obligations as and when they become due, out of
its current assets without having the need to dispose-off its fixed assets. The ideal current
ratio is considered as 2:1, which implies that the firm must at least have the current
assets of twice the amount of its current liabilities so as to maintain its liquidity state in
the market (Higgins, 2013).
In the present case, the current ratio of Bega Cheese Limited in all the three years under
consideration was below the ratio of 2:1 as shown in graph above in Figure 3. This indicates
that Bega’s liquidity position was not satisfactory in all the 3 years. But, at the same time it
could be observed that liquidity state of its business had improved at the fluctuating rate in
2015 and 2016. In 2014, liquidity position was weakest among all the periods reported. In
2015, there has been reported a slight improvement of 0.32 times in the current ratio and this
shows that Bega had improved its working capital management practices. But, in 2016, the
current ratio had again declined to 1.65:1 and this shows that Bega would have to struggle to
meet its current liabilities in total using its current assets. It must improve its current assets
management so as to achieve liquidity position in the market (Papadopoulos, 2011).
The quick ratio reflects the proportion of quick assets available with the business to the
current liabilities of the business (Foster, 2004). It measures the ability of the firm to
pay out its current liabilities through the use only those assets that are readily and
conveniently converted into cash. The ideal quick ratio is 1:1 which means that the
company must at least have quick assets of value equivalent to the value of its current
Financial Statement Analysis 8
liabilities so that such liabilities could be met, whenever they fall due without facing any sort
of cash crisis in meeting those obligations. Looking at current and quick ratios in all the 3
years under consideration, it can be said that Bega had not held sufficient amount of current
assets in the business which were required to meet its current financial obligations (Innocent,
Mary & Matthew, 2013).
Gearing:
2014 2015 2016
0.00
0.05
0.10
0.15
0.20
0.25
0.30
0.35
0.40
0.45
Gearing Ratio
Debt to Assets
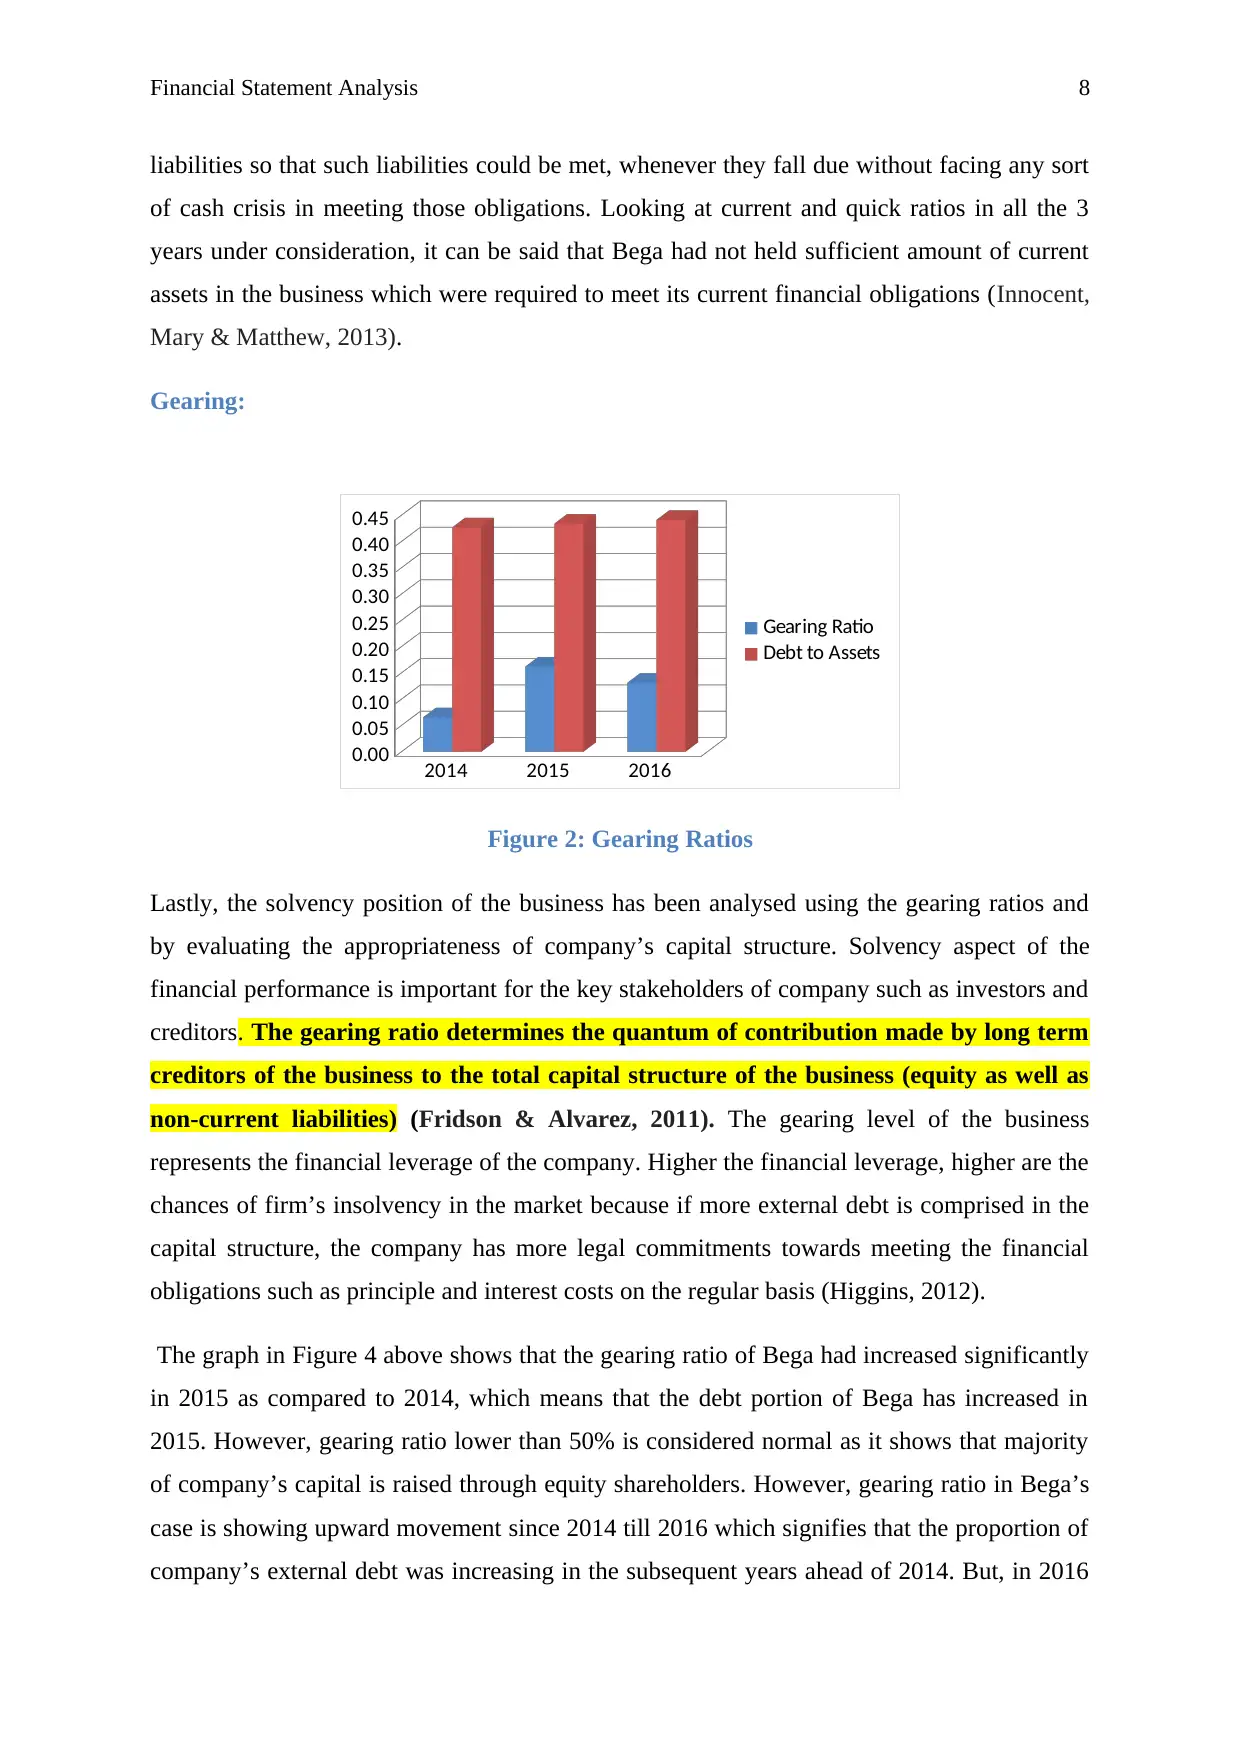
Figure 2: Gearing Ratios
Lastly, the solvency position of the business has been analysed using the gearing ratios and
by evaluating the appropriateness of company’s capital structure. Solvency aspect of the
financial performance is important for the key stakeholders of company such as investors and
creditors. The gearing ratio determines the quantum of contribution made by long term
creditors of the business to the total capital structure of the business (equity as well as
non-current liabilities) (Fridson & Alvarez, 2011). The gearing level of the business
represents the financial leverage of the company. Higher the financial leverage, higher are the
chances of firm’s insolvency in the market because if more external debt is comprised in the
capital structure, the company has more legal commitments towards meeting the financial
obligations such as principle and interest costs on the regular basis (Higgins, 2012).
The graph in Figure 4 above shows that the gearing ratio of Bega had increased significantly
in 2015 as compared to 2014, which means that the debt portion of Bega has increased in
2015. However, gearing ratio lower than 50% is considered normal as it shows that majority
of company’s capital is raised through equity shareholders. However, gearing ratio in Bega’s
case is showing upward movement since 2014 till 2016 which signifies that the proportion of
company’s external debt was increasing in the subsequent years ahead of 2014. But, in 2016
liabilities so that such liabilities could be met, whenever they fall due without facing any sort
of cash crisis in meeting those obligations. Looking at current and quick ratios in all the 3
years under consideration, it can be said that Bega had not held sufficient amount of current
assets in the business which were required to meet its current financial obligations (Innocent,
Mary & Matthew, 2013).
Gearing:
2014 2015 2016
0.00
0.05
0.10
0.15
0.20
0.25
0.30
0.35
0.40
0.45
Gearing Ratio
Debt to Assets
Figure 2: Gearing Ratios
Lastly, the solvency position of the business has been analysed using the gearing ratios and
by evaluating the appropriateness of company’s capital structure. Solvency aspect of the
financial performance is important for the key stakeholders of company such as investors and
creditors. The gearing ratio determines the quantum of contribution made by long term
creditors of the business to the total capital structure of the business (equity as well as
non-current liabilities) (Fridson & Alvarez, 2011). The gearing level of the business
represents the financial leverage of the company. Higher the financial leverage, higher are the
chances of firm’s insolvency in the market because if more external debt is comprised in the
capital structure, the company has more legal commitments towards meeting the financial
obligations such as principle and interest costs on the regular basis (Higgins, 2012).
The graph in Figure 4 above shows that the gearing ratio of Bega had increased significantly
in 2015 as compared to 2014, which means that the debt portion of Bega has increased in
2015. However, gearing ratio lower than 50% is considered normal as it shows that majority
of company’s capital is raised through equity shareholders. However, gearing ratio in Bega’s
case is showing upward movement since 2014 till 2016 which signifies that the proportion of
company’s external debt was increasing in the subsequent years ahead of 2014. But, in 2016
⊘ This is a preview!⊘
Do you want full access?
Subscribe today to unlock all pages.
Trusted by 1+ million students worldwide
Financial Statement Analysis 9
the gearing level of Bega’s business had slightly declined as compared to that of 2015 which
shows that company is trying to optimise its capital structure.
Debt to total asset ratio determines the proportion of total assets of the firm that are
financed by the external debt (Fridson & Alvarez, 2011). In 2014 and 2015 around 43% of
the total assets were financed through the use of funds of creditors and remaining 57% of the
funds were financed through the internal sources such as equity capital and retaining
earnings. However, in 2016 the debt to asset ratio of Bega had increased slightly. The debt to
total assets ratio of 44% as reported in 2016 shows that company had acquired more assets
through the use of external financing. Since the gearing ratios of company in last 3 years are
below 50%, it can be said that the company is normally geared. But, if the trend of increasing
debt to total asset ratio is further followed in the subsequent years Bega will have to face
higher financial leverage (Kumbirai, 2010).
Recommendations and Conclusion
From the above analysis it can be stated that Bega Limited’s overall financial performance
has degraded over the last three reported financial years. The profitability position of the
company was highest in 2014 among all the three years. Bega Limited must invest its funds
prudently in further acquiring its business assets so as to avoid the situations where assets
remain idle throughout the year. Also, Bega Limited must make efforts to strengthen its
liquidity position in the market in the upcoming years by employing effective working capital
management practices such as making stringent trade credit policies, applying just in time
approach for the inventory management, investing in liquid assets etc. The operating
efficiency of Bega in respect of its assets like inventories and accounts receivables is not
found to be sound because the amount that is invested in these assets is not generating any
return for the business. It should rather minimise the duration of conversion of inventories
into sales and then credit sales into cash through the implementation of strong asset
management policies. The solvency position of Bega could be said to be normal as the
proportion of external debt in the entire capital structure is lower than the proportion of
equity. However, the increasing trend of gearing ratios must be controlled by the company in
order to prevent itself from the exposure to higher financial risk.
Paraphrase This Document
Need a fresh take? Get an instant paraphrase of this document with our AI Paraphraser
Financial Statement Analysis 10
References:
ACCC, 2017. The Australian dairy industry. Available at
https://www.accc.gov.au/system/files/Farmer%2520Power_0.pdf Accessed on 12 September
2018
Bega Cheese Limited, 2016. Annual Report. Available at:
https://www.begacheese.com.au/wp-content/uploads/2012/10/04-2015-ANNUAL-
REPORT.pdf accessed on 12 September 2018
Bega Cheese Limited, 2016. Annual Report. Available at:
http://www.annualreports.com/HostedData/AnnualReports/PDF/ASX_BGA_2017.pdf
accessed on 12 September 2018
Bloomberg, 2018. Company Overview of Bega Cheese Limited. Available at:
https://www.investing.businessweek.wallst.com/research/stocks/snapshot/
snapshot_article.asp?ticker=BGA:AU accessed on 12 September 2018
Dairy Australia, 2017. The Australian dairy industry at a glance. 2016–17.Available at:
https://www.dairyaustralia.com.au/-/media/dairyaustralia/documents/about-dairy-australia/
key-publications/2017-in-focus.ashx?
la=en&hash=701F2B1E4ACFC95F62FAE99E25AE5CA4B9F7585C. accessed on 12
September 2018
Foster, G., 2004. Financial Statement Analysis, 2/e. Pearson Education India.
Fridson, M.S. and Alvarez, F., 2011. Financial statement analysis: a practitioner's
guide (Vol. 597). John Wiley & Sons.
Higgins, R.C., 2012. Analysis for financial management. McGraw-Hill/Irwin.
Innocent, E.C., Mary, O.I. and Matthew, O.M., 2013. Financial ratio analysis as a
determinant of profitability in Nigerian pharmaceutical industry. International journal of
business and management, 8(8), p.107.
Financial Statement Analysis 11
Kumbirai, M., 2010. A financial ratio analysis of commercial bank performance in South
Africa. African Review of Economics and Finance, 2(1), pp.30-53.
Nissim, D. and Penman, S.H., 2001. Ratio analysis and equity valuation: From research to
practice. Review of accounting studies, 6(1), pp.109-154.
Papadopoulos, P. 2011. Investment Report - Fundamental Analysis/ Ratio Analysis. GRIN
Verlag.
Penman, S.H. and Penman, S.H., 2001. Financial statement analysis and security valuation.
New York, NY: McGraw-Hill/Irwin.
Tracy, A. 2012. Ratio Analysis Fundamentals: How 17 Financial Ratios Can Allow You to
Analyse Any Business on the Planet. RatioAnalysis.net.
⊘ This is a preview!⊘
Do you want full access?
Subscribe today to unlock all pages.
Trusted by 1+ million students worldwide
1 out of 13
Related Documents


Your All-in-One AI-Powered Toolkit for Academic Success.
+13062052269
info@desklib.com
Available 24*7 on WhatsApp / Email
![[object Object]](/_next/static/media/star-bottom.7253800d.svg)
Unlock your academic potential
Copyright © 2020–2026 A2Z Services. All Rights Reserved. Developed and managed by ZUCOL.