Financial Analysis Report: Bega Cheese Limited Performance
VerifiedAdded on 2020/05/28
|27
|4623
|76
Report
AI Summary
This report presents a comprehensive financial analysis of Bega Cheese Ltd, evaluating its performance, financial position, and stability. The analysis encompasses key financial ratios, including profitability ratios (Return on Equity, Return on Total Assets, Net Profit Margin, Gross Profit Margin), efficiency ratios (Inventory Turnover, Accounts Receivable Turnover, Accounts Payable Turnover, Asset Turnover), and liquidity ratios (Current Ratio). The report also examines financial gearing through the gearing ratio and interest coverage. The analysis covers data from 2014 to 2016, offering insights into the company's performance trends and financial health, with the aim of providing investors with a clear understanding of Bega Cheese's financial standing and aiding in their investment decisions. The report includes an executive summary, introduction, detailed ratio calculations, graphs, and conclusions.
Company Analysis Report
Prepared for: Bega Cheese LTD
Prepared by: xxx
Prepared for: Bega Cheese LTD
Prepared by: xxx
Paraphrase This Document
Need a fresh take? Get an instant paraphrase of this document with our AI Paraphraser
1 EXECUTIVE SUMMARY
This report has been prepared to analyse and evaluate the financial position, financial
performance, financial stability, liquidity etc of Bega Cheese limited. This report has been
prepared to offer a conclusion to the investors about the financial position and the
performance of the company so that it becomes easy for them to make a decision about the
investment in the company or not. For this report, ratio study has been conducted. Firstly, the
introduction has been given about the company and the industry further; various ratios have
been measured to evaluate the financial position of the company.
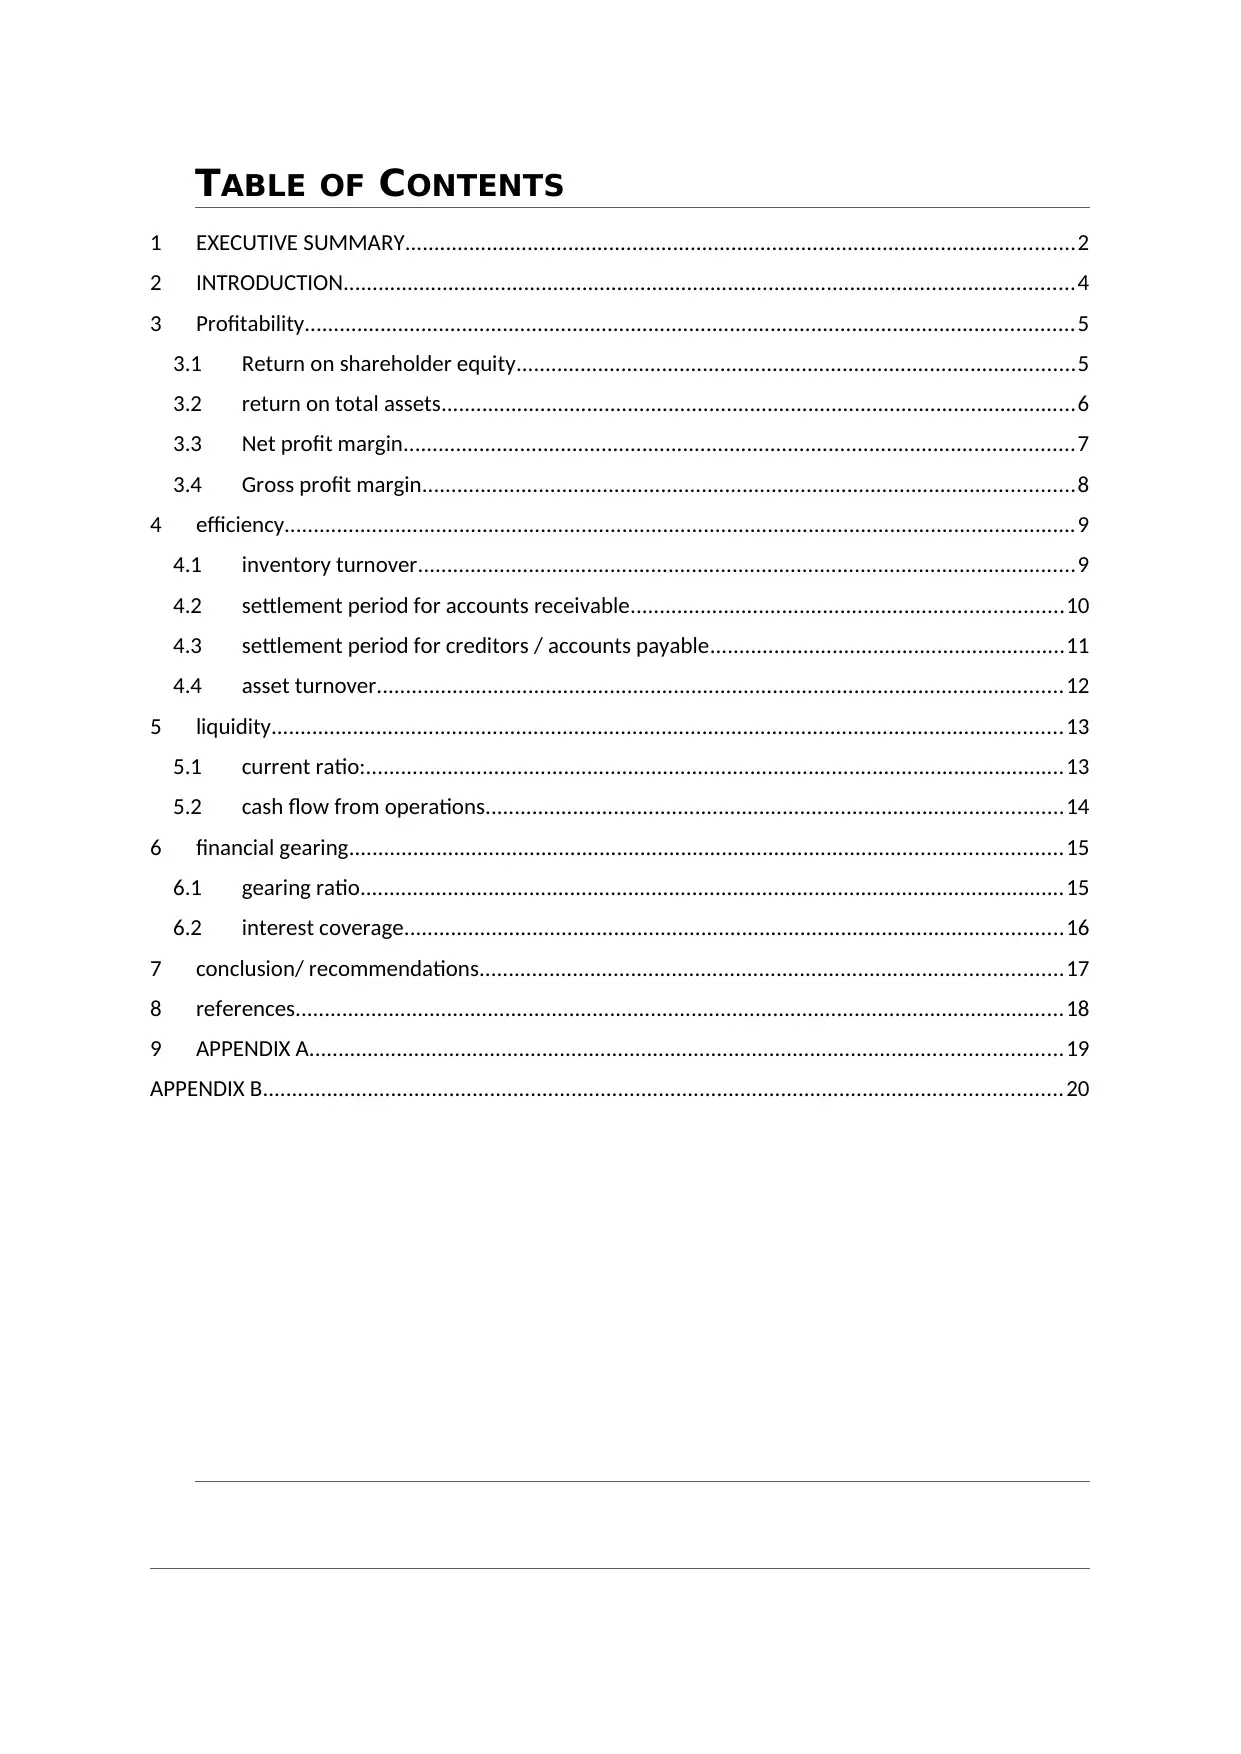
TABLE OF CONTENTS
1 EXECUTIVE SUMMARY...................................................................................................................2
2 INTRODUCTION.............................................................................................................................4
3 Profitability....................................................................................................................................5
3.1 Return on shareholder equity................................................................................................5
3.2 return on total assets.............................................................................................................6
3.3 Net profit margin...................................................................................................................7
3.4 Gross profit margin................................................................................................................8
4 efficiency........................................................................................................................................9
4.1 inventory turnover.................................................................................................................9
4.2 settlement period for accounts receivable..........................................................................10
4.3 settlement period for creditors / accounts payable.............................................................11
4.4 asset turnover......................................................................................................................12
5 liquidity........................................................................................................................................13
5.1 current ratio:........................................................................................................................13
5.2 cash flow from operations...................................................................................................14
6 financial gearing..........................................................................................................................15
6.1 gearing ratio.........................................................................................................................15
6.2 interest coverage.................................................................................................................16
7 conclusion/ recommendations....................................................................................................17
8 references....................................................................................................................................18
9 APPENDIX A.................................................................................................................................19
APPENDIX B.........................................................................................................................................20
⊘ This is a preview!⊘
Do you want full access?
Subscribe today to unlock all pages.
Trusted by 1+ million students worldwide
2 INTRODUCTION
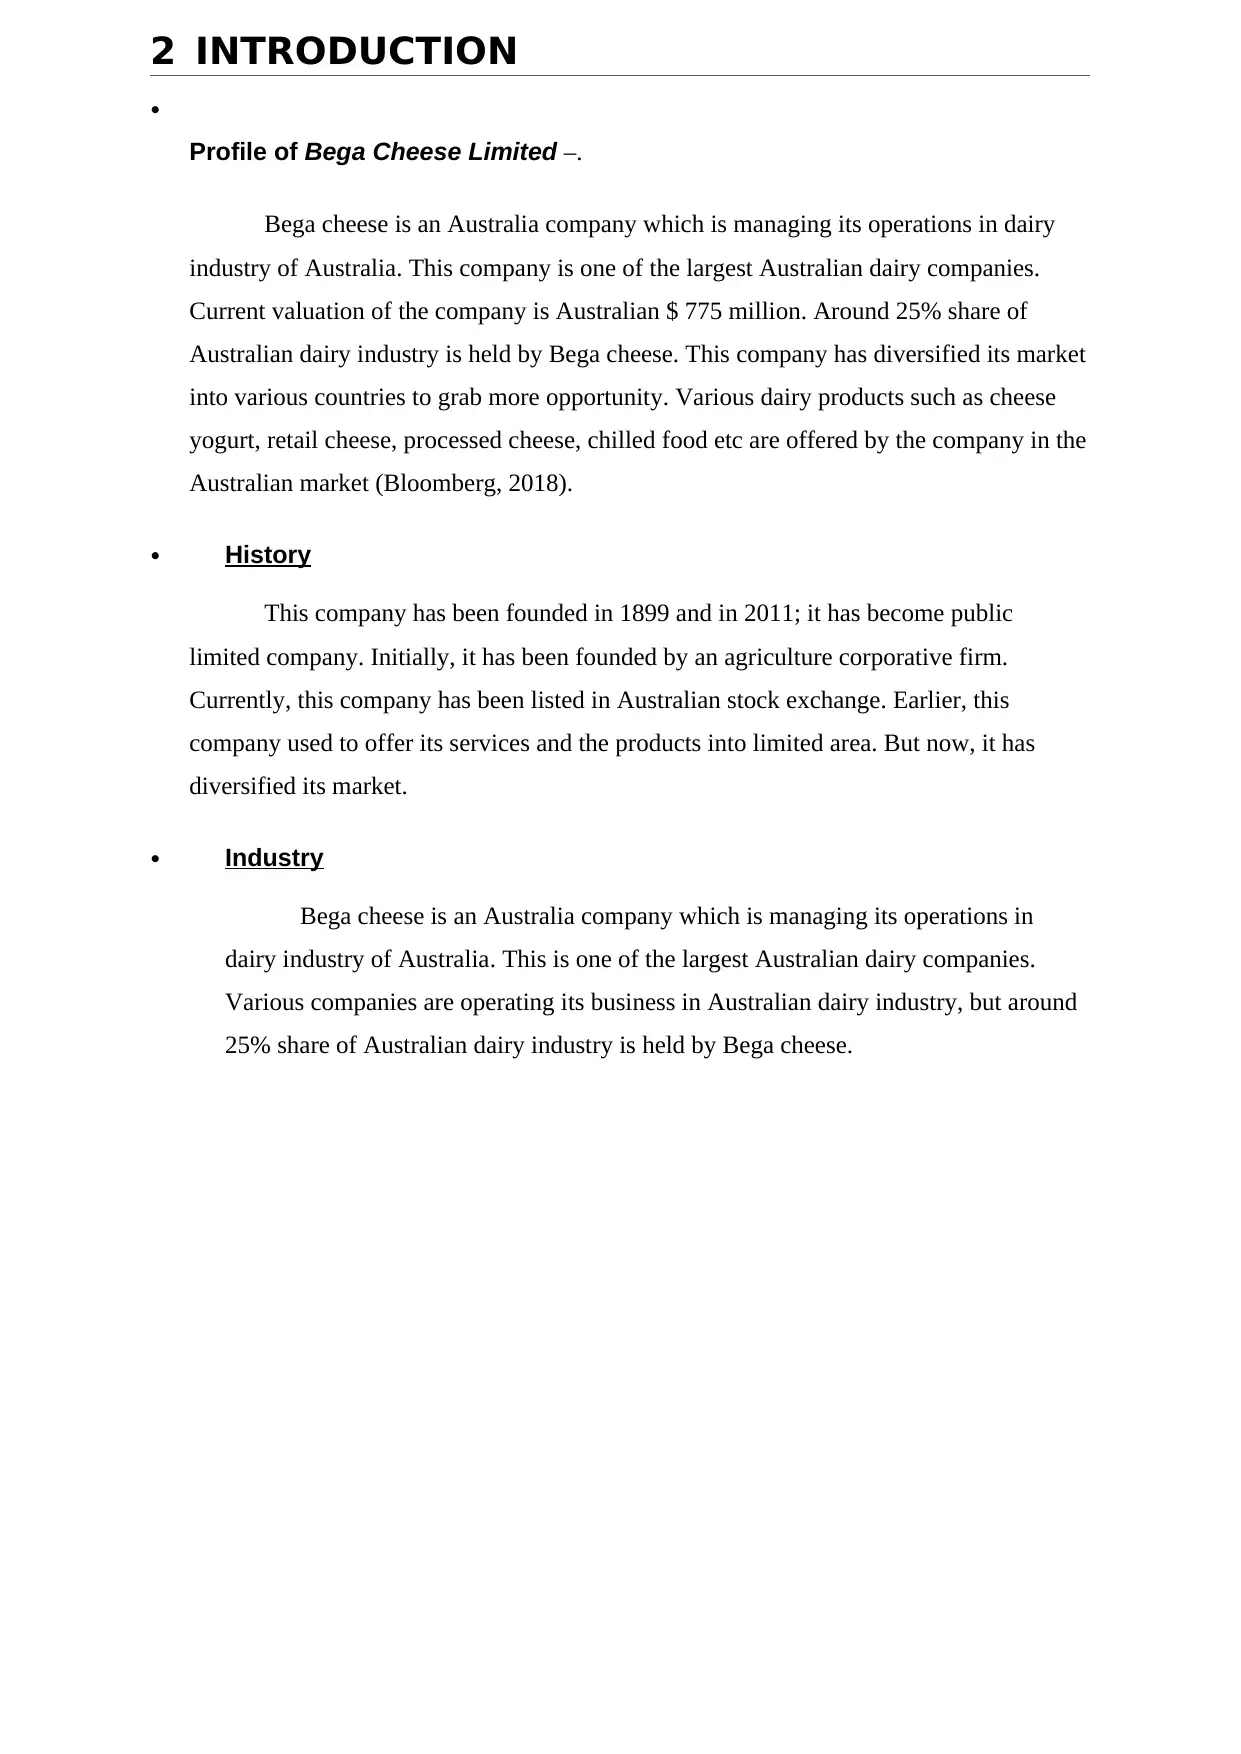
Profile of Bega Cheese Limited –.
Bega cheese is an Australia company which is managing its operations in dairy
industry of Australia. This company is one of the largest Australian dairy companies.
Current valuation of the company is Australian $ 775 million. Around 25% share of
Australian dairy industry is held by Bega cheese. This company has diversified its market
into various countries to grab more opportunity. Various dairy products such as cheese
yogurt, retail cheese, processed cheese, chilled food etc are offered by the company in the
Australian market (Bloomberg, 2018).
History
This company has been founded in 1899 and in 2011; it has become public
limited company. Initially, it has been founded by an agriculture corporative firm.
Currently, this company has been listed in Australian stock exchange. Earlier, this
company used to offer its services and the products into limited area. But now, it has
diversified its market.
Industry
Bega cheese is an Australia company which is managing its operations in
dairy industry of Australia. This is one of the largest Australian dairy companies.
Various companies are operating its business in Australian dairy industry, but around
25% share of Australian dairy industry is held by Bega cheese.
Paraphrase This Document
Need a fresh take? Get an instant paraphrase of this document with our AI Paraphraser
3 PROFITABILITY
For analysing the performance and the position of Bega cheese limited, profitability
ratios have been calculated. Profitability ratios brief the investors and the financial analyst
about the net profit, gross profit position of the company in terms of equity, share capital etc.
Following is the calculation of profitability position of company:
3.1 RETURN ON SHAREHOLDER EQUITY
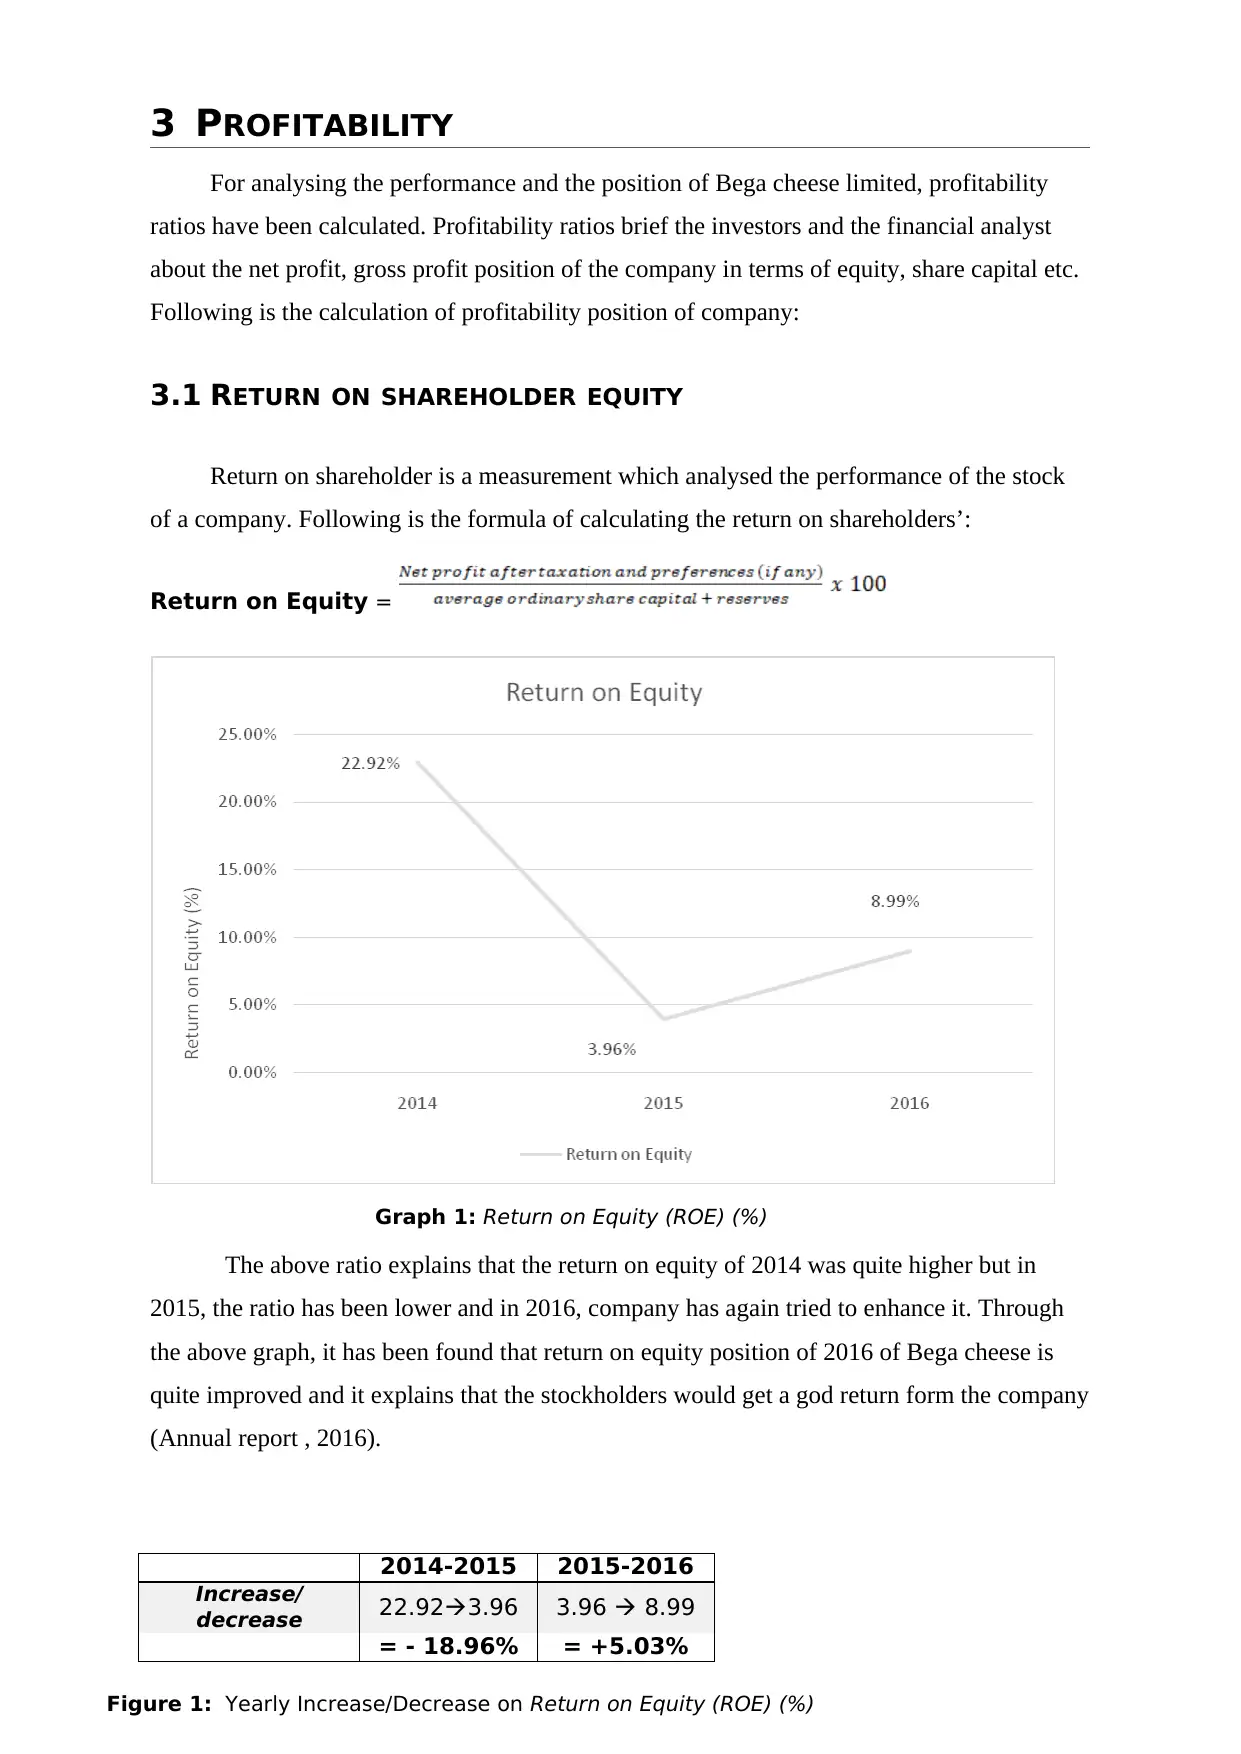
Return on shareholder is a measurement which analysed the performance of the stock
of a company. Following is the formula of calculating the return on shareholders’:
Return on Equity =
Graph 1: Return on Equity (ROE) (%)
The above ratio explains that the return on equity of 2014 was quite higher but in
2015, the ratio has been lower and in 2016, company has again tried to enhance it. Through
the above graph, it has been found that return on equity position of 2016 of Bega cheese is
quite improved and it explains that the stockholders would get a god return form the company
(Annual report , 2016).
2014-2015 2015-2016
Increase/
decrease 22.923.96 3.96 8.99
= - 18.96% = +5.03%
Figure 1: Yearly Increase/Decrease on Return on Equity (ROE) (%)
For analysing the performance and the position of Bega cheese limited, profitability
ratios have been calculated. Profitability ratios brief the investors and the financial analyst
about the net profit, gross profit position of the company in terms of equity, share capital etc.
Following is the calculation of profitability position of company:
3.1 RETURN ON SHAREHOLDER EQUITY
Return on shareholder is a measurement which analysed the performance of the stock
of a company. Following is the formula of calculating the return on shareholders’:
Return on Equity =
Graph 1: Return on Equity (ROE) (%)
The above ratio explains that the return on equity of 2014 was quite higher but in
2015, the ratio has been lower and in 2016, company has again tried to enhance it. Through
the above graph, it has been found that return on equity position of 2016 of Bega cheese is
quite improved and it explains that the stockholders would get a god return form the company
(Annual report , 2016).
2014-2015 2015-2016
Increase/
decrease 22.923.96 3.96 8.99
= - 18.96% = +5.03%
Figure 1: Yearly Increase/Decrease on Return on Equity (ROE) (%)
3.2 RETURN ON TOTAL ASSETS
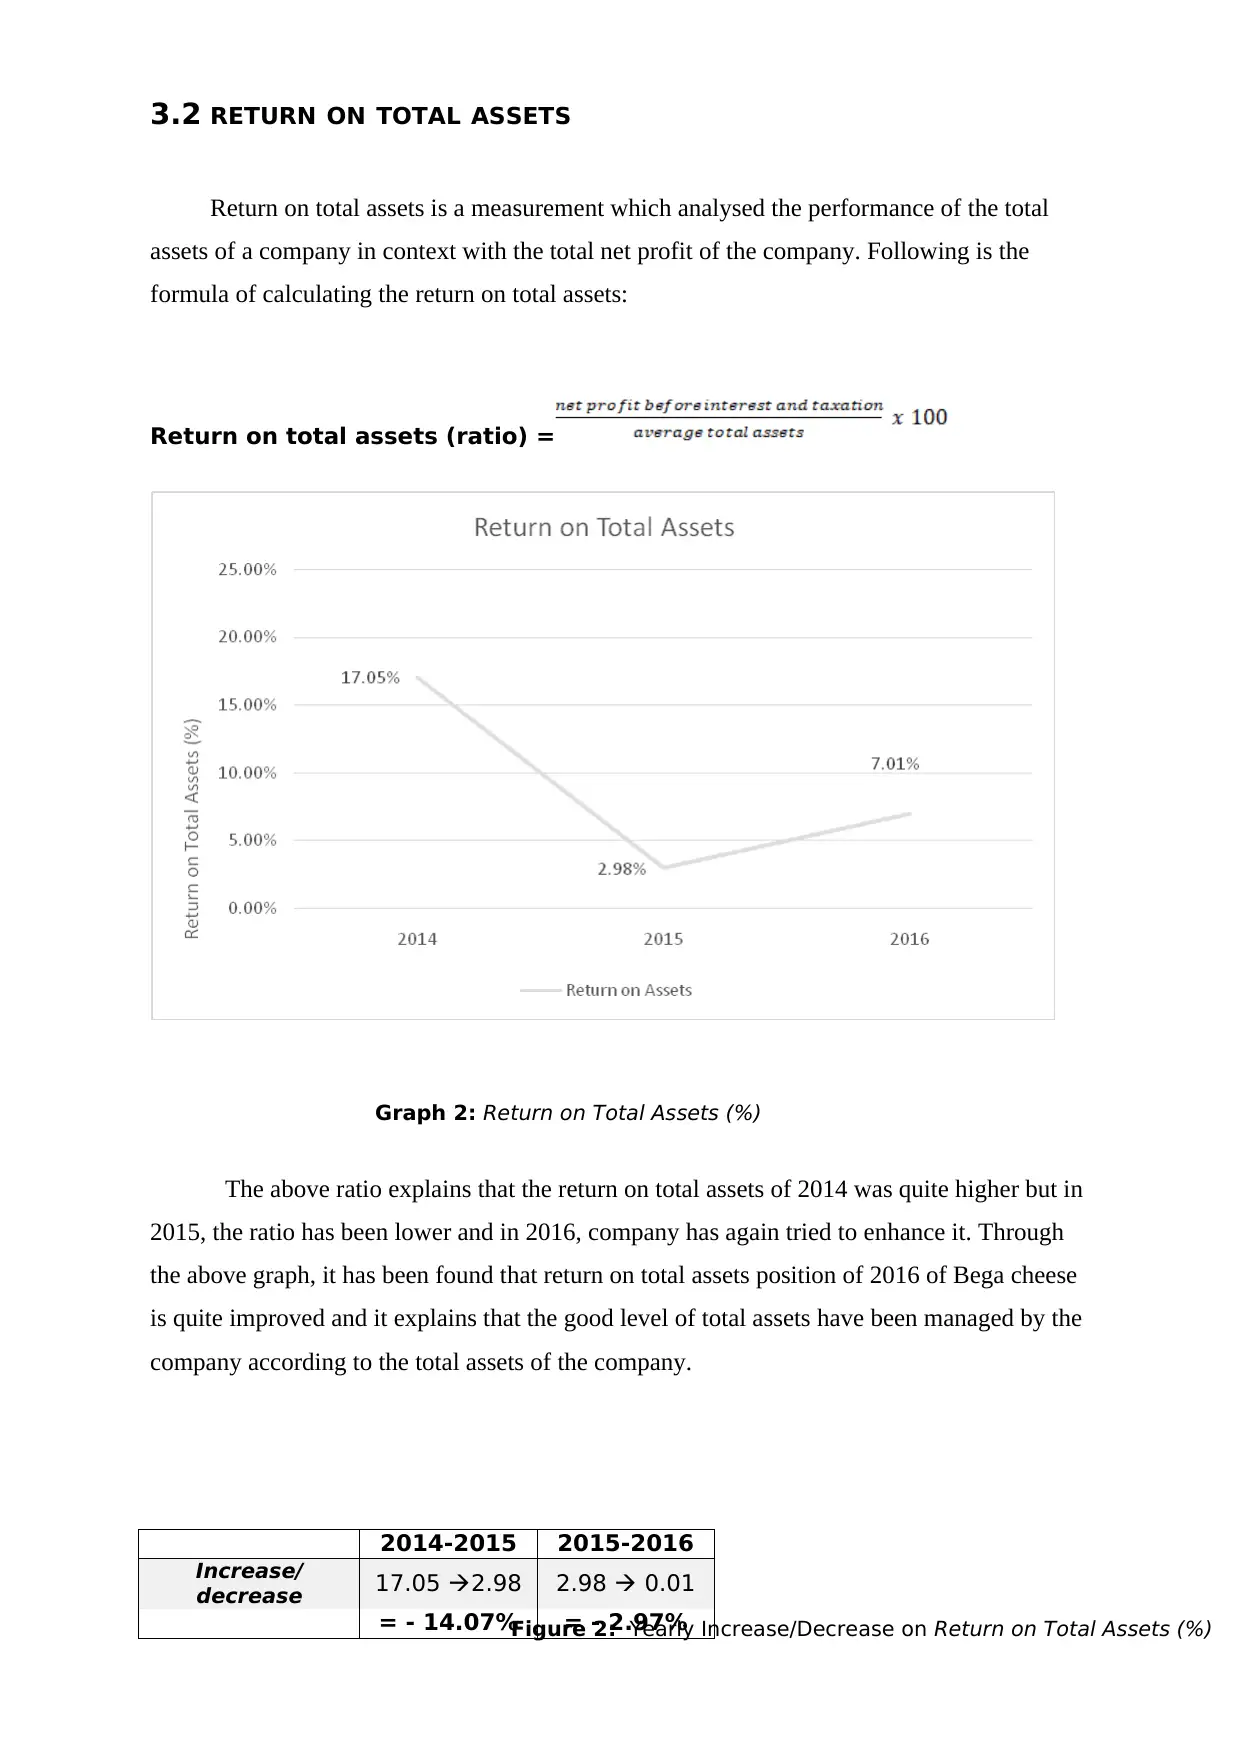
Return on total assets is a measurement which analysed the performance of the total
assets of a company in context with the total net profit of the company. Following is the
formula of calculating the return on total assets:
Return on total assets (ratio) =
Graph 2: Return on Total Assets (%)
The above ratio explains that the return on total assets of 2014 was quite higher but in
2015, the ratio has been lower and in 2016, company has again tried to enhance it. Through
the above graph, it has been found that return on total assets position of 2016 of Bega cheese
is quite improved and it explains that the good level of total assets have been managed by the
company according to the total assets of the company.
2014-2015 2015-2016
Increase/
decrease 17.05 2.98 2.98 0.01
= - 14.07% = - 2.97%Figure 2: Yearly Increase/Decrease on Return on Total Assets (%)
⊘ This is a preview!⊘
Do you want full access?
Subscribe today to unlock all pages.
Trusted by 1+ million students worldwide
3.3 NET PROFIT MARGIN
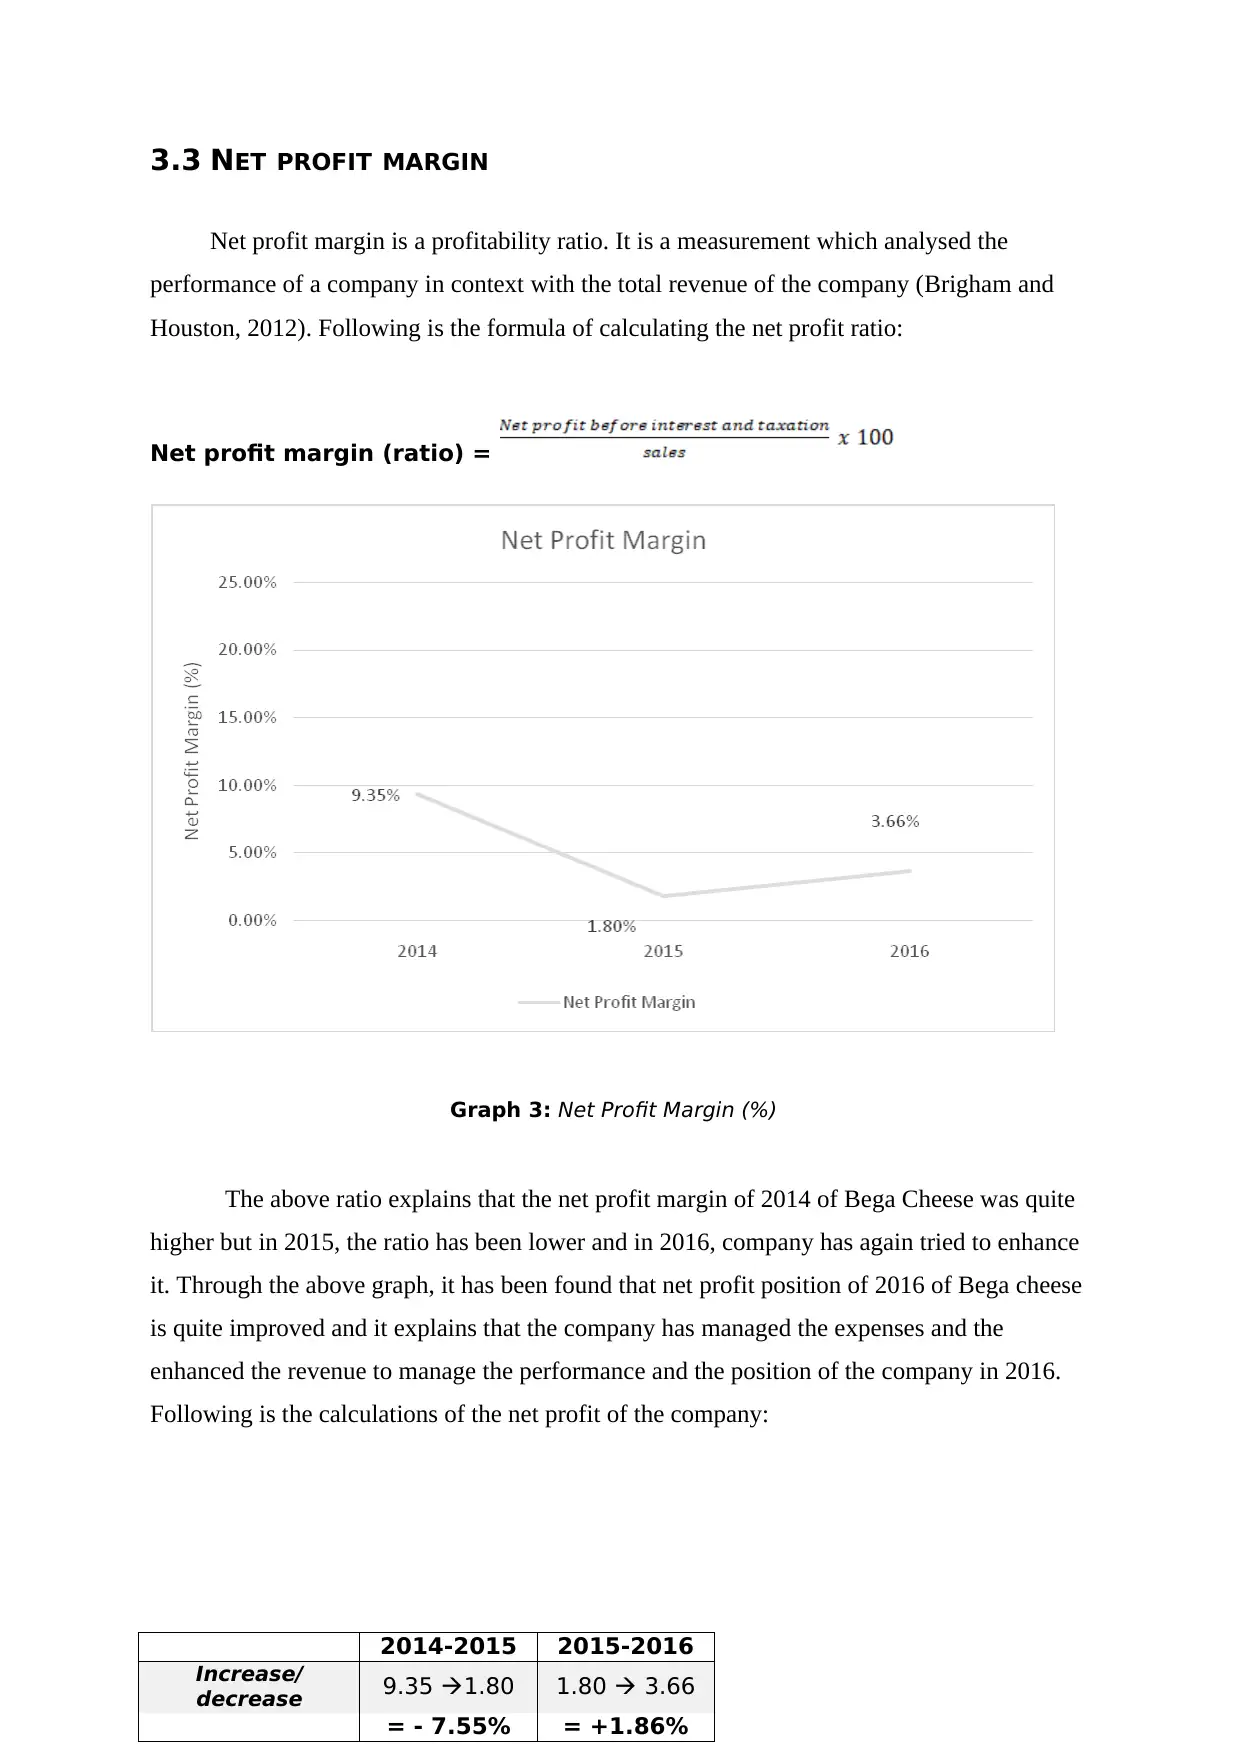
Net profit margin is a profitability ratio. It is a measurement which analysed the
performance of a company in context with the total revenue of the company (Brigham and
Houston, 2012). Following is the formula of calculating the net profit ratio:
Net profit margin (ratio) =
Graph 3: Net Profit Margin (%)
The above ratio explains that the net profit margin of 2014 of Bega Cheese was quite
higher but in 2015, the ratio has been lower and in 2016, company has again tried to enhance
it. Through the above graph, it has been found that net profit position of 2016 of Bega cheese
is quite improved and it explains that the company has managed the expenses and the
enhanced the revenue to manage the performance and the position of the company in 2016.
Following is the calculations of the net profit of the company:
2014-2015 2015-2016
Increase/
decrease 9.35 1.80 1.80 3.66
= - 7.55% = +1.86%
Paraphrase This Document
Need a fresh take? Get an instant paraphrase of this document with our AI Paraphraser
3.4 GROSS PROFIT MARGIN
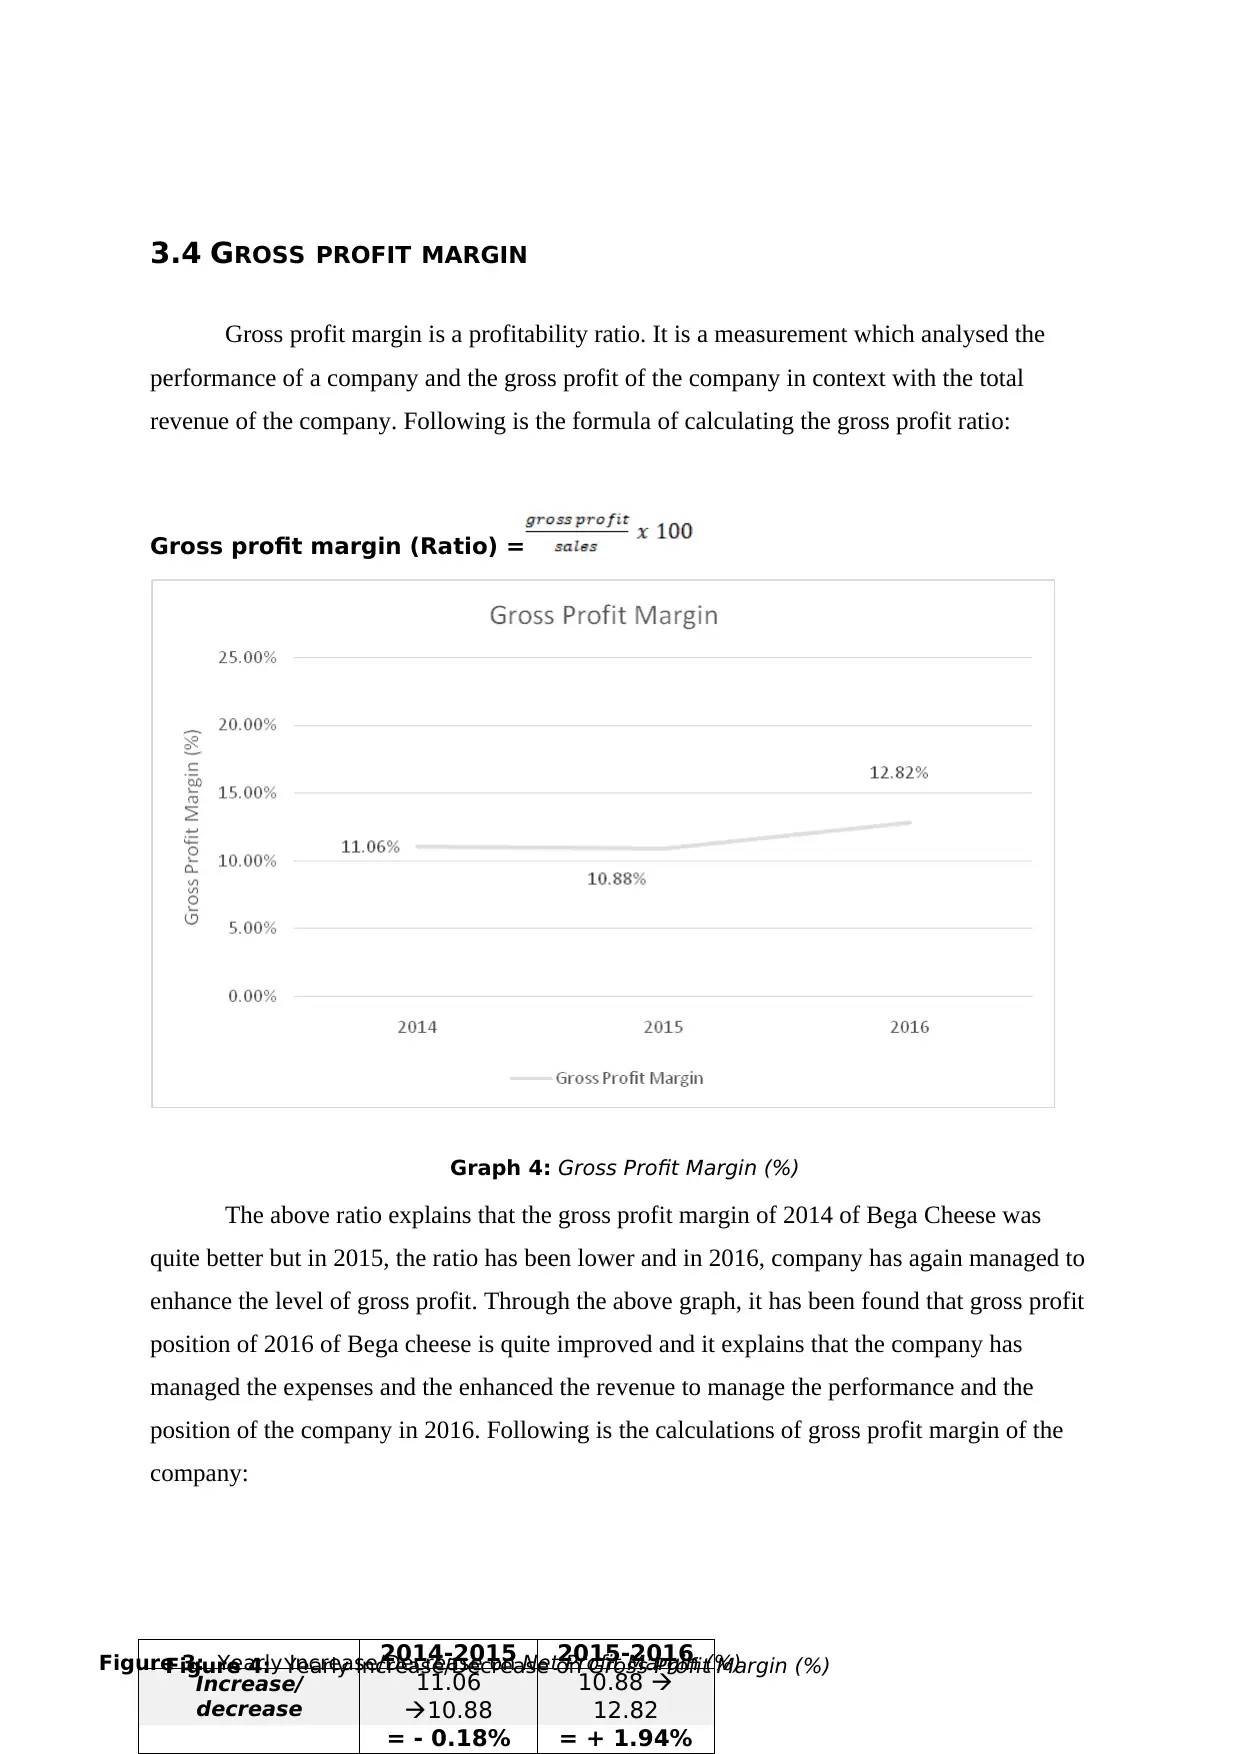
Gross profit margin is a profitability ratio. It is a measurement which analysed the
performance of a company and the gross profit of the company in context with the total
revenue of the company. Following is the formula of calculating the gross profit ratio:
Gross profit margin (Ratio) =
Graph 4: Gross Profit Margin (%)
The above ratio explains that the gross profit margin of 2014 of Bega Cheese was
quite better but in 2015, the ratio has been lower and in 2016, company has again managed to
enhance the level of gross profit. Through the above graph, it has been found that gross profit
position of 2016 of Bega cheese is quite improved and it explains that the company has
managed the expenses and the enhanced the revenue to manage the performance and the
position of the company in 2016. Following is the calculations of gross profit margin of the
company:
2014-2015 2015-2016
Increase/
decrease
11.06
10.88
10.88
12.82
= - 0.18% = + 1.94%
Figure 3: Yearly Increase/Decrease on Net Profit Margin (%)Figure 4: Yearly Increase/Decrease on Gross Profit Margin (%)
4 EFFICIENCY
For analysing the performance and the position of Bega cheese limited, efficiency
ratios have been calculated. Efficiency ratios brief the financial analyst and the managers
about the working capital management position of the company in terms of total inventory,
debtors, creditors etc. Following is the calculation of efficiency position of company:
4.1 INVENTORY TURNOVER
Inventory turnover ratio is an efficiency ratio. This ratio measures that how the
inventory could be managed in an effective manner. This measures that how much time the
inventory of the company would be turned in a period. Following is the formula of
calculating the inventory turnover ratio:
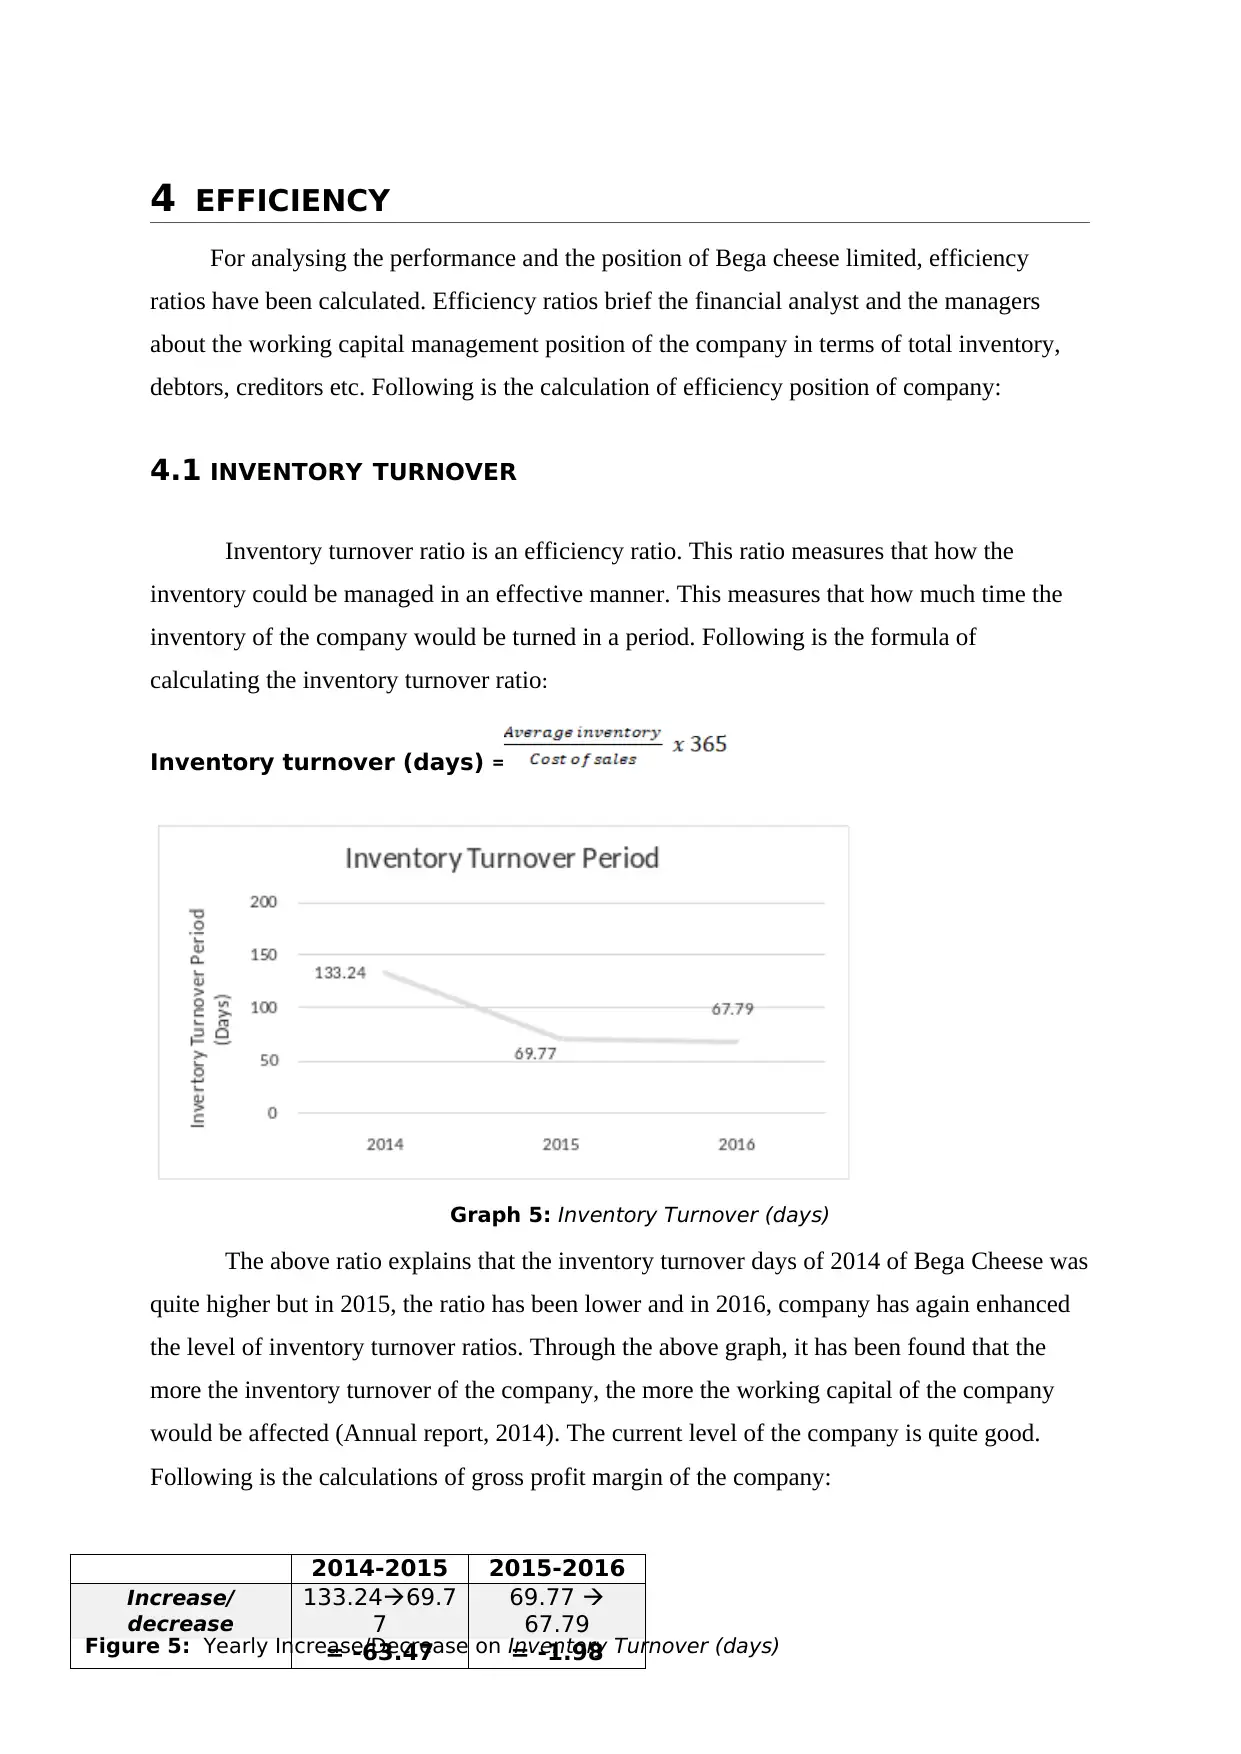
Inventory turnover (days) =
Graph 5: Inventory Turnover (days)
The above ratio explains that the inventory turnover days of 2014 of Bega Cheese was
quite higher but in 2015, the ratio has been lower and in 2016, company has again enhanced
the level of inventory turnover ratios. Through the above graph, it has been found that the
more the inventory turnover of the company, the more the working capital of the company
would be affected (Annual report, 2014). The current level of the company is quite good.
Following is the calculations of gross profit margin of the company:
2014-2015 2015-2016
Increase/
decrease
133.2469.7
7
69.77
67.79
= -63.47 = -1.98Figure 5: Yearly Increase/Decrease on Inventory Turnover (days)
For analysing the performance and the position of Bega cheese limited, efficiency
ratios have been calculated. Efficiency ratios brief the financial analyst and the managers
about the working capital management position of the company in terms of total inventory,
debtors, creditors etc. Following is the calculation of efficiency position of company:
4.1 INVENTORY TURNOVER
Inventory turnover ratio is an efficiency ratio. This ratio measures that how the
inventory could be managed in an effective manner. This measures that how much time the
inventory of the company would be turned in a period. Following is the formula of
calculating the inventory turnover ratio:
Inventory turnover (days) =
Graph 5: Inventory Turnover (days)
The above ratio explains that the inventory turnover days of 2014 of Bega Cheese was
quite higher but in 2015, the ratio has been lower and in 2016, company has again enhanced
the level of inventory turnover ratios. Through the above graph, it has been found that the
more the inventory turnover of the company, the more the working capital of the company
would be affected (Annual report, 2014). The current level of the company is quite good.
Following is the calculations of gross profit margin of the company:
2014-2015 2015-2016
Increase/
decrease
133.2469.7
7
69.77
67.79
= -63.47 = -1.98Figure 5: Yearly Increase/Decrease on Inventory Turnover (days)
⊘ This is a preview!⊘
Do you want full access?
Subscribe today to unlock all pages.
Trusted by 1+ million students worldwide
4.2 SETTLEMENT PERIOD FOR ACCOUNTS RECEIVABLE
Account receivable turnover days ratio is an efficiency ratio. This ratio measures that
how the accounting receivables collection process could be managed in an effective manner.
This measures that how much time the accounting receivables of the company would be
turned in cash a period. Following is the formula of calculating the accounting receivable
ratio:
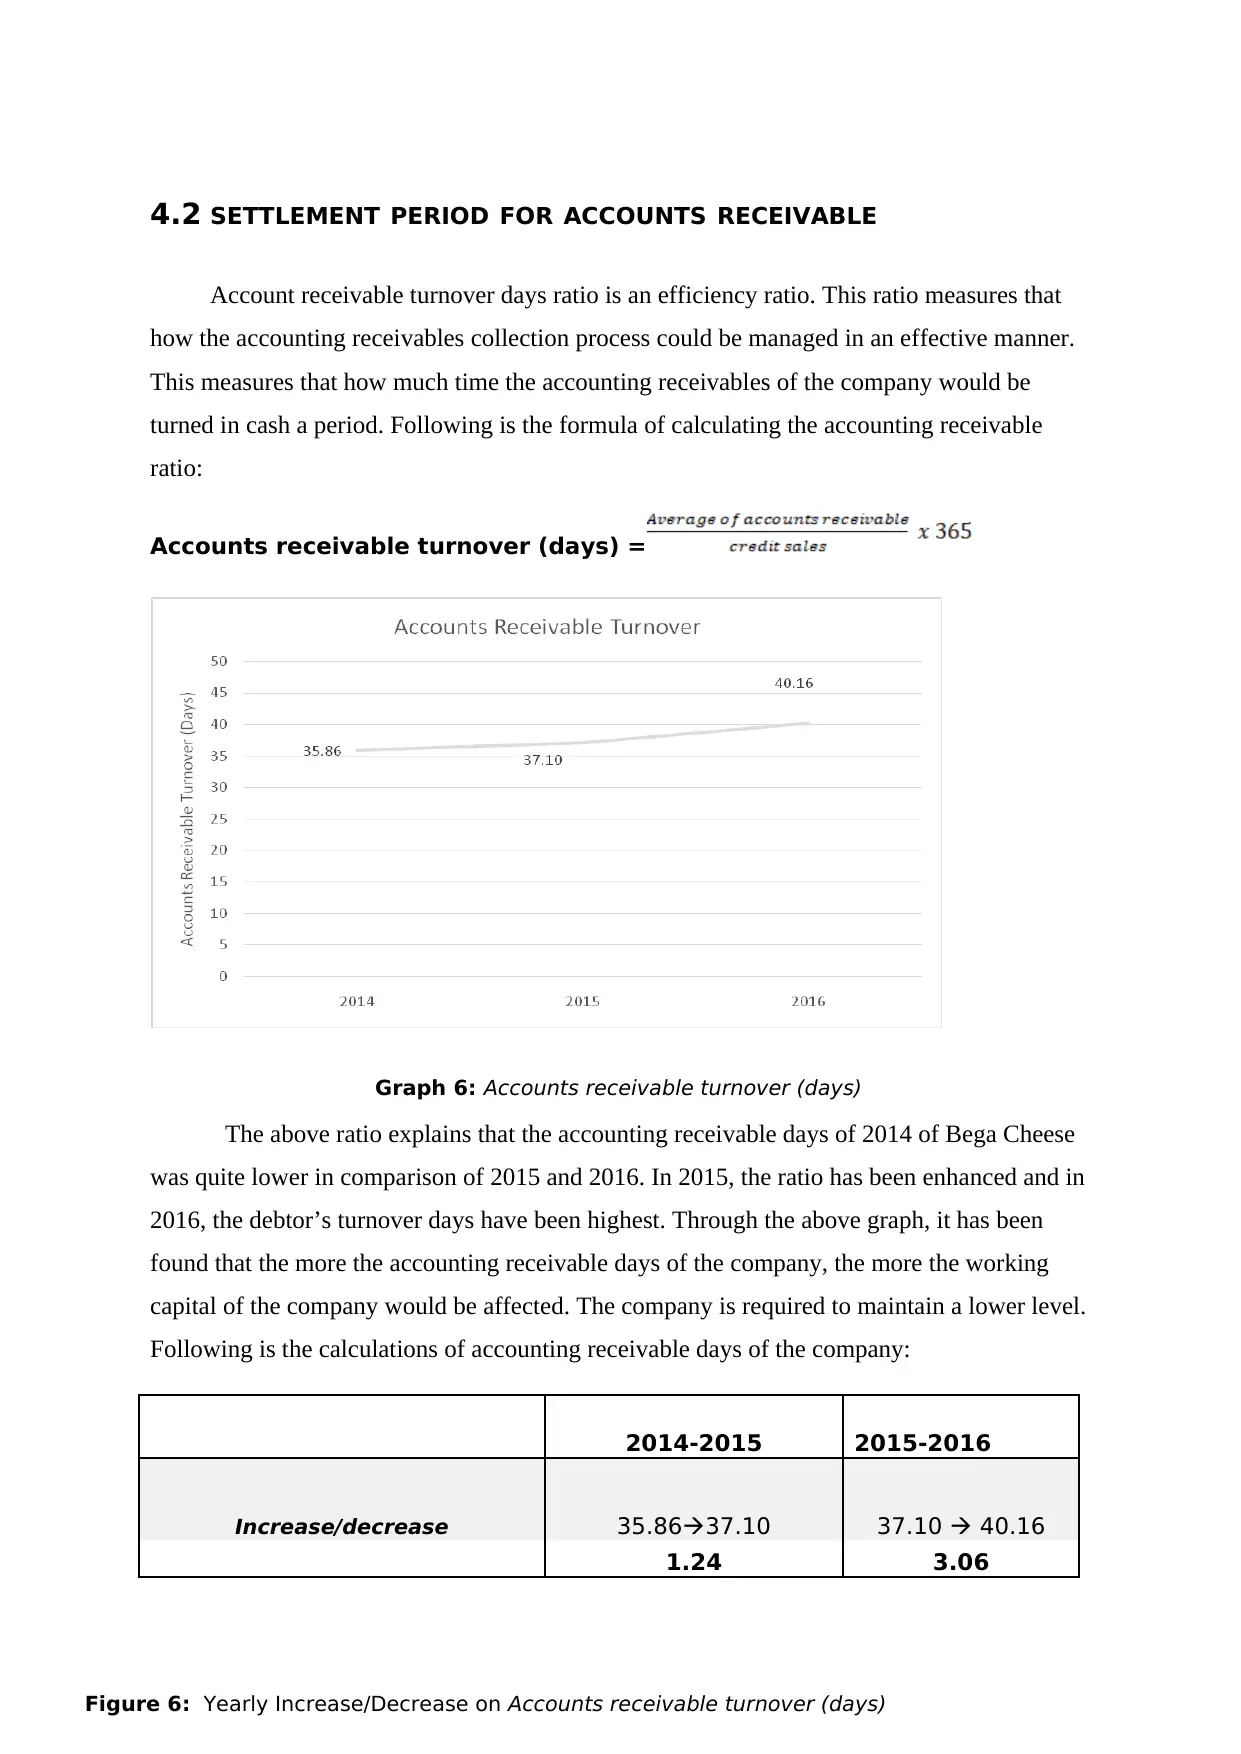
Accounts receivable turnover (days) =
Graph 6: Accounts receivable turnover (days)
The above ratio explains that the accounting receivable days of 2014 of Bega Cheese
was quite lower in comparison of 2015 and 2016. In 2015, the ratio has been enhanced and in
2016, the debtor’s turnover days have been highest. Through the above graph, it has been
found that the more the accounting receivable days of the company, the more the working
capital of the company would be affected. The company is required to maintain a lower level.
Following is the calculations of accounting receivable days of the company:
2014-2015 2015-2016
Increase/decrease 35.8637.10 37.10 40.16
1.24 3.06
Figure 6: Yearly Increase/Decrease on Accounts receivable turnover (days)
Account receivable turnover days ratio is an efficiency ratio. This ratio measures that
how the accounting receivables collection process could be managed in an effective manner.
This measures that how much time the accounting receivables of the company would be
turned in cash a period. Following is the formula of calculating the accounting receivable
ratio:
Accounts receivable turnover (days) =
Graph 6: Accounts receivable turnover (days)
The above ratio explains that the accounting receivable days of 2014 of Bega Cheese
was quite lower in comparison of 2015 and 2016. In 2015, the ratio has been enhanced and in
2016, the debtor’s turnover days have been highest. Through the above graph, it has been
found that the more the accounting receivable days of the company, the more the working
capital of the company would be affected. The company is required to maintain a lower level.
Following is the calculations of accounting receivable days of the company:
2014-2015 2015-2016
Increase/decrease 35.8637.10 37.10 40.16
1.24 3.06
Figure 6: Yearly Increase/Decrease on Accounts receivable turnover (days)
Paraphrase This Document
Need a fresh take? Get an instant paraphrase of this document with our AI Paraphraser
4.3 SETTLEMENT PERIOD FOR CREDITORS / ACCOUNTS PAYABLE
Accounts payable turnover days ratio is an efficiency ratio. This ratio measures that
how the accounting payable payment process could be managed in an effective manner. This
measures that how much time the accounting payables of the company would be turned in
cash a period (Fulin, 2011). Following is the formula of calculating the accounting payable
ratio:
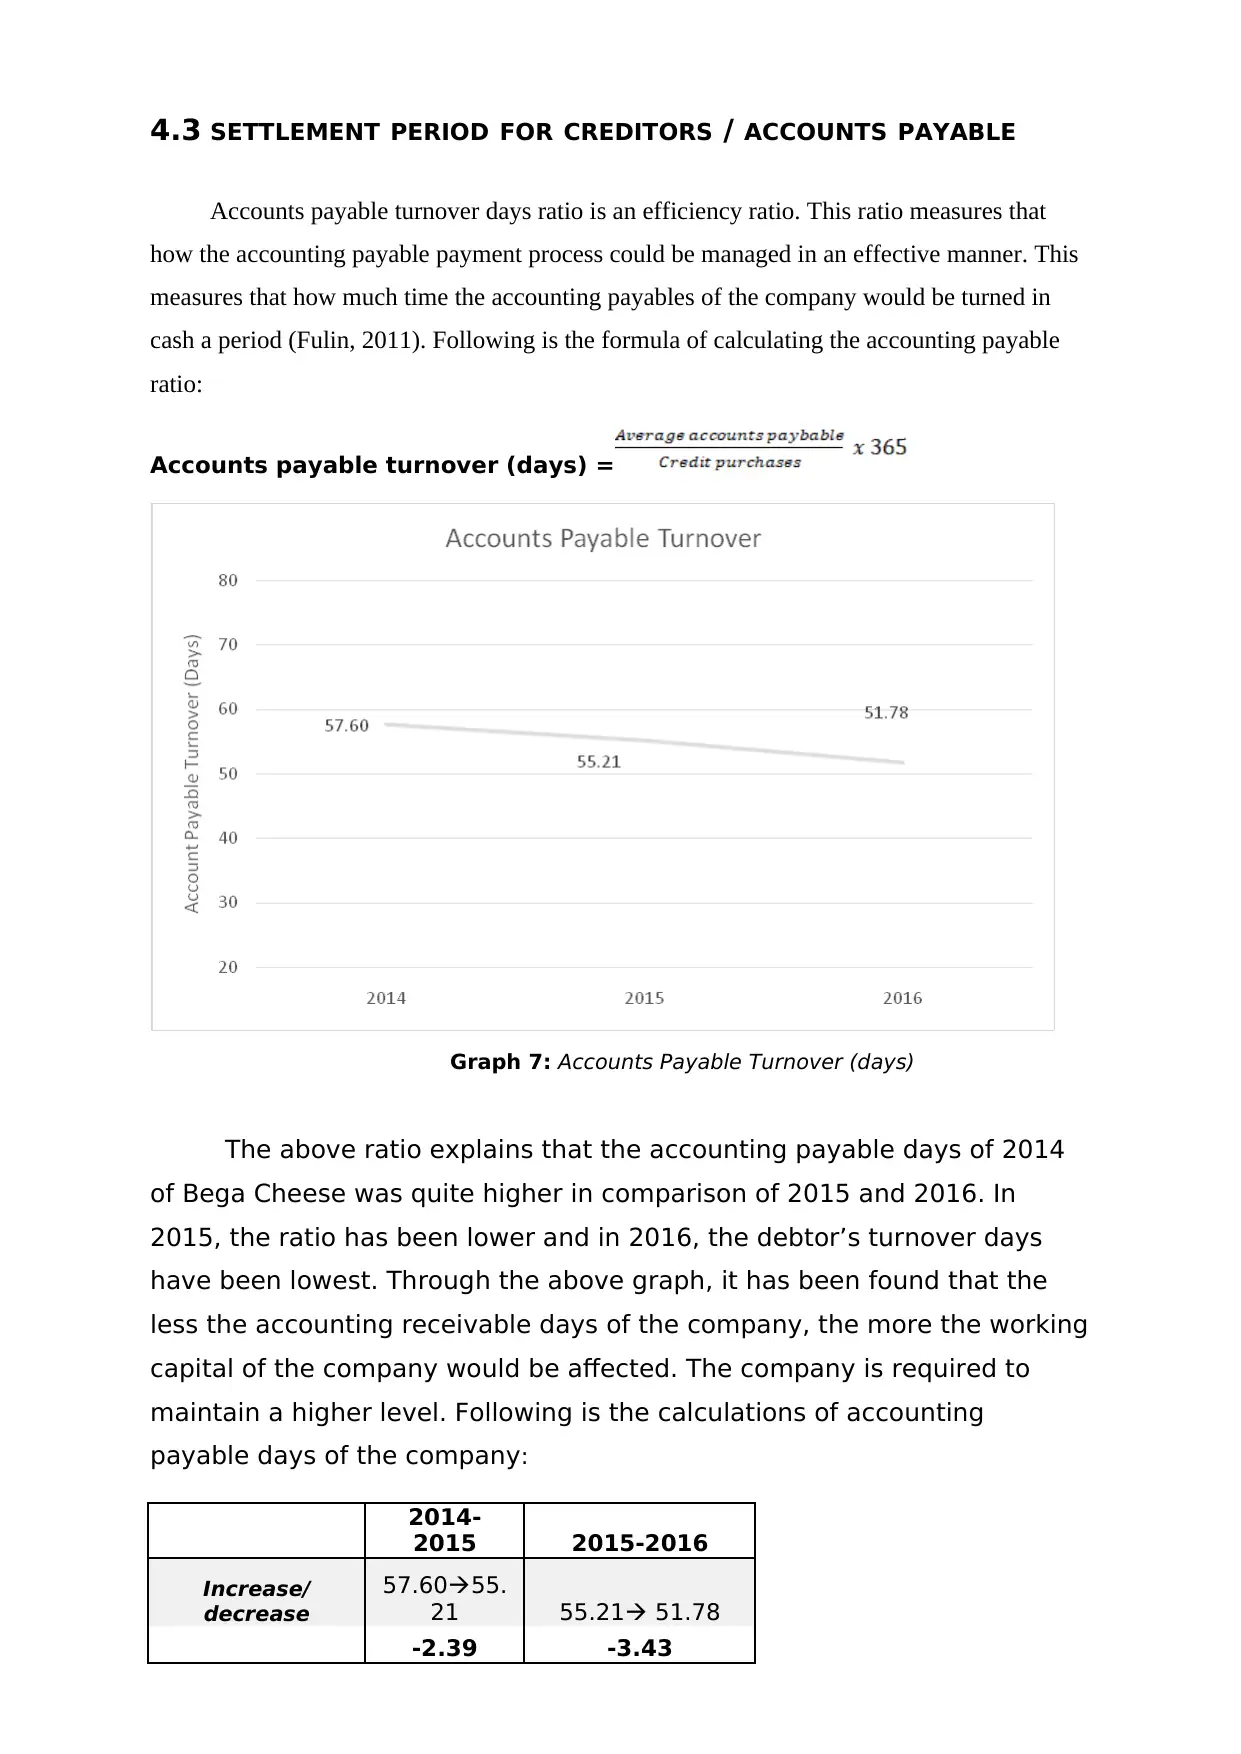
Accounts payable turnover (days) =
Graph 7: Accounts Payable Turnover (days)
The above ratio explains that the accounting payable days of 2014
of Bega Cheese was quite higher in comparison of 2015 and 2016. In
2015, the ratio has been lower and in 2016, the debtor’s turnover days
have been lowest. Through the above graph, it has been found that the
less the accounting receivable days of the company, the more the working
capital of the company would be affected. The company is required to
maintain a higher level. Following is the calculations of accounting
payable days of the company:
2014-
2015 2015-2016
Increase/
decrease
57.6055.
21 55.21 51.78
-2.39 -3.43
Accounts payable turnover days ratio is an efficiency ratio. This ratio measures that
how the accounting payable payment process could be managed in an effective manner. This
measures that how much time the accounting payables of the company would be turned in
cash a period (Fulin, 2011). Following is the formula of calculating the accounting payable
ratio:
Accounts payable turnover (days) =
Graph 7: Accounts Payable Turnover (days)
The above ratio explains that the accounting payable days of 2014
of Bega Cheese was quite higher in comparison of 2015 and 2016. In
2015, the ratio has been lower and in 2016, the debtor’s turnover days
have been lowest. Through the above graph, it has been found that the
less the accounting receivable days of the company, the more the working
capital of the company would be affected. The company is required to
maintain a higher level. Following is the calculations of accounting
payable days of the company:
2014-
2015 2015-2016
Increase/
decrease
57.6055.
21 55.21 51.78
-2.39 -3.43
Figure 7: Yearly Increase/Decrease on Accounts Payable Turnover (days)
⊘ This is a preview!⊘
Do you want full access?
Subscribe today to unlock all pages.
Trusted by 1+ million students worldwide
1 out of 27
Related Documents


Your All-in-One AI-Powered Toolkit for Academic Success.
+13062052269
info@desklib.com
Available 24*7 on WhatsApp / Email
![[object Object]](/_next/static/media/star-bottom.7253800d.svg)
Unlock your academic potential
Copyright © 2020–2026 A2Z Services. All Rights Reserved. Developed and managed by ZUCOL.