Financial Analysis Report: Bellamy Australia Limited, Semester 2, 2019
VerifiedAdded on 2022/12/18
|16
|3967
|91
Report
AI Summary
This report provides a comprehensive financial analysis of Bellamy Australia Limited, focusing on its financial performance using various tools and techniques. The analysis includes an executive summary, table of contents, and introduction outlining the scope of the study. The report examines the company's overview, followed by common size financial statements and ratio analysis to assess its profitability, liquidity, and overall financial health. Trend analysis is performed using graphs to illustrate changes in key financial elements like total assets, property, plant, and equipment, revenue, and profit over the years. The report calculates several financial ratios, including current ratio, net profit margin, return on total assets, interest coverage ratio, and total assets turnover ratio. The conclusion summarizes the company's financial position, highlights areas for improvement, and offers recommendations to enhance financial performance, such as better expense control and improved asset utilization. The report is based on financial data from the company's annual reports.
1
Accounting for Managers
Accounting for Managers
Paraphrase This Document
Need a fresh take? Get an instant paraphrase of this document with our AI Paraphraser
2
Executive summary
The report has been made on the Bellamy Australia limited which is operating in the organic
foods. The evaluation has been made with the help of the various tools and techniques which are
available. It has been identified that there is the growth which is maintained by the company and
in that the profitability and liquidity have been maintained appropriately. There has been the
vertical and horizontal analysis which has been performed and the increase which is taking place
in all the elements has been noted. There is the representation of the trends with the help of the
graphs which have been made. The ratios have been calculated and by that the further
analyzation has been made. There are certain areas in which the improvement will have to be
made by the company. All of them have been identified and provided under the
recommendations. By following all of them there will be improvement which will be made in the
coming period.
3
Table of Contents
Executive summary.........................................................................................................................2
Introduction......................................................................................................................................4
Overview of Bellamy Australia limited...........................................................................................4
Common size financial statements..................................................................................................4
Ratio analysis...................................................................................................................................8
Conclusion.......................................................................................................................................9
Recommendations..........................................................................................................................10
References......................................................................................................................................11
Appendix........................................................................................................................................13
⊘ This is a preview!⊘
Do you want full access?
Subscribe today to unlock all pages.
Trusted by 1+ million students worldwide
4
Introduction
In the business, there are various financial aspects which need to be considered and there will be
carrying out of the financial analysis for the same. The analysis will be made in this report in
context of Bellamy Australia limited. There will be common size financial statements which will
be prepared and with that the trend analysis will be performed. All the trends which are being
followed will be identified in relation to the various assets and liabilities. There will also be the
calculation of the ratios so that the relation which exists among various elements will be
identified. There will be use of the various aspects in this and with the help of them financial
position and performance of the company will be identified.
Overview of Bellamy Australia limited
Bellamy Australia limited is the company which is a public company and deals in organic food.
There are the sale and distribution of the food and in that there are various formula products also
for the toddlers and babies. The main countries in which the operations are performed include
Hong Kong, China, Singapore and Australia (Bellamy Australia limited, 2019). The company is
listed on the Australia stock exchange. There are various certified organic products which are
sold by the company in both the national as well as international markets. All of the services and
products are provided with the best quality as they deal with the health of the babies. All the
requirements are fulfilled in an effective manner and there is the development which is made
possible.
Common size financial statements
In the financial statements, all the information in relation to particular period are provided and
for the proper evaluation of the position of the business there is the carrying of the analysis. In
this there are two types which are horizontal and vertical analysis. In the horizontal analysis there
is the comparison of the various years and the increase or decrease which is taking place over a
significant period will be taken into account (Williams and Dobelman, 2017). By this the growth
which has been made by the company over past years will be identified and analyzed. In this
method one year is taken as the base and then the performance of all the years is tested on the
basis of that. This will be showing the increase or decline with respect to that year and then the
Paraphrase This Document
Need a fresh take? Get an instant paraphrase of this document with our AI Paraphraser
5
decision will be made accordingly.
In the case of the vertical analysis, there will be consideration of the information for the one year
only. The percent of all the elements with reference to the sales will be calculated. This will be
determining the proportion each item is contributing to the sales of the company. The change in
the proportion will be ascertained with the performing of this analysis for longer duration
(Loughran and McDonald, 2016).
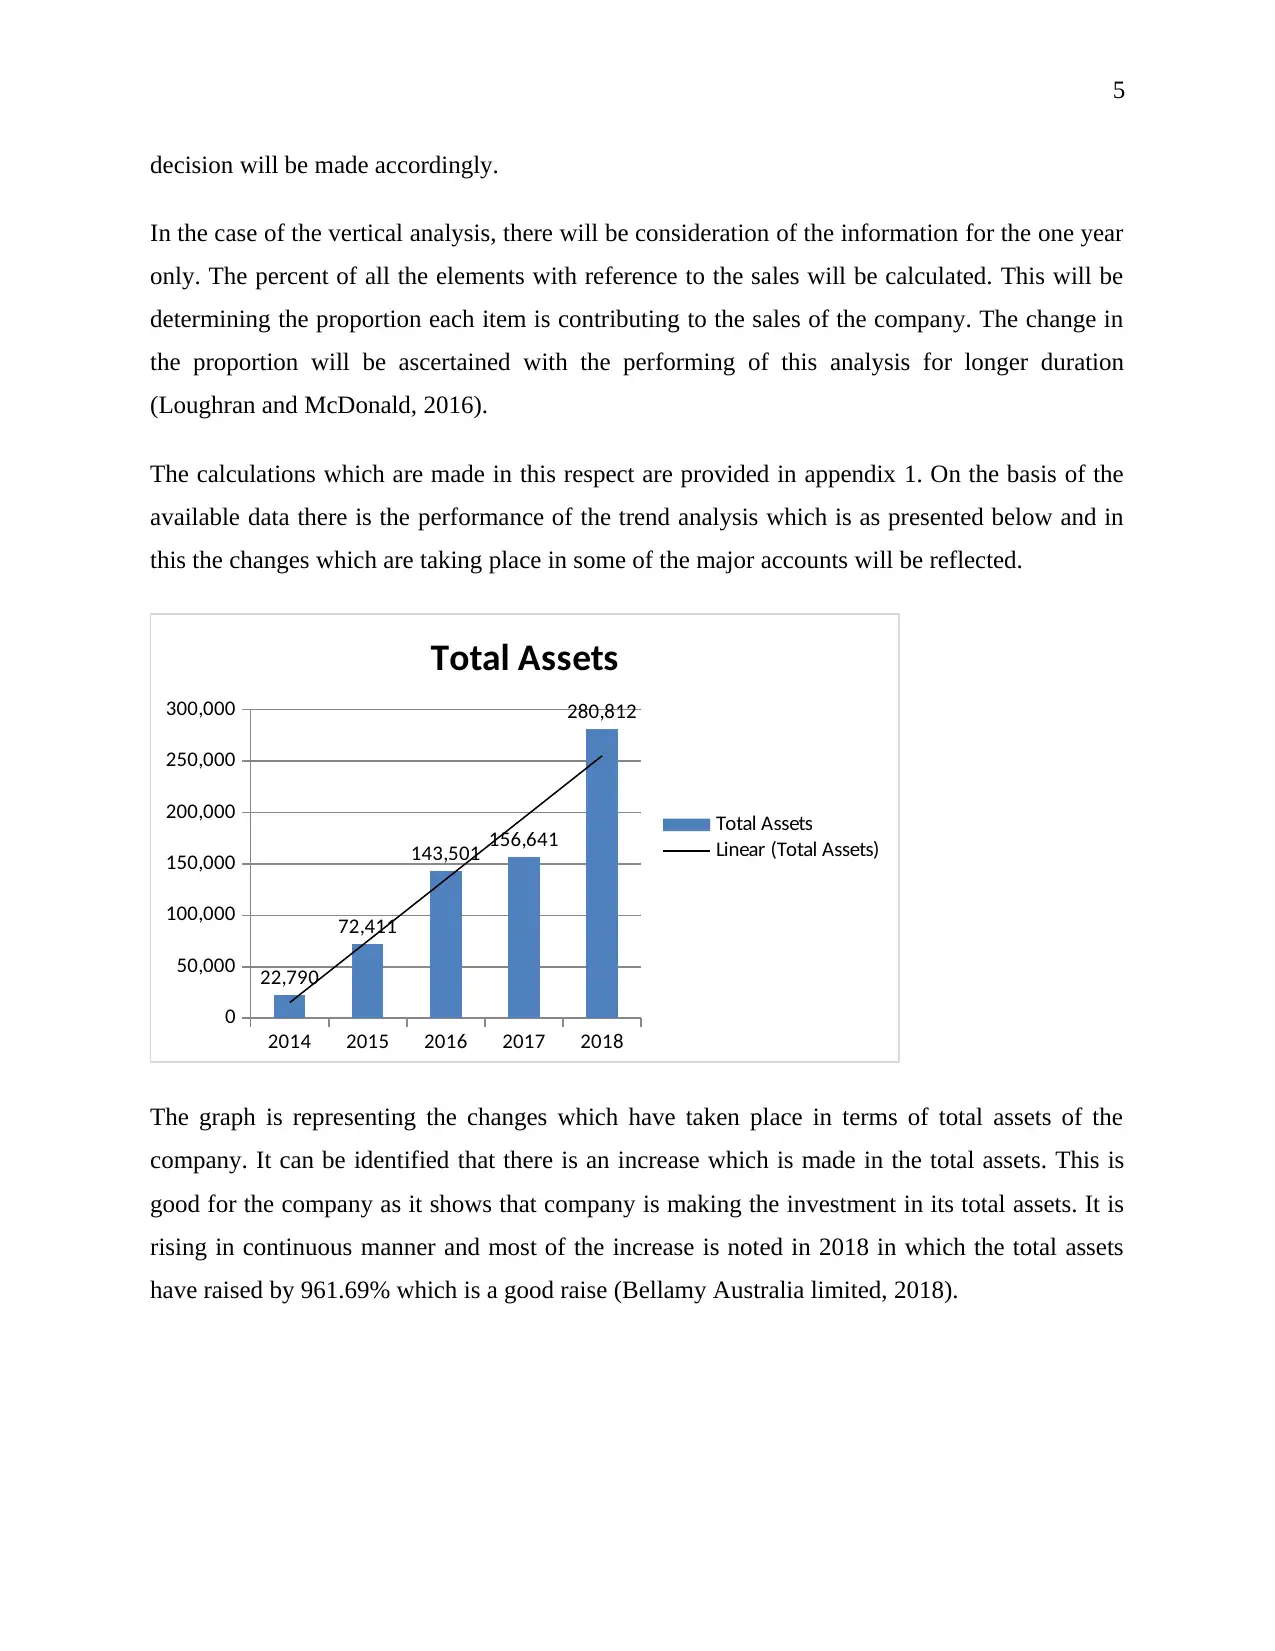
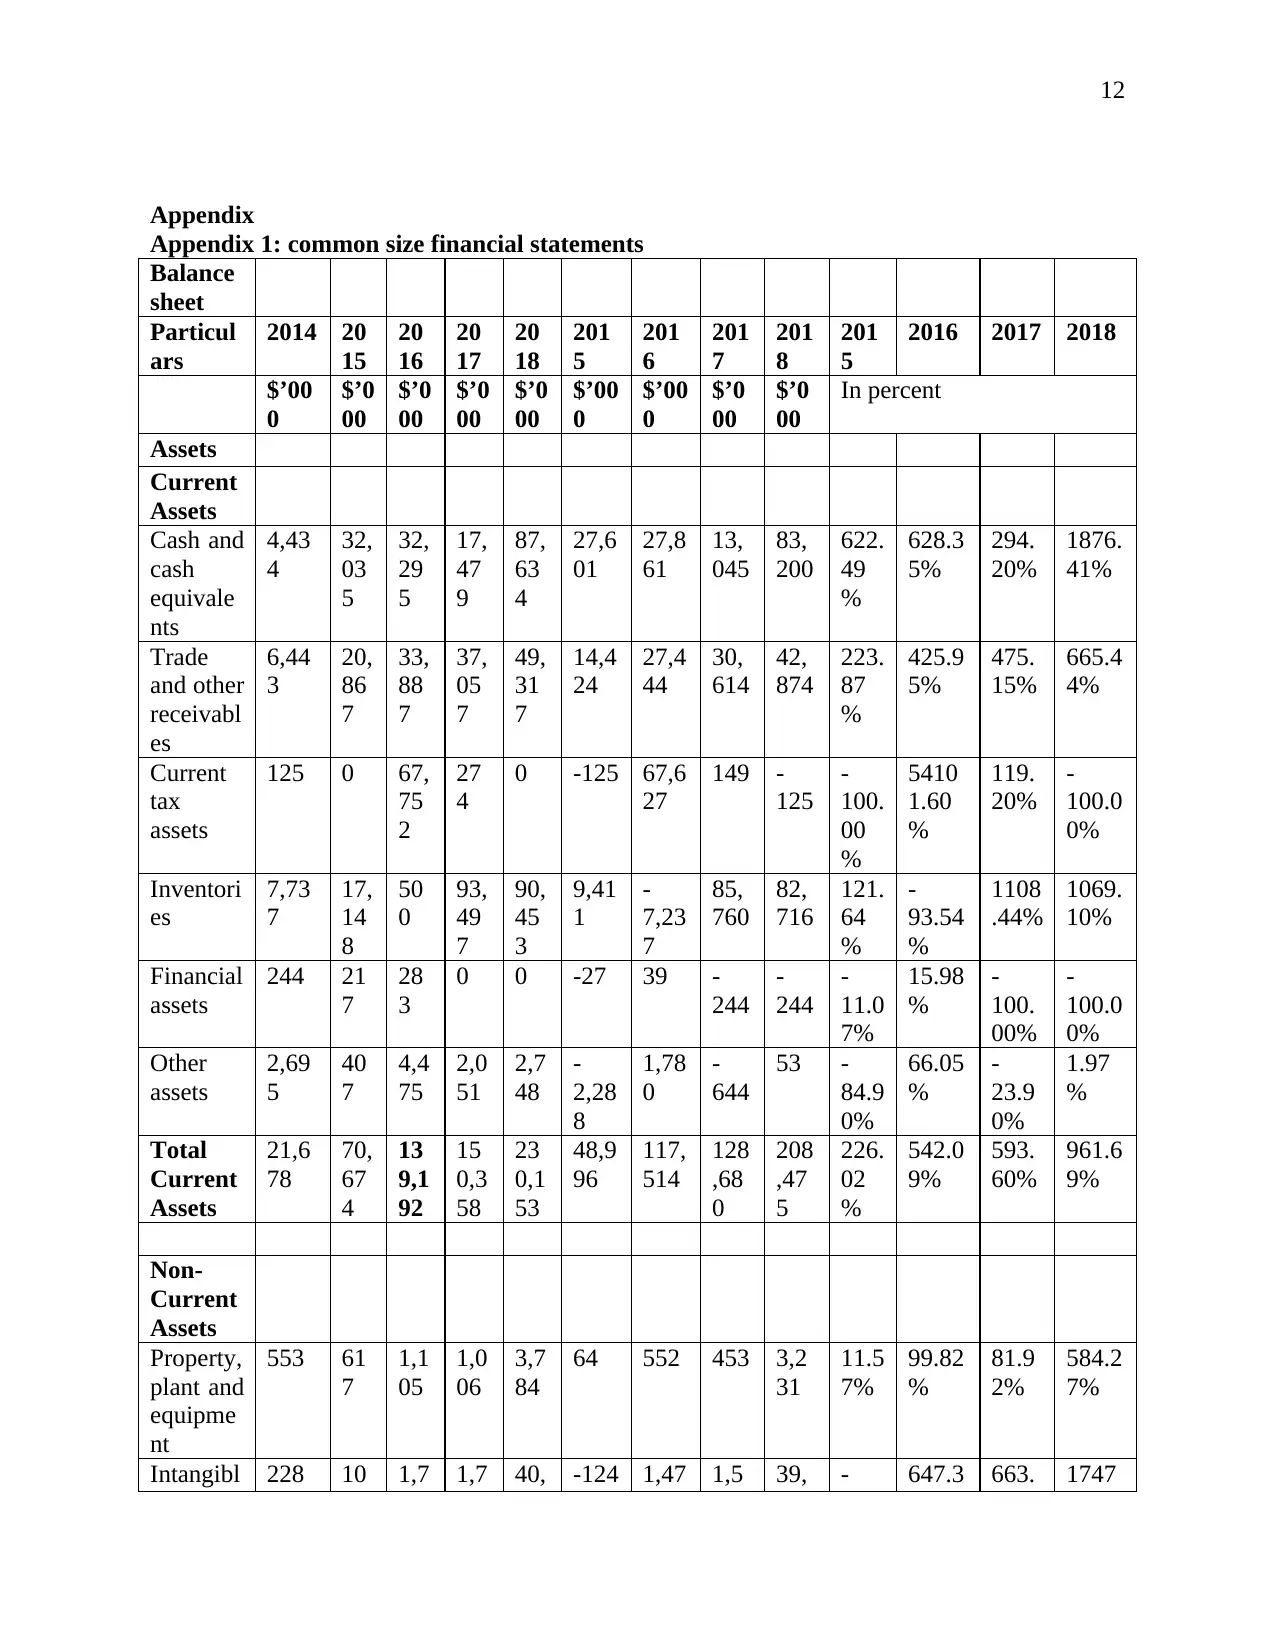
The calculations which are made in this respect are provided in appendix 1. On the basis of the
available data there is the performance of the trend analysis which is as presented below and in
this the changes which are taking place in some of the major accounts will be reflected.
2014 2015 2016 2017 2018
0
50,000
100,000
150,000
200,000
250,000
300,000
22,790
72,411
143,501 156,641
280,812
Total Assets
Total Assets
Linear (Total Assets)
The graph is representing the changes which have taken place in terms of total assets of the
company. It can be identified that there is an increase which is made in the total assets. This is
good for the company as it shows that company is making the investment in its total assets. It is
rising in continuous manner and most of the increase is noted in 2018 in which the total assets
have raised by 961.69% which is a good raise (Bellamy Australia limited, 2018).
decision will be made accordingly.
In the case of the vertical analysis, there will be consideration of the information for the one year
only. The percent of all the elements with reference to the sales will be calculated. This will be
determining the proportion each item is contributing to the sales of the company. The change in
the proportion will be ascertained with the performing of this analysis for longer duration
(Loughran and McDonald, 2016).
The calculations which are made in this respect are provided in appendix 1. On the basis of the
available data there is the performance of the trend analysis which is as presented below and in
this the changes which are taking place in some of the major accounts will be reflected.
2014 2015 2016 2017 2018
0
50,000
100,000
150,000
200,000
250,000
300,000
22,790
72,411
143,501 156,641
280,812
Total Assets
Total Assets
Linear (Total Assets)
The graph is representing the changes which have taken place in terms of total assets of the
company. It can be identified that there is an increase which is made in the total assets. This is
good for the company as it shows that company is making the investment in its total assets. It is
rising in continuous manner and most of the increase is noted in 2018 in which the total assets
have raised by 961.69% which is a good raise (Bellamy Australia limited, 2018).
6
2014 2015 2016 2017 2018
0
500
1000
1500
2000
2500
3000
3500
4000
553 617
1105 1006
3784
Property, plant and equipment
Property, plant and
equipment
Linear (Property, plant and
equipment)
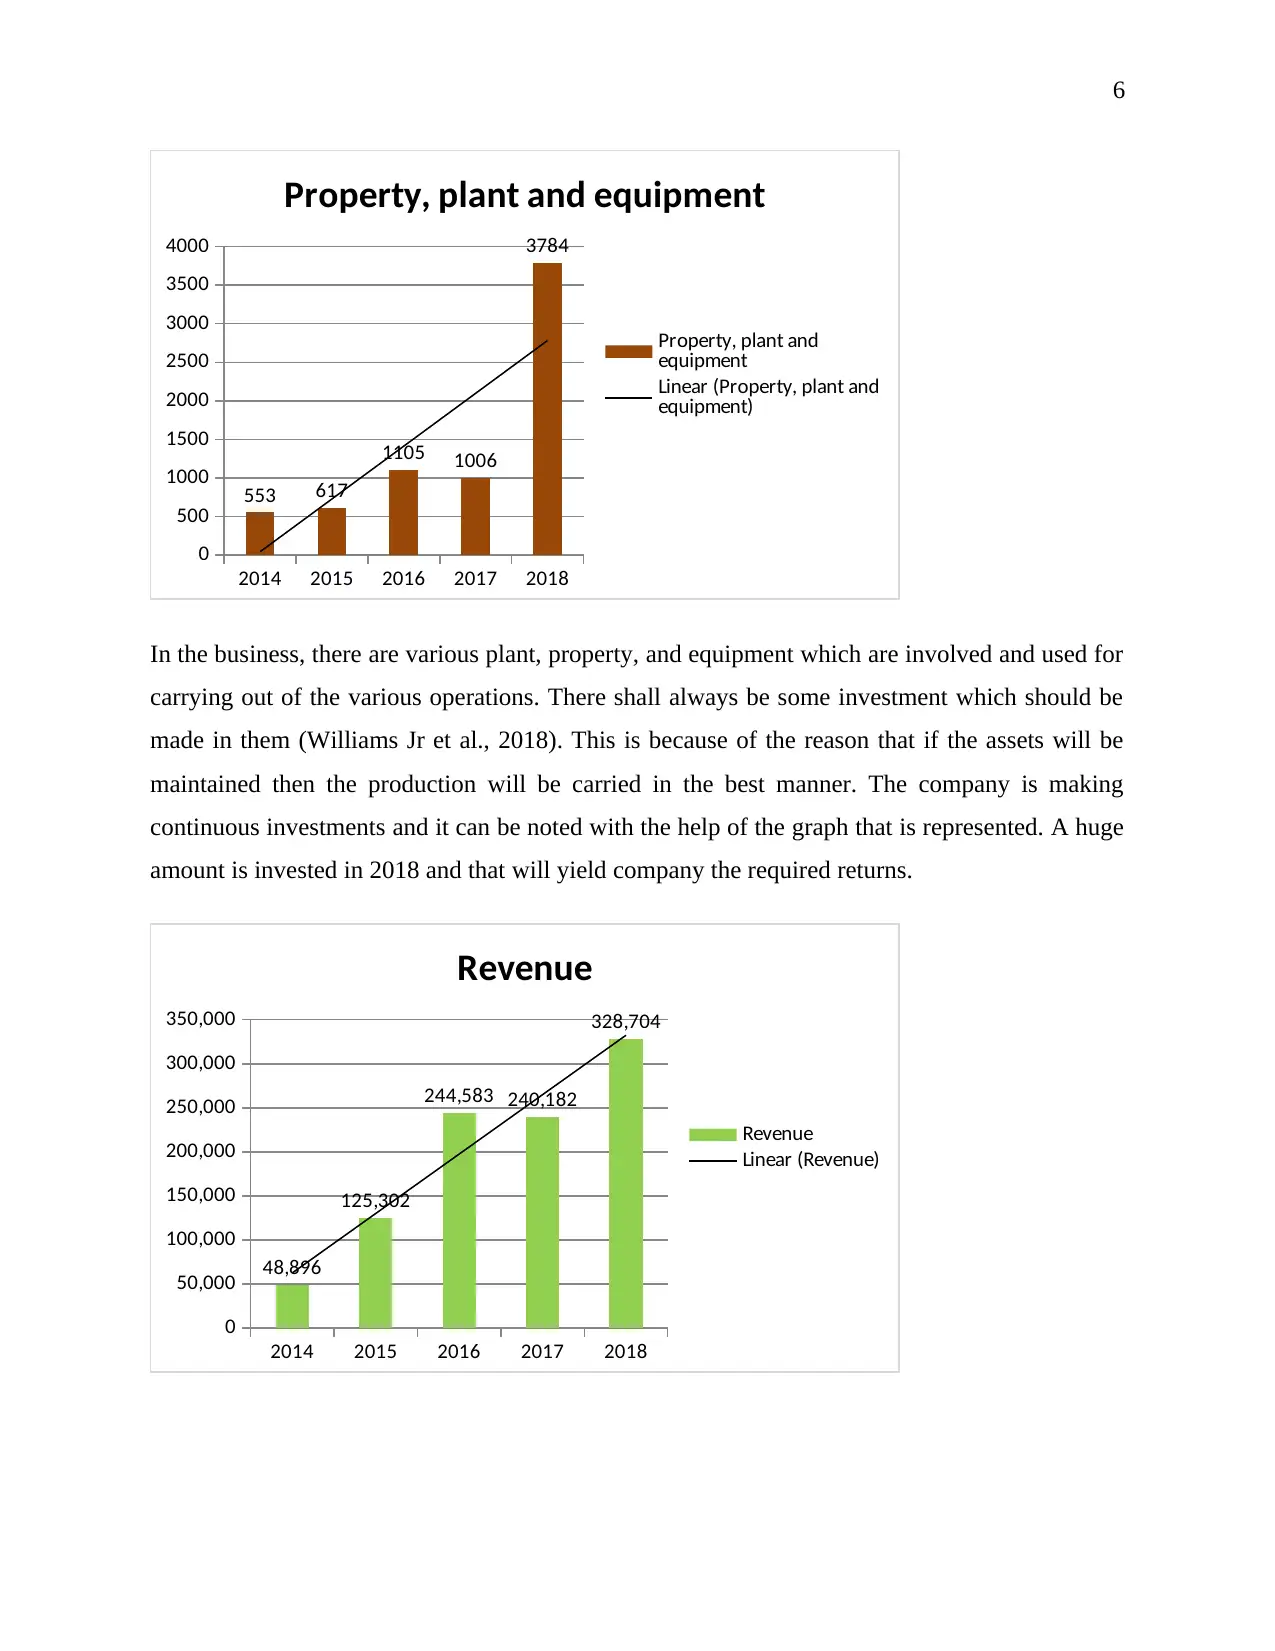
In the business, there are various plant, property, and equipment which are involved and used for
carrying out of the various operations. There shall always be some investment which should be
made in them (Williams Jr et al., 2018). This is because of the reason that if the assets will be
maintained then the production will be carried in the best manner. The company is making
continuous investments and it can be noted with the help of the graph that is represented. A huge
amount is invested in 2018 and that will yield company the required returns.
2014 2015 2016 2017 2018
0
50,000
100,000
150,000
200,000
250,000
300,000
350,000
48,896
125,302
244,583 240,182
328,704
Revenue
Revenue
Linear (Revenue)
2014 2015 2016 2017 2018
0
500
1000
1500
2000
2500
3000
3500
4000
553 617
1105 1006
3784
Property, plant and equipment
Property, plant and
equipment
Linear (Property, plant and
equipment)
In the business, there are various plant, property, and equipment which are involved and used for
carrying out of the various operations. There shall always be some investment which should be
made in them (Williams Jr et al., 2018). This is because of the reason that if the assets will be
maintained then the production will be carried in the best manner. The company is making
continuous investments and it can be noted with the help of the graph that is represented. A huge
amount is invested in 2018 and that will yield company the required returns.
2014 2015 2016 2017 2018
0
50,000
100,000
150,000
200,000
250,000
300,000
350,000
48,896
125,302
244,583 240,182
328,704
Revenue
Revenue
Linear (Revenue)
⊘ This is a preview!⊘
Do you want full access?
Subscribe today to unlock all pages.
Trusted by 1+ million students worldwide
7
The investments are made in the company and their result can be analyzed in form of the revenue
which is made. There is an increase in the revenue which is made and it shows that company is
using all the available resources in an effective manner (Bellamy Australia limited, 2017). There
is an upward trend which is identified and it will be in the interest of the company.
2014 2015 2016 2017 2018
-10,000
0
10,000
20,000
30,000
40,000
50,000
1,266
9,073
38,328
-809
42,816
Profit for the year
Profit for the year
Linear (Profit for the year)
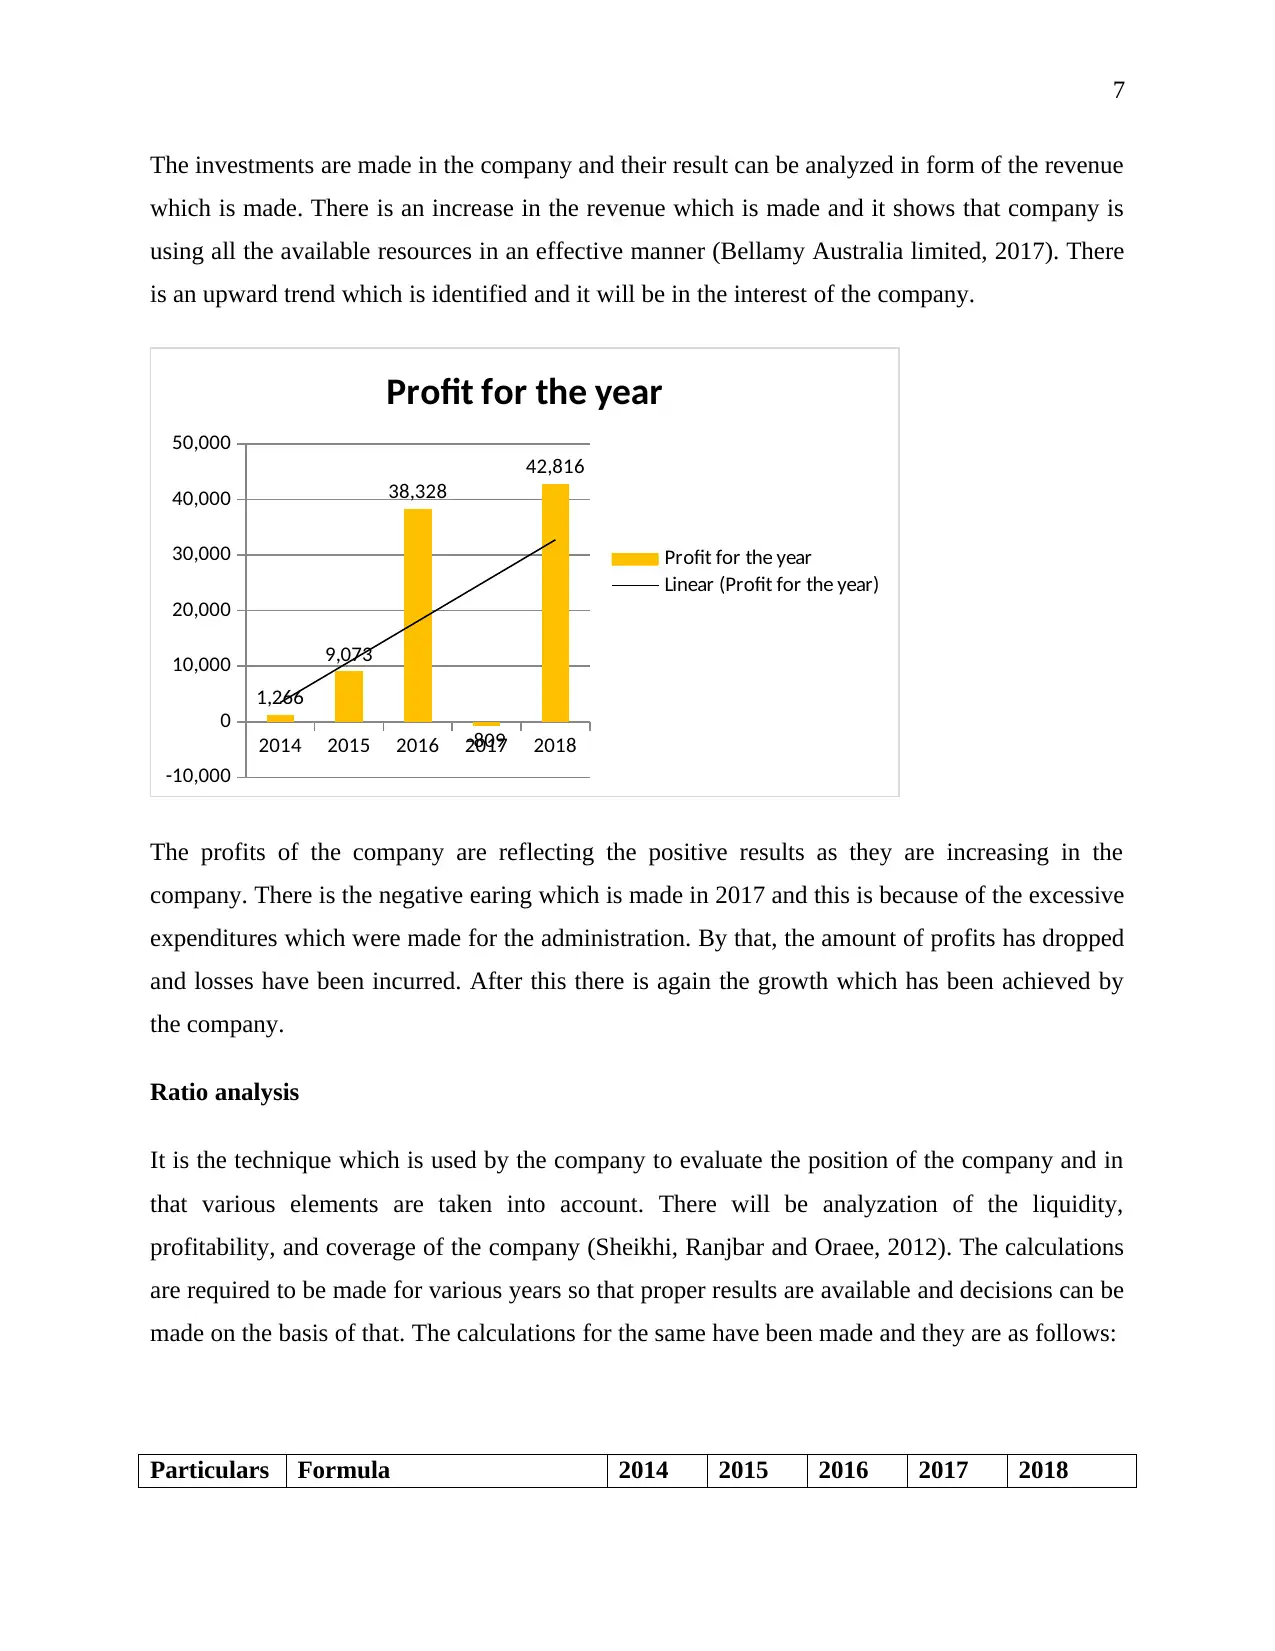
The profits of the company are reflecting the positive results as they are increasing in the
company. There is the negative earing which is made in 2017 and this is because of the excessive
expenditures which were made for the administration. By that, the amount of profits has dropped
and losses have been incurred. After this there is again the growth which has been achieved by
the company.
Ratio analysis
It is the technique which is used by the company to evaluate the position of the company and in
that various elements are taken into account. There will be analyzation of the liquidity,
profitability, and coverage of the company (Sheikhi, Ranjbar and Oraee, 2012). The calculations
are required to be made for various years so that proper results are available and decisions can be
made on the basis of that. The calculations for the same have been made and they are as follows:
Particulars Formula 2014 2015 2016 2017 2018
The investments are made in the company and their result can be analyzed in form of the revenue
which is made. There is an increase in the revenue which is made and it shows that company is
using all the available resources in an effective manner (Bellamy Australia limited, 2017). There
is an upward trend which is identified and it will be in the interest of the company.
2014 2015 2016 2017 2018
-10,000
0
10,000
20,000
30,000
40,000
50,000
1,266
9,073
38,328
-809
42,816
Profit for the year
Profit for the year
Linear (Profit for the year)
The profits of the company are reflecting the positive results as they are increasing in the
company. There is the negative earing which is made in 2017 and this is because of the excessive
expenditures which were made for the administration. By that, the amount of profits has dropped
and losses have been incurred. After this there is again the growth which has been achieved by
the company.
Ratio analysis
It is the technique which is used by the company to evaluate the position of the company and in
that various elements are taken into account. There will be analyzation of the liquidity,
profitability, and coverage of the company (Sheikhi, Ranjbar and Oraee, 2012). The calculations
are required to be made for various years so that proper results are available and decisions can be
made on the basis of that. The calculations for the same have been made and they are as follows:
Particulars Formula 2014 2015 2016 2017 2018
Paraphrase This Document
Need a fresh take? Get an instant paraphrase of this document with our AI Paraphraser
8
Current
ratio
Current assets/current
liabilities
3.19 3.06 2.32 2.30 3.14
Net profit
margin
Net profit/sales*100 2.59% 7.24% 15.67% -0.34% 13.03%
Return on
total assets
Net profit/total assets*100 5.56% 12.53% 26.71% -0.52% 15.25%
Interest
coverage
ratio
EBIT/interest -11.56 17.68 92.36 -0.47 65.02
Total assets
turnover
ratio
Sales/total assets 2.15 1.73 1.70 1.53 1.17
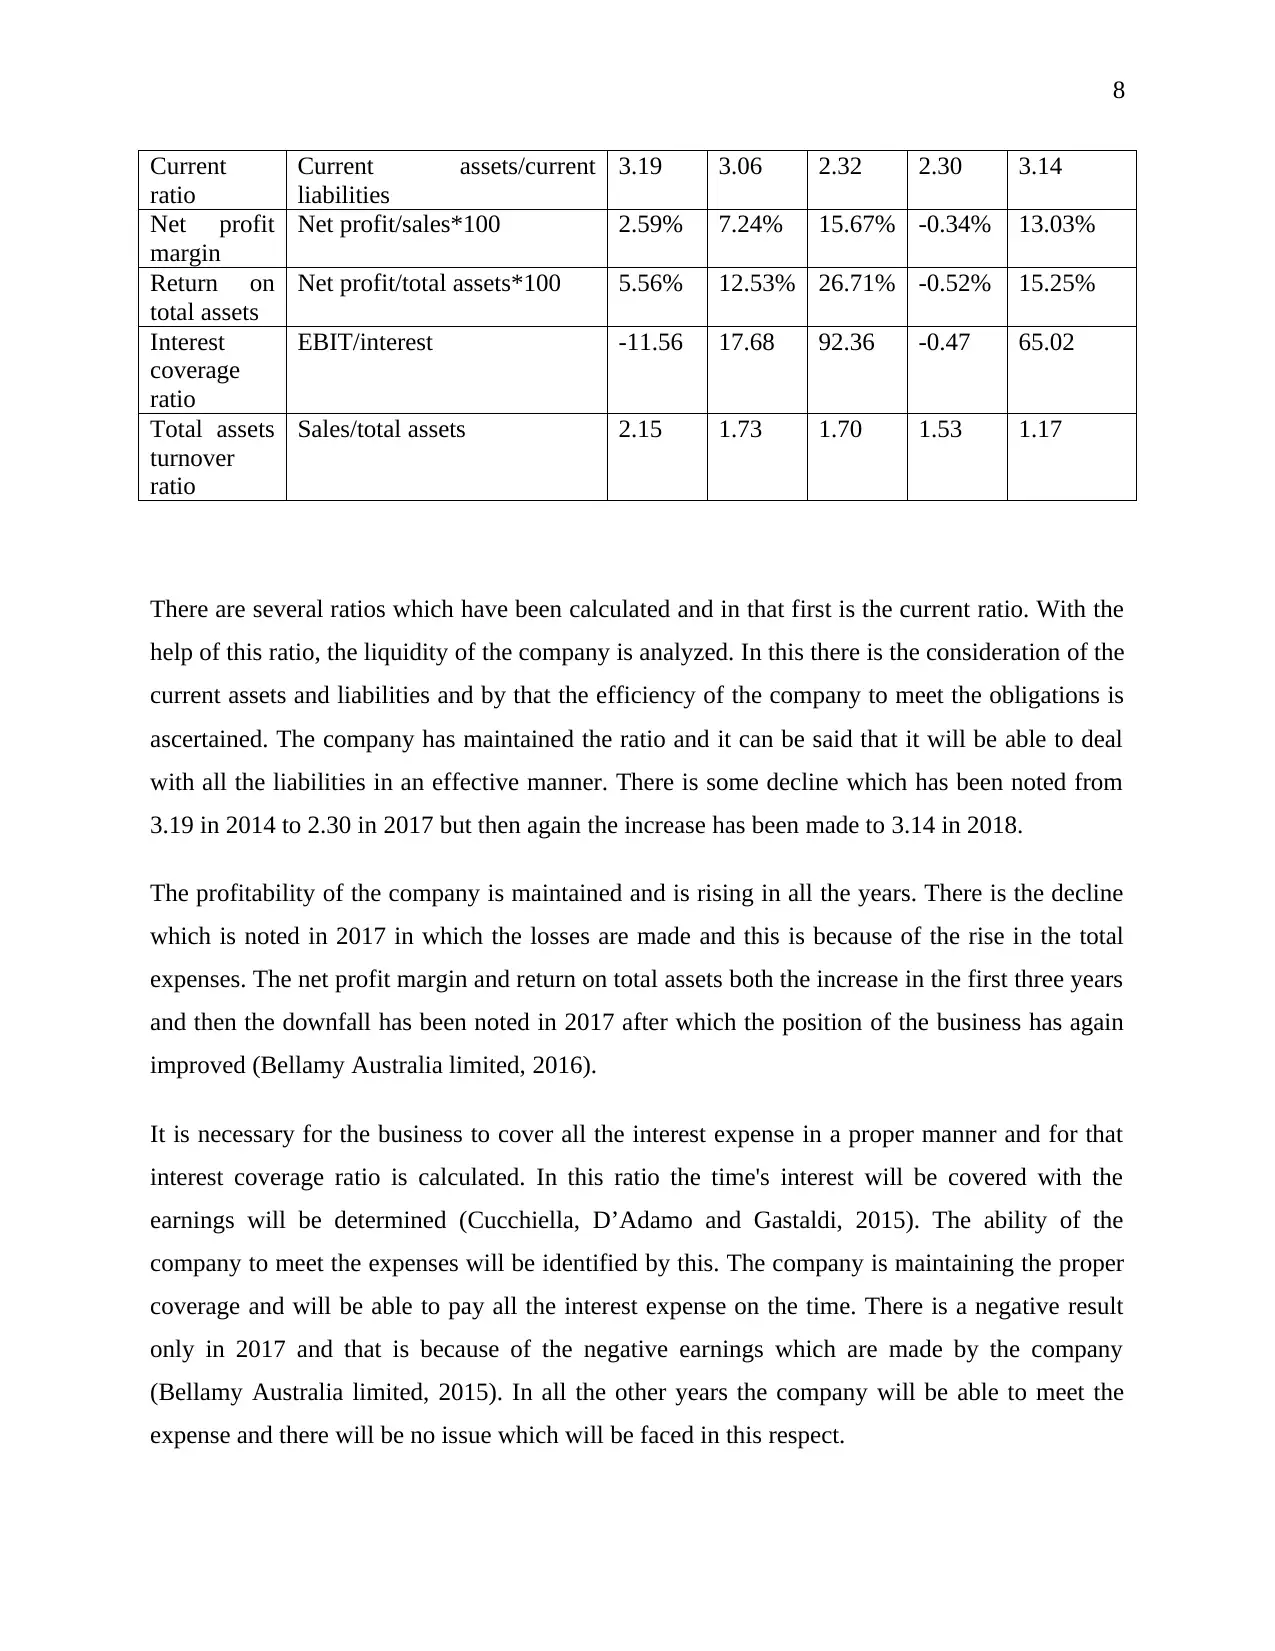
There are several ratios which have been calculated and in that first is the current ratio. With the
help of this ratio, the liquidity of the company is analyzed. In this there is the consideration of the
current assets and liabilities and by that the efficiency of the company to meet the obligations is
ascertained. The company has maintained the ratio and it can be said that it will be able to deal
with all the liabilities in an effective manner. There is some decline which has been noted from
3.19 in 2014 to 2.30 in 2017 but then again the increase has been made to 3.14 in 2018.
The profitability of the company is maintained and is rising in all the years. There is the decline
which is noted in 2017 in which the losses are made and this is because of the rise in the total
expenses. The net profit margin and return on total assets both the increase in the first three years
and then the downfall has been noted in 2017 after which the position of the business has again
improved (Bellamy Australia limited, 2016).
It is necessary for the business to cover all the interest expense in a proper manner and for that
interest coverage ratio is calculated. In this ratio the time's interest will be covered with the
earnings will be determined (Cucchiella, D’Adamo and Gastaldi, 2015). The ability of the
company to meet the expenses will be identified by this. The company is maintaining the proper
coverage and will be able to pay all the interest expense on the time. There is a negative result
only in 2017 and that is because of the negative earnings which are made by the company
(Bellamy Australia limited, 2015). In all the other years the company will be able to meet the
expense and there will be no issue which will be faced in this respect.
Current
ratio
Current assets/current
liabilities
3.19 3.06 2.32 2.30 3.14
Net profit
margin
Net profit/sales*100 2.59% 7.24% 15.67% -0.34% 13.03%
Return on
total assets
Net profit/total assets*100 5.56% 12.53% 26.71% -0.52% 15.25%
Interest
coverage
ratio
EBIT/interest -11.56 17.68 92.36 -0.47 65.02
Total assets
turnover
ratio
Sales/total assets 2.15 1.73 1.70 1.53 1.17
There are several ratios which have been calculated and in that first is the current ratio. With the
help of this ratio, the liquidity of the company is analyzed. In this there is the consideration of the
current assets and liabilities and by that the efficiency of the company to meet the obligations is
ascertained. The company has maintained the ratio and it can be said that it will be able to deal
with all the liabilities in an effective manner. There is some decline which has been noted from
3.19 in 2014 to 2.30 in 2017 but then again the increase has been made to 3.14 in 2018.
The profitability of the company is maintained and is rising in all the years. There is the decline
which is noted in 2017 in which the losses are made and this is because of the rise in the total
expenses. The net profit margin and return on total assets both the increase in the first three years
and then the downfall has been noted in 2017 after which the position of the business has again
improved (Bellamy Australia limited, 2016).
It is necessary for the business to cover all the interest expense in a proper manner and for that
interest coverage ratio is calculated. In this ratio the time's interest will be covered with the
earnings will be determined (Cucchiella, D’Adamo and Gastaldi, 2015). The ability of the
company to meet the expenses will be identified by this. The company is maintaining the proper
coverage and will be able to pay all the interest expense on the time. There is a negative result
only in 2017 and that is because of the negative earnings which are made by the company
(Bellamy Australia limited, 2015). In all the other years the company will be able to meet the
expense and there will be no issue which will be faced in this respect.
9
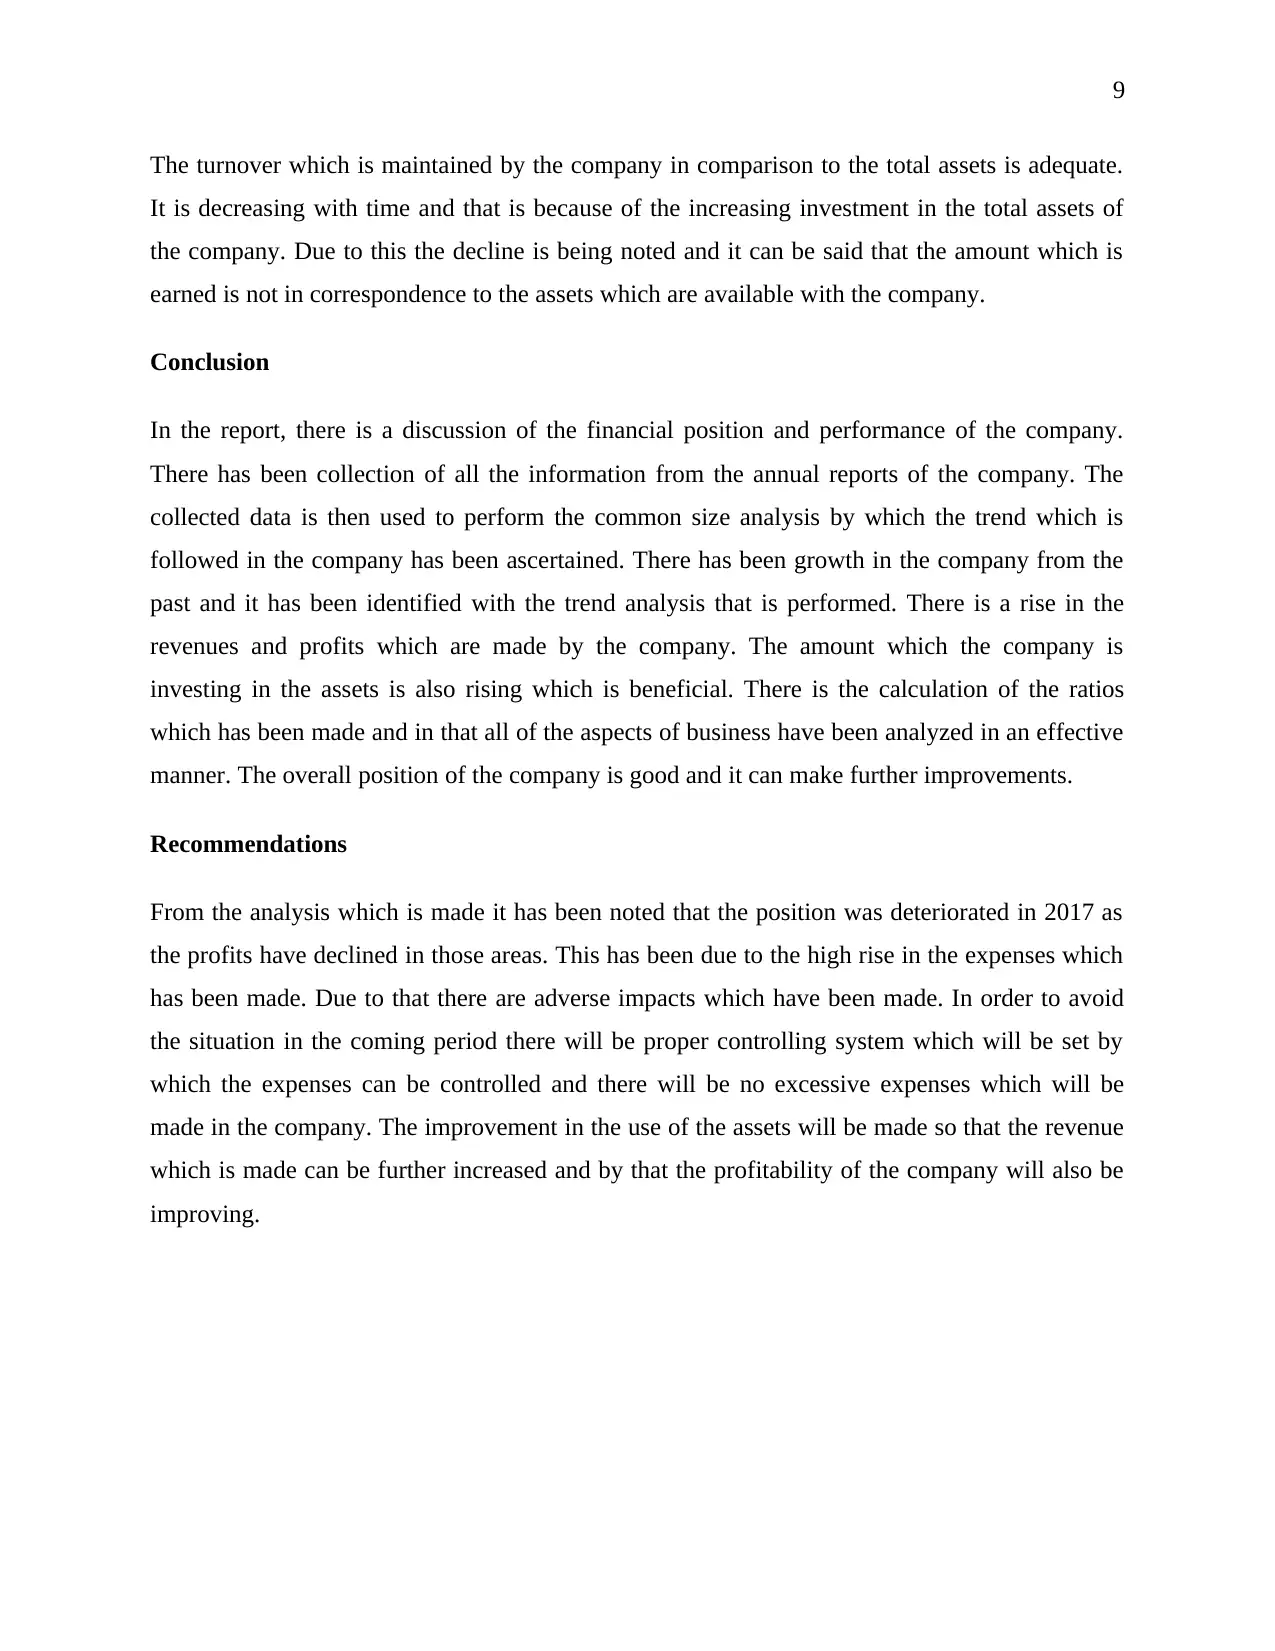
The turnover which is maintained by the company in comparison to the total assets is adequate.
It is decreasing with time and that is because of the increasing investment in the total assets of
the company. Due to this the decline is being noted and it can be said that the amount which is
earned is not in correspondence to the assets which are available with the company.
Conclusion
In the report, there is a discussion of the financial position and performance of the company.
There has been collection of all the information from the annual reports of the company. The
collected data is then used to perform the common size analysis by which the trend which is
followed in the company has been ascertained. There has been growth in the company from the
past and it has been identified with the trend analysis that is performed. There is a rise in the
revenues and profits which are made by the company. The amount which the company is
investing in the assets is also rising which is beneficial. There is the calculation of the ratios
which has been made and in that all of the aspects of business have been analyzed in an effective
manner. The overall position of the company is good and it can make further improvements.
Recommendations
From the analysis which is made it has been noted that the position was deteriorated in 2017 as
the profits have declined in those areas. This has been due to the high rise in the expenses which
has been made. Due to that there are adverse impacts which have been made. In order to avoid
the situation in the coming period there will be proper controlling system which will be set by
which the expenses can be controlled and there will be no excessive expenses which will be
made in the company. The improvement in the use of the assets will be made so that the revenue
which is made can be further increased and by that the profitability of the company will also be
improving.
⊘ This is a preview!⊘
Do you want full access?
Subscribe today to unlock all pages.
Trusted by 1+ million students worldwide
10
References
Bellamy Australia limited. (2015). Annual report. [Online] Available at:
http://www.annualreports.com/HostedData/AnnualReportArchive/B/ASX_BAL_2015.pdf
[Accessed 14 September 2019]
Bellamy Australia limited. (2015). Overview. [Online] Available at:
https://www.ibisworld.com.au/australian-company-research-reports/wholesale-trade/bellamys-
australia-limited-company.html [Accessed 14 September 2019]
Bellamy Australia limited. (2016). Annual report. [Online] Available at:
http://www.annualreports.com/HostedData/AnnualReportArchive/B/ASX_BAL_2016.pdf
[Accessed 14 September 2019]
Bellamy Australia limited. (2017). Annual report. [Online] Available at:
http://www.annualreports.com/HostedData/AnnualReportArchive/B/ASX_BAL_2017.pdf
[Accessed 14 September 2019]
Bellamy Australia limited. (2018). Annual report. [Online] Available at:
http://www.annualreports.com/HostedData/AnnualReports/PDF/ASX_BAL_2018.pdf [Accessed
14 September 2019]
Cucchiella, F., D’Adamo, I. and Gastaldi, M. (2015) Financial analysis for investment and policy
decisions in the renewable energy sector. Clean Technologies and Environmental Policy, 17(4),
pp.887-904.
Loughran, T. and McDonald, B. (2016) Textual analysis in accounting and finance: A
survey. Journal of Accounting Research, 54(4), pp.1187-1230.
Sheikhi, A., Ranjbar, A.M. and Oraee, H. (2012) Financial analysis and optimal size and
operation for a multicarrier energy system. Energy and buildings, 48, pp.71-78.
Williams Jr, R.I., Manley, S.C., Aaron, J.R. and Daniel, F. (2018) The relationship between a
comprehensive strategic approach and small business performance. Journal of Small Business
Paraphrase This Document
Need a fresh take? Get an instant paraphrase of this document with our AI Paraphraser
11
Strategy, 28(2), pp.33-48.
Williams, E.E. and Dobelman, J.A. (2017) Financial statement analysis. World Scientific Book
Chapters, pp.109-169.
Strategy, 28(2), pp.33-48.
Williams, E.E. and Dobelman, J.A. (2017) Financial statement analysis. World Scientific Book
Chapters, pp.109-169.
12
Appendix
Appendix 1: common size financial statements
Balance
sheet
Particul
ars
2014 20
15
20
16
20
17
20
18
201
5
201
6
201
7
201
8
201
5
2016 2017 2018
$’00
0
$’0
00
$’0
00
$’0
00
$’0
00
$’00
0
$’00
0
$’0
00
$’0
00
In percent
Assets
Current
Assets
Cash and
cash
equivale
nts
4,43
4
32,
03
5
32,
29
5
17,
47
9
87,
63
4
27,6
01
27,8
61
13,
045
83,
200
622.
49
%
628.3
5%
294.
20%
1876.
41%
Trade
and other
receivabl
es
6,44
3
20,
86
7
33,
88
7
37,
05
7
49,
31
7
14,4
24
27,4
44
30,
614
42,
874
223.
87
%
425.9
5%
475.
15%
665.4
4%
Current
tax
assets
125 0 67,
75
2
27
4
0 -125 67,6
27
149 -
125
-
100.
00
%
5410
1.60
%
119.
20%
-
100.0
0%
Inventori
es
7,73
7
17,
14
8
50
0
93,
49
7
90,
45
3
9,41
1
-
7,23
7
85,
760
82,
716
121.
64
%
-
93.54
%
1108
.44%
1069.
10%
Financial
assets
244 21
7
28
3
0 0 -27 39 -
244
-
244
-
11.0
7%
15.98
%
-
100.
00%
-
100.0
0%
Other
assets
2,69
5
40
7
4,4
75
2,0
51
2,7
48
-
2,28
8
1,78
0
-
644
53 -
84.9
0%
66.05
%
-
23.9
0%
1.97
%
Total
Current
Assets
21,6
78
70,
67
4
13
9,1
92
15
0,3
58
23
0,1
53
48,9
96
117,
514
128
,68
0
208
,47
5
226.
02
%
542.0
9%
593.
60%
961.6
9%
Non-
Current
Assets
Property,
plant and
equipme
nt
553 61
7
1,1
05
1,0
06
3,7
84
64 552 453 3,2
31
11.5
7%
99.82
%
81.9
2%
584.2
7%
Intangibl 228 10 1,7 1,7 40, -124 1,47 1,5 39, - 647.3 663. 1747
⊘ This is a preview!⊘
Do you want full access?
Subscribe today to unlock all pages.
Trusted by 1+ million students worldwide
1 out of 16
Related Documents


Your All-in-One AI-Powered Toolkit for Academic Success.
+13062052269
info@desklib.com
Available 24*7 on WhatsApp / Email
![[object Object]](/_next/static/media/star-bottom.7253800d.svg)
Unlock your academic potential
Copyright © 2020–2026 A2Z Services. All Rights Reserved. Developed and managed by ZUCOL.