Financial Analysis and Comparison of Bellway and Berkeley Companies
VerifiedAdded on 2019/09/21
|13
|2856
|464
Report
AI Summary
This report offers a comprehensive corporate analysis comparing Bellway and Berkeley, two prominent companies in the UK homebuilding industry. It begins with an overview of both companies, including their financial structures, funding sources, and asset structures. The analysis delves into capital and financial risk management, examining the maturity profiles of financial liabilities and the risk management processes employed by each company. The report further investigates the operating performance of both companies, analyzing key metrics like operating profit and asset turnover ratios. A detailed cash flow analysis is presented, comparing cash flow from operating, investing, and financing activities. The valuation and decision-making sections evaluate the net cash availability, free cash flow, and price-earnings ratios, highlighting the companies' financial health and market value. Finally, the report touches upon the application of agency theory within the context of these companies' operations and financial strategies. The report concludes with a summary of findings and a list of references.

Corporate Analysis
Paraphrase This Document
Need a fresh take? Get an instant paraphrase of this document with our AI Paraphraser
Table of Contents
Introduction......................................................................................................................................2
Overview of companies...................................................................................................................2
Financial structure...........................................................................................................................3
Capital & financial risk management..............................................................................................5
Assets and operating performance...................................................................................................6
Cash flow analysis...........................................................................................................................6
Valuation and decision....................................................................................................................7
Application of Agency theory.........................................................................................................9
Conclusion.....................................................................................................................................10
References......................................................................................................................................11
Introduction
In this present paper, we will discuss the corporate analysis of the companies, namely, Bellway
and Berkely Company. The paper describes the financial structure, capital and financial risk
management, asset and operating performance, valuation, and decision, cash flow analysis and
application of finance. Both the companies are lies under the homebuilding industry.
Headquarters of both the companies are in the United Kingdom.
Overview of companies
Bellway is one of the major property developers of the United Kingdom which is based in
Newcastle upon Tyne. The company is a public type company which is registered in the London
stock exchange, and it is the constituent of FTSE 250 index. The company was recognized in the
year 1946 and the total revenue of the company in the year 2015 was approximately £1,765.4
million. The operating income of the company is nearly £283.1million and the total employees of
the company in the year 2016 are approximately 2000. The company operates throughout the
United Kingdom, and it develops local designs with the assistance of the local people.
Berkeley group holding Plc. is the public listed company which is the British property developer.
The company is based in Cobham, Surrey. The company operates throughout the United
Kingdom, and it is listed on the London stock exchange and is a constituent of the FTSE 250
index. The company was established in the year 1976 and the total revenue of the company in the
year 2015 was £2,120.0 million . The net income of the company was £423.5 million. The
company won the Queens award for sustainable development in the year 2014. The company
⊘ This is a preview!⊘
Do you want full access?
Subscribe today to unlock all pages.
Trusted by 1+ million students worldwide
provides residential work under the various brands such as St George, Berkeley Homes, St
Edward, St James and St William.
Financial structure
1. Source of funding
The Berkeley Group Holdings use debt as well as equity sources of funding. The funding
also receives funding from local authorities and local government. The Bellway
Company receive funds from the government, debts, and equity. The company receive
funds from the government through various funding programs such as government
affordable homes program.
2. Asset structure
The assets structure of Bellway Company includes non-current assets which comprise of
property, plant, and machinery, investment in joint venture, investment property and
subsidiaries, deferred tax assets, and trade and other receivables. The current assets
include inventories, cash and equivalents, and trade and other receivables. The total
assets of the company in the year 2015 were 2,720,842 and in 2016 are 2,289,384. It
shows that the totals assets are increased by 4, 31,458.
The asset structures of Berkeley Company debtors, inventories, trade payables,
investment, and cash. The total assets of the company in the year 2016 are 3838 and in
2015 is 3406 (www.bellwaycorporate.com/pdf/annual-report-nov-2016.pdf et al., 2017).
It shows the total assets of the company are improved.
3. Maturity profile
Paraphrase This Document
Need a fresh take? Get an instant paraphrase of this document with our AI Paraphraser
The Bellway maturity profile of total contracted cash payment in respect to the amount
due on land creditors shows that the balance in the year 2015 was 192,642 and in the year
2016 is 304,160.The maturity profile of the total constricted payments in respect to the
financial liabilities in the year 2015 was 302,525, and in the year 2016 is 260,369. The
company has £467.5 million of undrawn bank facilities available.
The Berkeley Group Holdings maturity profile of non-current financial liabilities show
the amount in 2015 was (131.7) and in 2016 is (90.3) which show positive signing. The
liquidity risk of financial liabilities in the year 2015 was (679.5), and in the year 2016 is
(692.8) which show the negative sign (www.bellwaycorporate.com/pdf/annual-report-
nov-2016.pdf et al., 2017).
4. Risk management process
The Bellway Plc. has identified the various type of risks such as credit risk, liquidity
risk, interest rate risk, and house market risk. The company has developed treasure policy
in order to manage the various type of risk which impacts on the sales volume of the
company. The company has internal control committee which enables to manage the
internal risk.
The Berkeley Group Holdings has managed its risk in an effective manager by
identifying the types of risk, namely, operational and market risk. The company has the
market risk and operational risk in order to manage the risk which helps to maximize the
profitability of the company.
5. Financial policy
The treasury policy of the Berkeley Company is used to manage the day to day
operations. The relationship with the management of cash and banks are coordinated
centrally. The treasure policy is intended to maintain the accurate capital structure in
order to manage the financial risk which enables to provide the right path to the
operations of the company in order to manage operations risk (Holmes et al., 1991).
The financial policy of Bellway Company is used to manage the financial instruments of
the company in order to maximize the value of returns which enables to deliver high
value to the shareholder of the company.
Capital & financial risk management
The financial instruments of Bellway Company include bank loans, cash, overdraft and other
items for example trade payable and trade receivable which directly raise from the operation of
the company. The policy of the company is to maximize the returns through managing the cash
and operations of the company in an effective manner. Other financial instruments are owned by
group undertakings. The Bellway Company has maintained a strong capital base which helps to
underpin the future value of the company which enables to provide high value to the
shareholders. The operations of financed through reinvesting the profits of the company. The
board is responsible for managing the financial risk, and they have adopted various policies to
manage the risk. The treasure policy of the company is used to manage the risk in order to
provide high shared value to the shareholders of the company.
The Berkeley group has financed its operations from the combination of working capital,
appropriate borrowing and shareholders' funds. The objective of the company is to manage the
appropriate capital structure in order to create long-term value for the shareholders of the
⊘ This is a preview!⊘
Do you want full access?
Subscribe today to unlock all pages.
Trusted by 1+ million students worldwide
company with the flexibility of taking advantage of the opportunities in order to generate higher
profits within the particular period of time (Vogel et al., 2014). The company monitors the
capital level through the debt level of the company. The capital employed by the company in the
year 2016 is £1,705.4 million whereas the capital employed in the year 2015 was £1,207.0
million which shows that the capital employed is increased from the £498.4 million and it
reflects that the net assets of the company are increased during the year 2016. The company has
mainly three risks, namely credit risk, the market interest rate risk and liquidity risk.
Assets and operating performance
The operating performance of the Bellway Company is determined through the operating profit
of the company within the specific period of time. The operating profit of Bellway Company in
the year 2016 is 492,008, and in the year 2015 is 360,452 which show that the operating profit of
the company is increased by 36.49%. It shows that the operating performance of the company is
satisfactory. The assets turnover ratios of the company are 0.164 in 2016 and in 2015 is 0.154
which shows the utilization of assets have been improved (Lo et al., 2014).
The operating profit of Berkeley Group in the year 2016 is 501.9 and in 2015 are 524.1 which
show that the operating profit is reduced by 4.42%. It shows the operating performance of the
company unsatisfactory. The assets turnover ratios of the company are 129.4%in 2015 and in
2016 is 112.9% which shows that the utilization of assets has been reduced.
Cash flow analysis
The cash flow analysis is defined as the examination of inflow and outflow of the company
within the particular period of time. It is used to determine the financial position of the company
Paraphrase This Document
Need a fresh take? Get an instant paraphrase of this document with our AI Paraphraser
through analyzing the cash flow statement which includes three activities, namely, cash flow
from operating activities, cash flow from investing activities, and cash flow from financing
activities (Chen et al., 2015). Following is the cash flow analysis of both the companies in the
year 2015 and 2016.
1. Cash flow from operating activities
The Berkeley Company cash flow from operating activities in the year 2015 509.2 and in
the year 2016 is (6.3) which shows that the cash from operating activities is reduced. The
cash flow from operating activities of Bellway Company in the year 2016 is 162,693 and
in 2015 are 29,437 it shows the cash flow is improved.
2. Cash flow from investing activities
The Berkeley Company cash flow from investing activities in the year 2015 is 35.6 and in
2016 is (53.2) which are due to purchase of fixed assets. The cash flow from investing
activities of Bellway Company in 2016 is 13,404 and in 2015 are 957. It shows that the
cash flow is improved.
3. Cash flow from financing activities
The Berkeley Company cash flow from financing activities in the year 2015 is (244.1),
and in the year 2016 is (264) which show that the cash flow from financing activities has
poor performance. The cash flow from financing activities of Bellway Company is
(158620) and in 2015 is (22506) which shows the company has paid its dividend.
Valuation and decision
The net cash availability of the Berkeley Group in the year 2016 is 107.4 and in 2015 are 430.9
which show that the cash generation of the company is reduced. The financial liabilities of the
company in the year 2016 is (689.9) and in 2015 is (675.2) which shows that the available cash
of the company is not able to pay the debts of the company. The company is able to pay the
dividend to the shareholders of the company from the total profit of the company which is
£404.1 million which shows that the profitability of the company is increased by 5.6%.
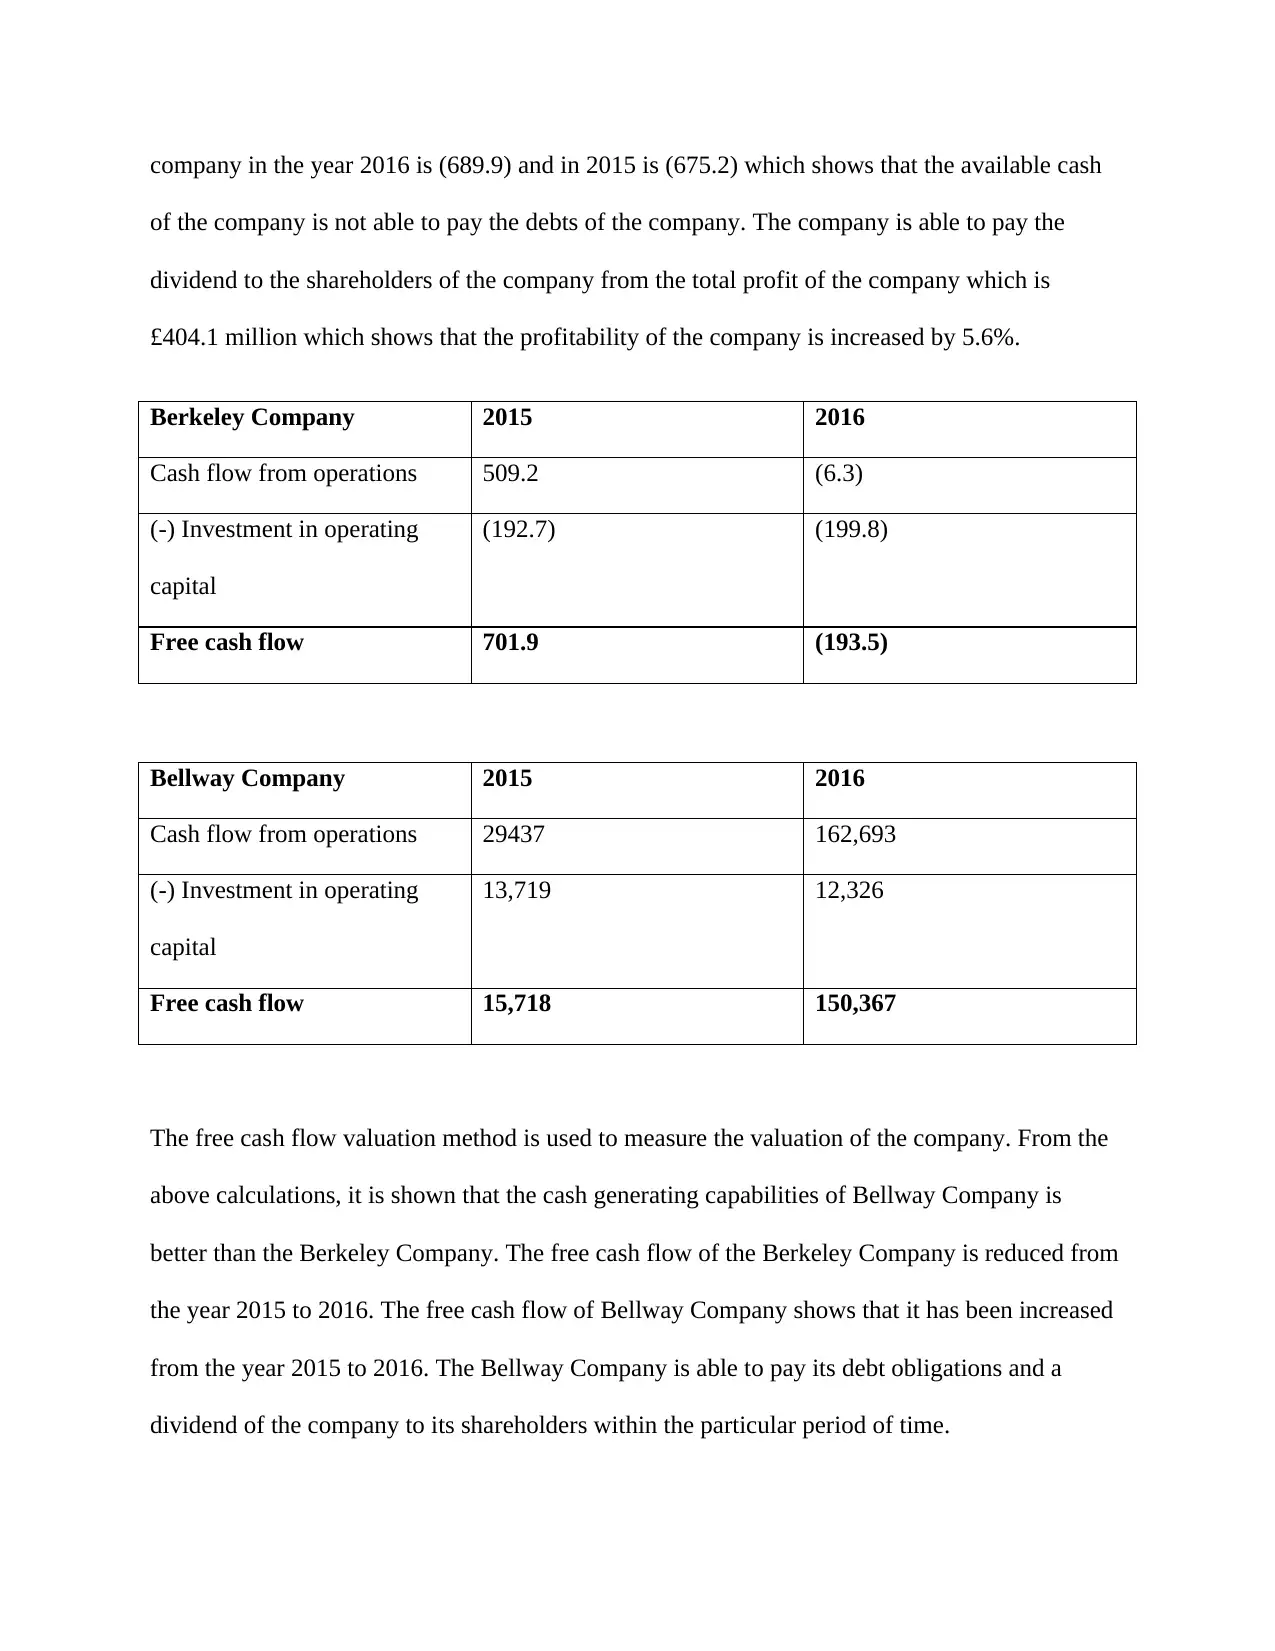
Berkeley Company 2015 2016
Cash flow from operations 509.2 (6.3)
(-) Investment in operating
capital
(192.7) (199.8)
Free cash flow 701.9 (193.5)
Bellway Company 2015 2016
Cash flow from operations 29437 162,693
(-) Investment in operating
capital
13,719 12,326
Free cash flow 15,718 150,367
The free cash flow valuation method is used to measure the valuation of the company. From the
above calculations, it is shown that the cash generating capabilities of Bellway Company is
better than the Berkeley Company. The free cash flow of the Berkeley Company is reduced from
the year 2015 to 2016. The free cash flow of Bellway Company shows that it has been increased
from the year 2015 to 2016. The Bellway Company is able to pay its debt obligations and a
dividend of the company to its shareholders within the particular period of time.
of the company is not able to pay the debts of the company. The company is able to pay the
dividend to the shareholders of the company from the total profit of the company which is
£404.1 million which shows that the profitability of the company is increased by 5.6%.
Berkeley Company 2015 2016
Cash flow from operations 509.2 (6.3)
(-) Investment in operating
capital
(192.7) (199.8)
Free cash flow 701.9 (193.5)
Bellway Company 2015 2016
Cash flow from operations 29437 162,693
(-) Investment in operating
capital
13,719 12,326
Free cash flow 15,718 150,367
The free cash flow valuation method is used to measure the valuation of the company. From the
above calculations, it is shown that the cash generating capabilities of Bellway Company is
better than the Berkeley Company. The free cash flow of the Berkeley Company is reduced from
the year 2015 to 2016. The free cash flow of Bellway Company shows that it has been increased
from the year 2015 to 2016. The Bellway Company is able to pay its debt obligations and a
dividend of the company to its shareholders within the particular period of time.
⊘ This is a preview!⊘
Do you want full access?
Subscribe today to unlock all pages.
Trusted by 1+ million students worldwide
The free cash flow is defined as the measure which is used to determine the financial
performance of the company by deducting the capital expenditure from the operating cash flow
of the company (Kazlauskienė et al., 2015). It enables to enhance the shareholder value of the
company. It mainly shows the ability of the company to generate the cash through expending on
the assets of the company.
The price-earnings ratio of Berkeley Company is currently 8.06, and the price earnings of
Bellway Company in 2016 are 8.422 which shows the market value of Bellway Company is
better than the Berkeley Company. The value of the company is compared to the current value
market value through determining the price-earnings ratio of the company. It is assumed that
higher the price earnings ratio mean higher the market value of the company.
Application of Agency theory
The agency theory states that in the agency relationship there are two parties, one party is an
agent who makes the decision, and another party is a principle for which the agent works on their
behalf. The agency theory attempts to summarize the problem and to solve the problem which
arises from the relationship between the principal and agent (Cavanagh et al., 2016). The
relationship exists automatically when the financial affairs of one are handled by another. For
example the financial planner takes the decision on behalf of the stakeholders. The agents are
motivated to work for the best interest on behalf of the principal. The common examples include
corporate management and shareholders, brokers and markets, and others. The company decides
to return so much cash to the shareholders of the company as according to the agency theory the
company is an agent and shareholders are principal so it is the duty of the company to provide
Paraphrase This Document
Need a fresh take? Get an instant paraphrase of this document with our AI Paraphraser
maximum value to the shareholders because the company workers to maximize the interest of
shareholders by taking the corrective decision within the specific time framework. The directors
paid so much money as they works on behalf of the shareholders in order to maximize the
returns which directly provide benefits to the company. According to the agency theory there is
default relationship between the shareholders and directors. The directors take decision on the
behalf of the company in order to maximize the revenue of the company which helps to grow the
business in a sustainable manner.
Conclusion
From the above analysis, it can be concluded that the operating performance and assets
utilization of Bellway Company is better than Berkeley Group. The cash flow analysis shows
that the Berkeley Company is not able to pay its debts from cash as there is cash deficit. The
Cash flow analysis shows that the ability to generate of Bellway Company is better than
Berkeley Company. The financial structure of the companies shows that the Bellway Company is
managing their assets in a most effective way then the Berkeley Company. The financial policy
of both the companies is managing the financial instruments of the company in order to provide
maximum value to the shareholders of the company. The financial risk management is managed
by the boards of the company through using the treasury policy which enables to manage the risk
in an effective manner. Thus the financial performance of Bellway Company is better than
Berkeley Company.
References
(2017). Retrieved 1 March 2017, from http://www.bellwaycorporate.com/pdf/annual-report-nov-
2016.pdf
(2017). Retrieved 1 March 2017, from
https://www.berkeleygroup.co.uk/media/pdf/4/m/berkeley-annual-report-2016-v2-
spreads_v3.pdf
Holmes, S., & Kent, P. (1991). An empirical analysis of the financial structure of small and large
Australian manufacturing enterprises. The Journal of Entrepreneurial Finance, 1(2), 141.
Vogel, H. L. (2014). Entertainment industry economics: A guide for financial analysis.
Cambridge University Press.
Lo, C. K., Pagell, M., Fan, D., Wiengarten, F., & Yeung, A. C. (2014). OHSAS 18001
certification and operating performance: The role of complexity and coupling. Journal of
Operations Management, 32(5), 268-280.
Chen, S. C., & Teng, J. T. (2015). Inventory and credit decisions for time-varying deteriorating
items with up-stream and down-stream trade credit financing by discounted cash flow analysis.
European Journal of Operational Research, 243(2), 566-575.
Kazlauskienė, V., & Christauskas, Č. (2015). Business valuation model based on the analysis of
business value drivers. Engineering Economics, 57(2).
⊘ This is a preview!⊘
Do you want full access?
Subscribe today to unlock all pages.
Trusted by 1+ million students worldwide
1 out of 13
Related Documents


Your All-in-One AI-Powered Toolkit for Academic Success.
+13062052269
info@desklib.com
Available 24*7 on WhatsApp / Email
![[object Object]](/_next/static/media/star-bottom.7253800d.svg)
Unlock your academic potential
Copyright © 2020–2026 A2Z Services. All Rights Reserved. Developed and managed by ZUCOL.