Benchmarking Effectiveness in UAE Manufacturing: A Practical Study
VerifiedAdded on 2023/06/15
|41
|7569
|382
Report
AI Summary
This study investigates the effectiveness of benchmarking applications in manufacturing organizations in the UAE, with a focus on dairy manufacturing companies. Data was collected through questionnaires distributed to production and quality managers, and analyzed using MS Excel. The research finds that manufacturing process factors like compatibility, complexity, and flexibility significantly influence benchmarking effectiveness, enhancing competitiveness and production output. The study concludes that benchmarking positively correlates with increased production and recommends its adoption for companies seeking to improve performance. The research methodology includes a deductive approach, descriptive research design, and quantitative data analysis. Ethical considerations were maintained throughout the data collection process to ensure valid results. The report includes frequency analysis, descriptive statistics, reliability analysis, correlation, hypothesis testing, and regression analysis to support its findings.

Running head: MEASURING THE EFFECTIVENESS OF BENCH MARKING
APPLICATION IN MANUFACTURING ORGANIZATIONS: PRACTICAL EXAMPLES OF
UNITED ARAB EMIRATES
Measuring the effectiveness of bench marking application in manufacturing organizations:
practical examples of United Arab Emirates
Name of the Student:
Name of the University:
Author’s Note:
APPLICATION IN MANUFACTURING ORGANIZATIONS: PRACTICAL EXAMPLES OF
UNITED ARAB EMIRATES
Measuring the effectiveness of bench marking application in manufacturing organizations:
practical examples of United Arab Emirates
Name of the Student:
Name of the University:
Author’s Note:
Paraphrase This Document
Need a fresh take? Get an instant paraphrase of this document with our AI Paraphraser

1MEASURING THE EFFECTIVENESS OF BENCH MARKING APPLICATION IN
MANUFACTURING ORGANIZATIONS: PRACTICAL EXAMPLES OF UNITED ARAB
EMIRATES
Abstract
This study aims to measure the best practices that lead to the effectiveness of benchmarking
application in UAE manufacturing organizations, through a field study on dairy manufacturing
companies in UAE. In order to achieve such objectives, a total of 120 questionnaires are
distributed to population of study, specifically to production manager, quality manager and other
staff that are involved in the benchmarking process in organizations. MS Excel was used for data
analysis. The study concluded with some results that manufacturing process factor, such as
compatibility, complexity, and flexibility, significantly influence the effectiveness of the
benchmarking in manufacturing sector by increasing competitiveness as well as enhancing
production output. The results that have been attained in accordance to this paper explains the
fact that all the results that have been attained with respect to benchmarking is that all the three
variables are positively correlated to each other and thereby explaining that benchmarking is able
to enhance the production facility of the manufacturing companies in UAE. The study
recommends that those companies that do not apply benchmarking can do so to enhance their
production and competitiveness.

2MEASURING THE EFFECTIVENESS OF BENCH MARKING APPLICATION IN
MANUFACTURING ORGANIZATIONS: PRACTICAL EXAMPLES OF UNITED ARAB
EMIRATES
Table of Contents
Chapter 3: Research Methodology..................................................................................................5
3.1 Introduction............................................................................................................................5
3.2 Research Approach................................................................................................................5
3.3 Research Design....................................................................................................................5
3.4 Choice of the Methodology...................................................................................................6
3.5 Data Collection Process.........................................................................................................6
3.6 Sampling and Sample Size....................................................................................................7
3.7 Data Analysis Plan.................................................................................................................7
3.8 Ethical Consideration.............................................................................................................7
Chapter 4: Data Analysis and Discussion........................................................................................8
4.1 Introduction............................................................................................................................8
4.2 Frequency Analysis...............................................................................................................8
Question No 1..........................................................................................................................8
Question No 2..........................................................................................................................9
Question No 3..........................................................................................................................9
Question No 4........................................................................................................................10
Question No 5........................................................................................................................11
Question No 6........................................................................................................................11
Question No 7........................................................................................................................12
⊘ This is a preview!⊘
Do you want full access?
Subscribe today to unlock all pages.
Trusted by 1+ million students worldwide
3MEASURING THE EFFECTIVENESS OF BENCH MARKING APPLICATION IN
MANUFACTURING ORGANIZATIONS: PRACTICAL EXAMPLES OF UNITED ARAB
EMIRATES
Question No 8........................................................................................................................12
Question No 9........................................................................................................................13
Question No 10......................................................................................................................14
Question No 11......................................................................................................................14
Question No 12......................................................................................................................15
Question No 13......................................................................................................................15
Question No 14......................................................................................................................16
Question No 15......................................................................................................................16
Question No 16......................................................................................................................17
Question No 17......................................................................................................................18
Question No 18......................................................................................................................18
Question No 19......................................................................................................................19
4.3 Descriptive Statistics...........................................................................................................20
4.4 Reliability Analysis.............................................................................................................22
4.5 Mean and Standard Deviation.............................................................................................27
4.6 Correlation...........................................................................................................................28
4.7 Hypothesis...........................................................................................................................29
4.8 Regression............................................................................................................................32
4.9 Interview Questions.............................................................................................................33
Chapter 5: Conclusion, Recommendation and Future Work.........................................................35
Paraphrase This Document
Need a fresh take? Get an instant paraphrase of this document with our AI Paraphraser
4MEASURING THE EFFECTIVENESS OF BENCH MARKING APPLICATION IN
MANUFACTURING ORGANIZATIONS: PRACTICAL EXAMPLES OF UNITED ARAB
EMIRATES
5.1 Conclusion...........................................................................................................................35
5.2 Recommendation.................................................................................................................35
5.3 Future Work.........................................................................................................................36
Reference List................................................................................................................................37
Bibliography..................................................................................................................................39

5MEASURING THE EFFECTIVENESS OF BENCH MARKING APPLICATION IN
MANUFACTURING ORGANIZATIONS: PRACTICAL EXAMPLES OF UNITED ARAB
EMIRATES
Chapter 3: Research Methodology
3.1 Introduction
This section of the paper has been constructed in order to have some idea about the
process that would be undertaken in order to gather the data that is related to the research topic.
The research has several kinds of data that is available in their arsenal and it is on the topic that is
taken into consideration and the discretion of the researcher. The methodology section of the
paper would explain the research approach, research design, the process of data collection, the
data analysis plan, the sample size, with the help of which relevant data would be collected.
3.2 Research Approach
The research approach refers to the theories and the frameworks that are used by the
researchers in order to collect the data and thereby take measures that would be helpful in
completing the paper in an effective manner. It is seen that there are two kinds of approaches that
are available to the researchers and in this paper the researcher has chosen deductive approach.
Deductive approach has been chosen as the researcher would look to make use of the theories
and the models that already been used by the other researchers as it is seen that the researcher has
been looking to making use of tools and techniques that are already available rather than
constructing a new and innovative technique for the purpose of data collection (Ferme et al.,
2016).
3.3 Research Design
The research design refers to the design or the style in which the data would be collected
and thereafter this data would be used for the purpose of data analysis (Lu et al., 2015). There are
three kinds of designs that are available to the researchers and in accordance to the current
⊘ This is a preview!⊘
Do you want full access?
Subscribe today to unlock all pages.
Trusted by 1+ million students worldwide

6MEASURING THE EFFECTIVENESS OF BENCH MARKING APPLICATION IN
MANUFACTURING ORGANIZATIONS: PRACTICAL EXAMPLES OF UNITED ARAB
EMIRATES
research topic, it is seen that the researcher has chosen descriptive research design because of the
fact that the data which has been collected would be addressed in an explicit manner thereby
bringing the core meaning out of the data. This design ideally suited for this paper as the research
topic looking to discover the benchmarking process in the manufacturing industries in UAE.
3.4 Choice of the Methodology
The researcher in this paper would be making use of the primary data that would be
collected from the respondents who have been chosen from the manufacturing companies in
UAE and this data would be converted in figures and numerical in order to attain the effective
results (Iyer, & Banerjee 2016). In this manner the quantitative data analysis has been taken into
consideration because of the fact that the results that have been obtained would be in figures and
thereby effective results in accordance to this topic can be attained. The researcher in this sense
has even selected quantitative data.
3.5 Data Collection Process
The process of data collection has been undertaken by constructing a close ended
questionnaire for the purpose of survey analysis and accordingly the researcher has created
questionnaires according to the topic. The close ended questions motivate the respondents to
answer in a free manner and thereby true and authentic results can be attained. The researcher
has looked to make use of primary data and therefore questionnaire formation is vital for the
purpose of collection of data (Vamsi Krishna Jasti, & Kodali 2014). The questionnaires are
forwarded to the respondents via electronic mail and accordingly they are asked to fill up the
same and submit within the desired timeline. The researcher even has constructed interview
questions with the help of which the responses of the management level employees are even
collected.
Paraphrase This Document
Need a fresh take? Get an instant paraphrase of this document with our AI Paraphraser

7MEASURING THE EFFECTIVENESS OF BENCH MARKING APPLICATION IN
MANUFACTURING ORGANIZATIONS: PRACTICAL EXAMPLES OF UNITED ARAB
EMIRATES
3.6 Sampling and Sample Size
The process of sampling refers to the process with the help of which a pool of
respondents have been chosen and accordingly the results can be attained (Cereda et al., 2016).
The researcher in this paper has selected 120 respondents from the employees who are working
in the manufacturing industries with the help of random sampling and thereby results can be
obtained that is suitable for this paper.
3.7 Data Analysis Plan
The data analysis plan refers to the course that would be undertaken with the help of
which the analysis of the collected data can be completed. In this manner the researcher has
taken assistance of Excel software with the help of which various analysis techniques would be
used by the researcher in order to attain the desired results for this paper (Fernandez et al., 2016).
3.8 Ethical Consideration
The preservation of ethics has an essential role to play so that true and valid data is used
for the purpose of data collection and therefore the researcher is looking to gather data in
accordance to the codes and regulations that have been laid down by the international and
national bodies (Heydarian et al., 2015). The maintenance of ethics leads to the development of
the true and fair results and thereby this result can be used for the readers for future references.
8MEASURING THE EFFECTIVENESS OF BENCH MARKING APPLICATION IN
MANUFACTURING ORGANIZATIONS: PRACTICAL EXAMPLES OF UNITED ARAB
EMIRATES
Chapter 4: Data Analysis and Discussion
4.1 Introduction
The process of data analysis is undertaken by taking assistance of the data that has been
collected from the selected respondents. The data is gone through several kinds of analysis and
thereby attain results that are ideal for the completion of this paper. This section of the paper
would assess the various techniques that have been used in order to gain the result associated
with the benchmarking process in the manufacturing companies in UAE.
4.2 Frequency Analysis
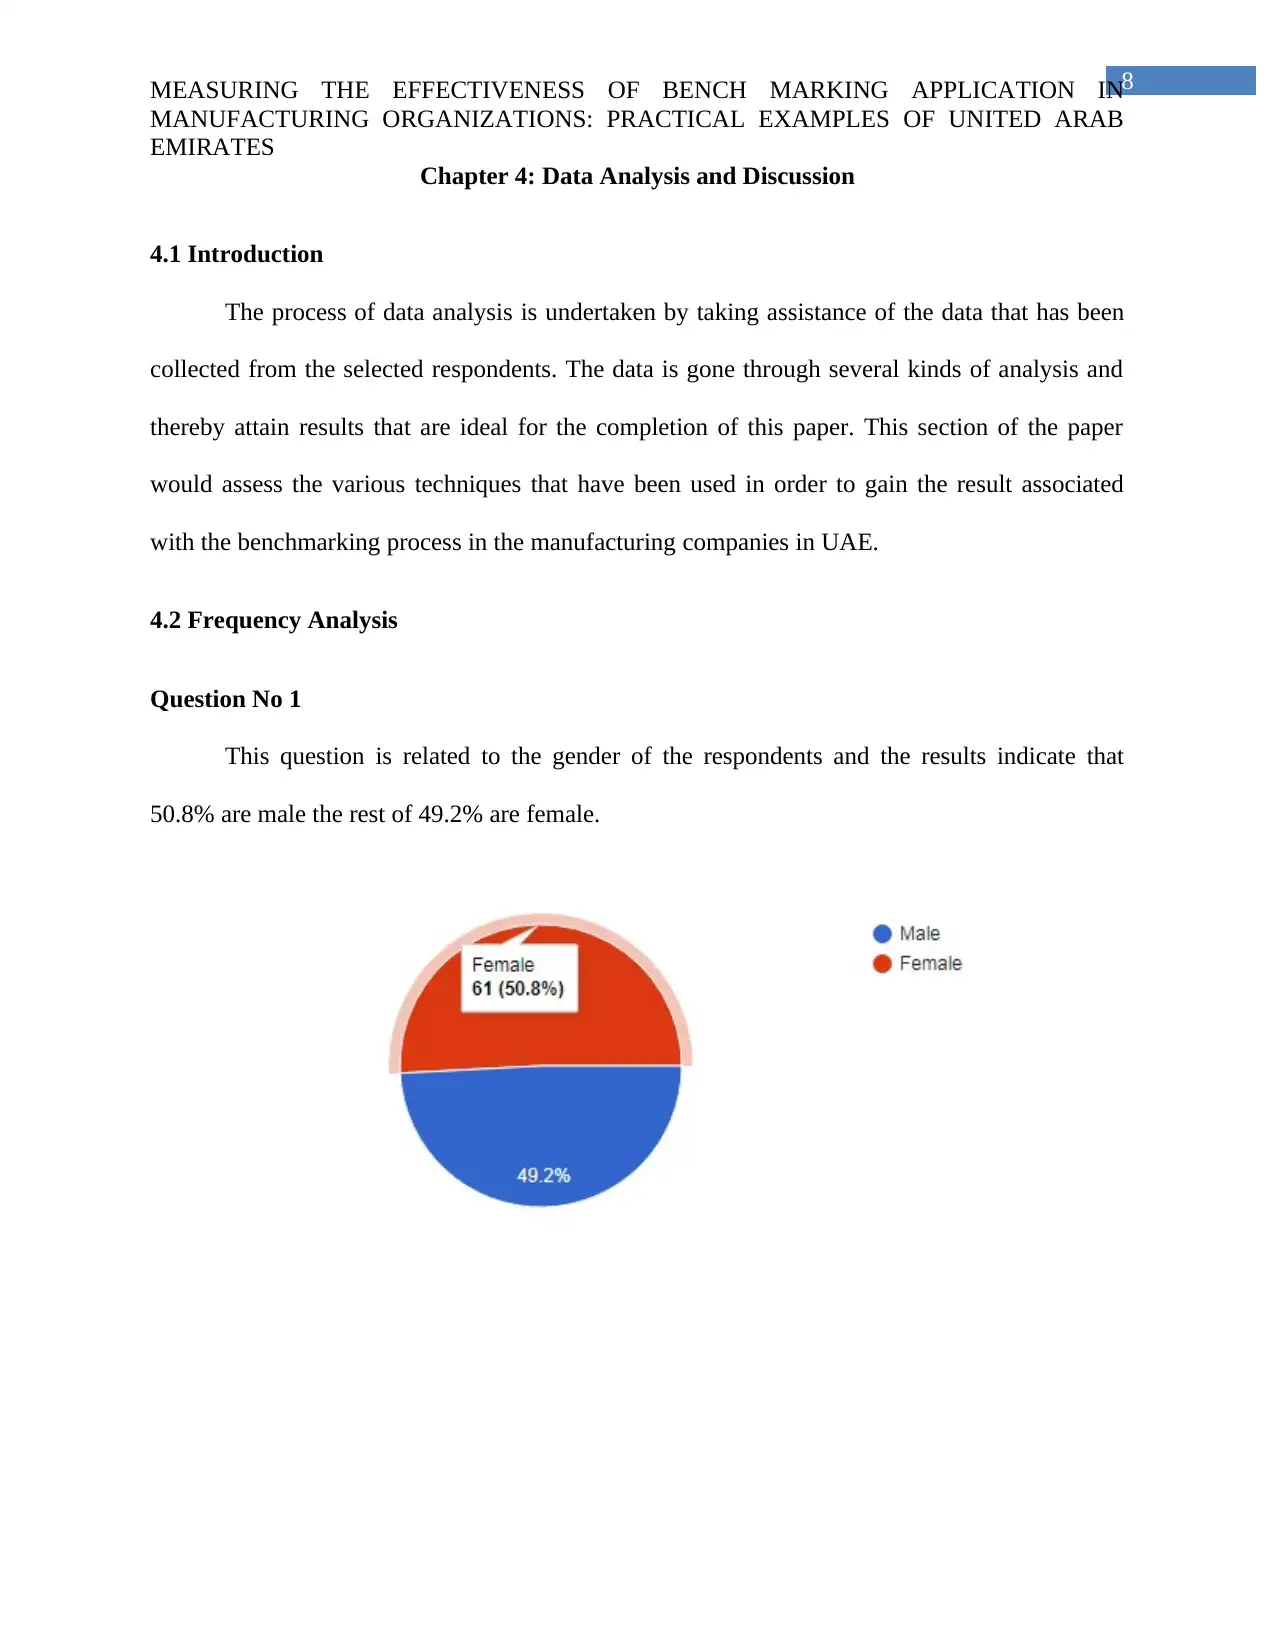
Question No 1
This question is related to the gender of the respondents and the results indicate that
50.8% are male the rest of 49.2% are female.
MANUFACTURING ORGANIZATIONS: PRACTICAL EXAMPLES OF UNITED ARAB
EMIRATES
Chapter 4: Data Analysis and Discussion
4.1 Introduction
The process of data analysis is undertaken by taking assistance of the data that has been
collected from the selected respondents. The data is gone through several kinds of analysis and
thereby attain results that are ideal for the completion of this paper. This section of the paper
would assess the various techniques that have been used in order to gain the result associated
with the benchmarking process in the manufacturing companies in UAE.
4.2 Frequency Analysis
Question No 1
This question is related to the gender of the respondents and the results indicate that
50.8% are male the rest of 49.2% are female.
⊘ This is a preview!⊘
Do you want full access?
Subscribe today to unlock all pages.
Trusted by 1+ million students worldwide

9MEASURING THE EFFECTIVENESS OF BENCH MARKING APPLICATION IN
MANUFACTURING ORGANIZATIONS: PRACTICAL EXAMPLES OF UNITED ARAB
EMIRATES
Question No 2
This question is related to the experiences of the employees within these organizations.
The results have indicated that 39.2% have experience of 5-10 years and 20.8% have experience
of 10-15 years. 15% of them have experience of 1-5 years, while 13.3% are having experience of
lower than 1 year. A small percentage of 11.7% have experience of 15 years and above. It is
indicative of the fact that most of the respondents are reasonably experienced in this industry and
therefore will be able to give out effective results.
Question No 3
This question has explained that the respondents feel that 36.7% agree to this question
and on the other hand 32.5% disagree to this point. On the other hand 20.8% strongly disagree to
this point and the rest of 10% strongly agree. This indicates that practice is ideally suited for
them.
Paraphrase This Document
Need a fresh take? Get an instant paraphrase of this document with our AI Paraphraser

10MEASURING THE EFFECTIVENESS OF BENCH MARKING APPLICATION IN
MANUFACTURING ORGANIZATIONS: PRACTICAL EXAMPLES OF UNITED ARAB
EMIRATES
Question No 4
This question has tried to answer the fact whether the practise will cause any sort of
problem and the results indicate that 50.8% agree to this point and 22.5% disagree to this point.
15.8% strongly agree to this point and 10.8% strongly disagree. This indicates that these
problems may cause problems to the company.

11MEASURING THE EFFECTIVENESS OF BENCH MARKING APPLICATION IN
MANUFACTURING ORGANIZATIONS: PRACTICAL EXAMPLES OF UNITED ARAB
EMIRATES
Question No 5
50% of the respondents have agreed to the fact that these practices require changes in the
operating activities of the company and on the other hand 22.5% disagreed to this point. 16.7%
strongly agreed to this point and 10% strongly disagreed.
Question No 6
The results indicate that 47.5% agreed to this question, while 23.8% strongly agree to this
question. On the other hand, 20.8% disagree to this point and a small percentage of 8.3%
strongly disagree. This indicates that the respondents feel that these practises require few
changes in the business of the company.
⊘ This is a preview!⊘
Do you want full access?
Subscribe today to unlock all pages.
Trusted by 1+ million students worldwide
1 out of 41
Related Documents


Your All-in-One AI-Powered Toolkit for Academic Success.
+13062052269
info@desklib.com
Available 24*7 on WhatsApp / Email
![[object Object]](/_next/static/media/star-bottom.7253800d.svg)
Unlock your academic potential
Copyright © 2020–2026 A2Z Services. All Rights Reserved. Developed and managed by ZUCOL.