Economic Appraisal: Benefit-Cost Analysis of Road Project Options

Verified

Added on  2022/12/14

|11
|1357
|353
Project
AI Summary
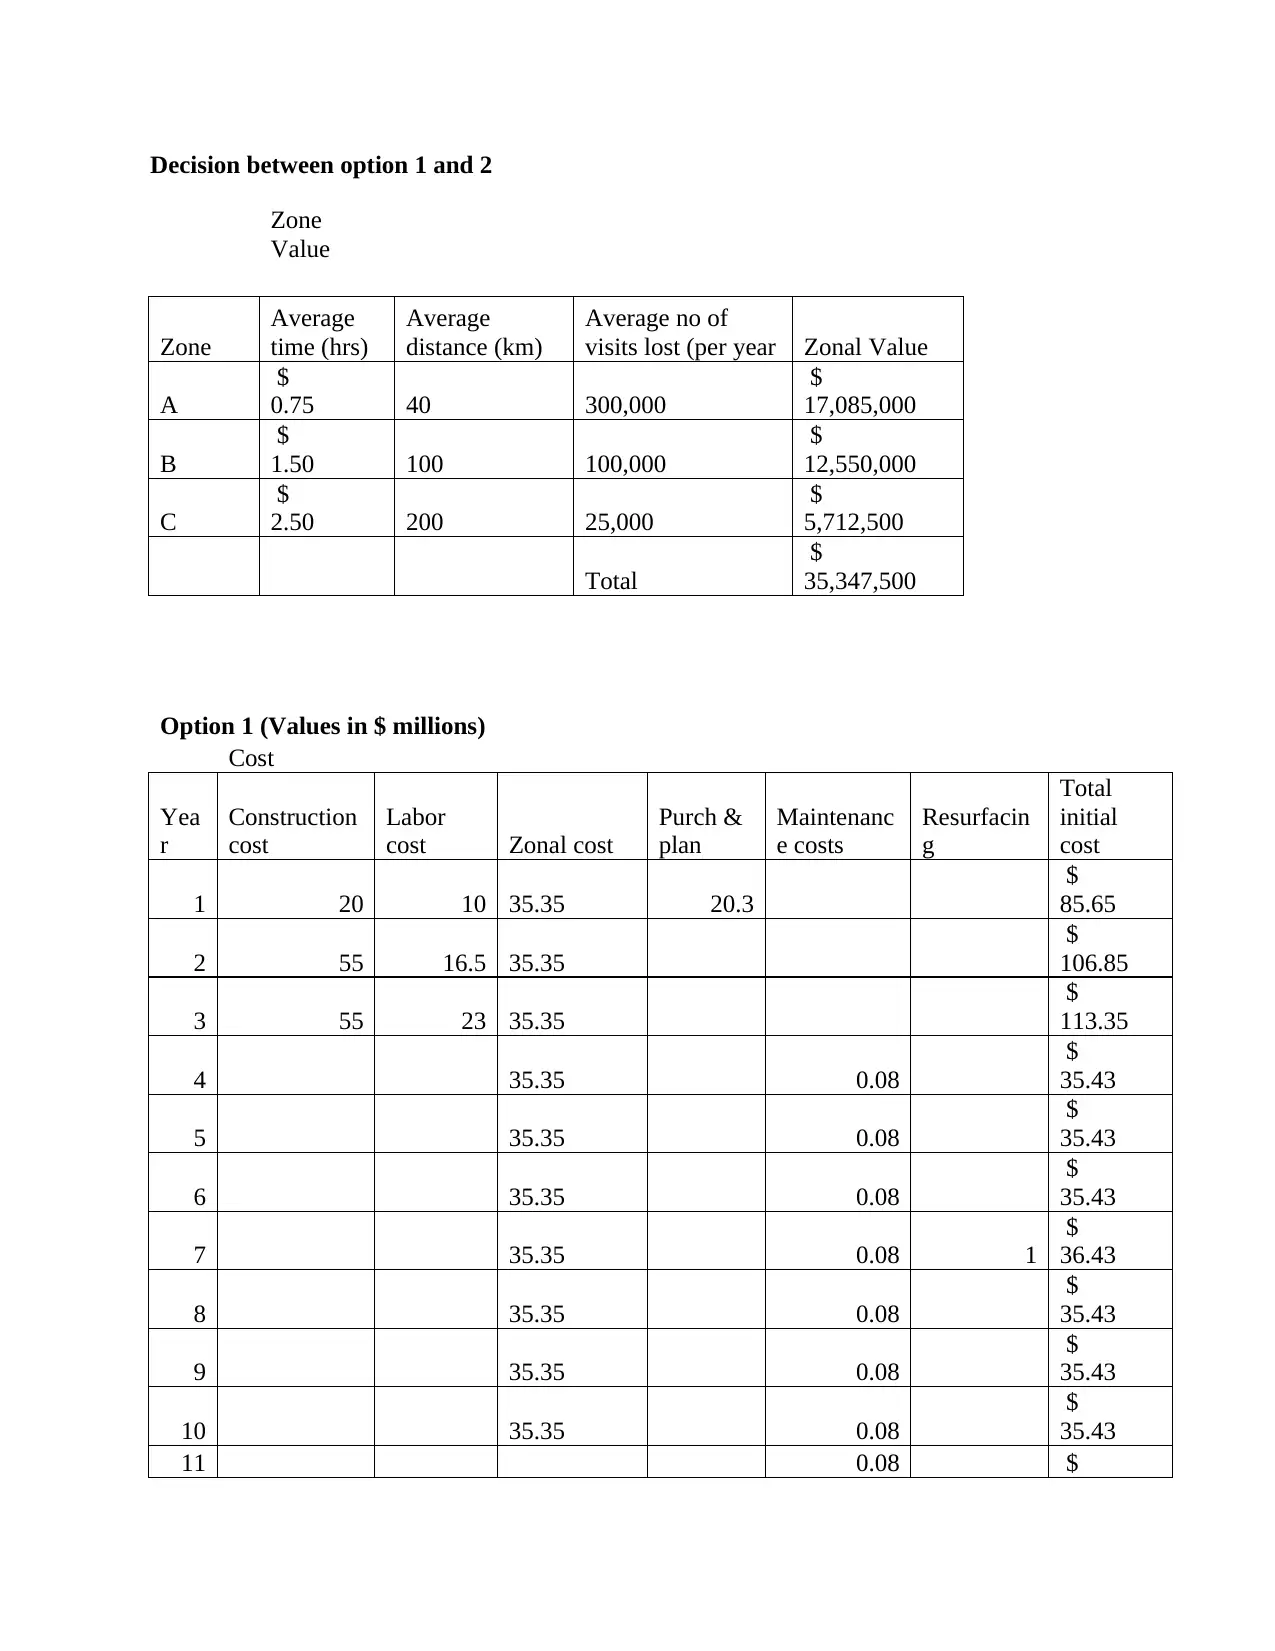
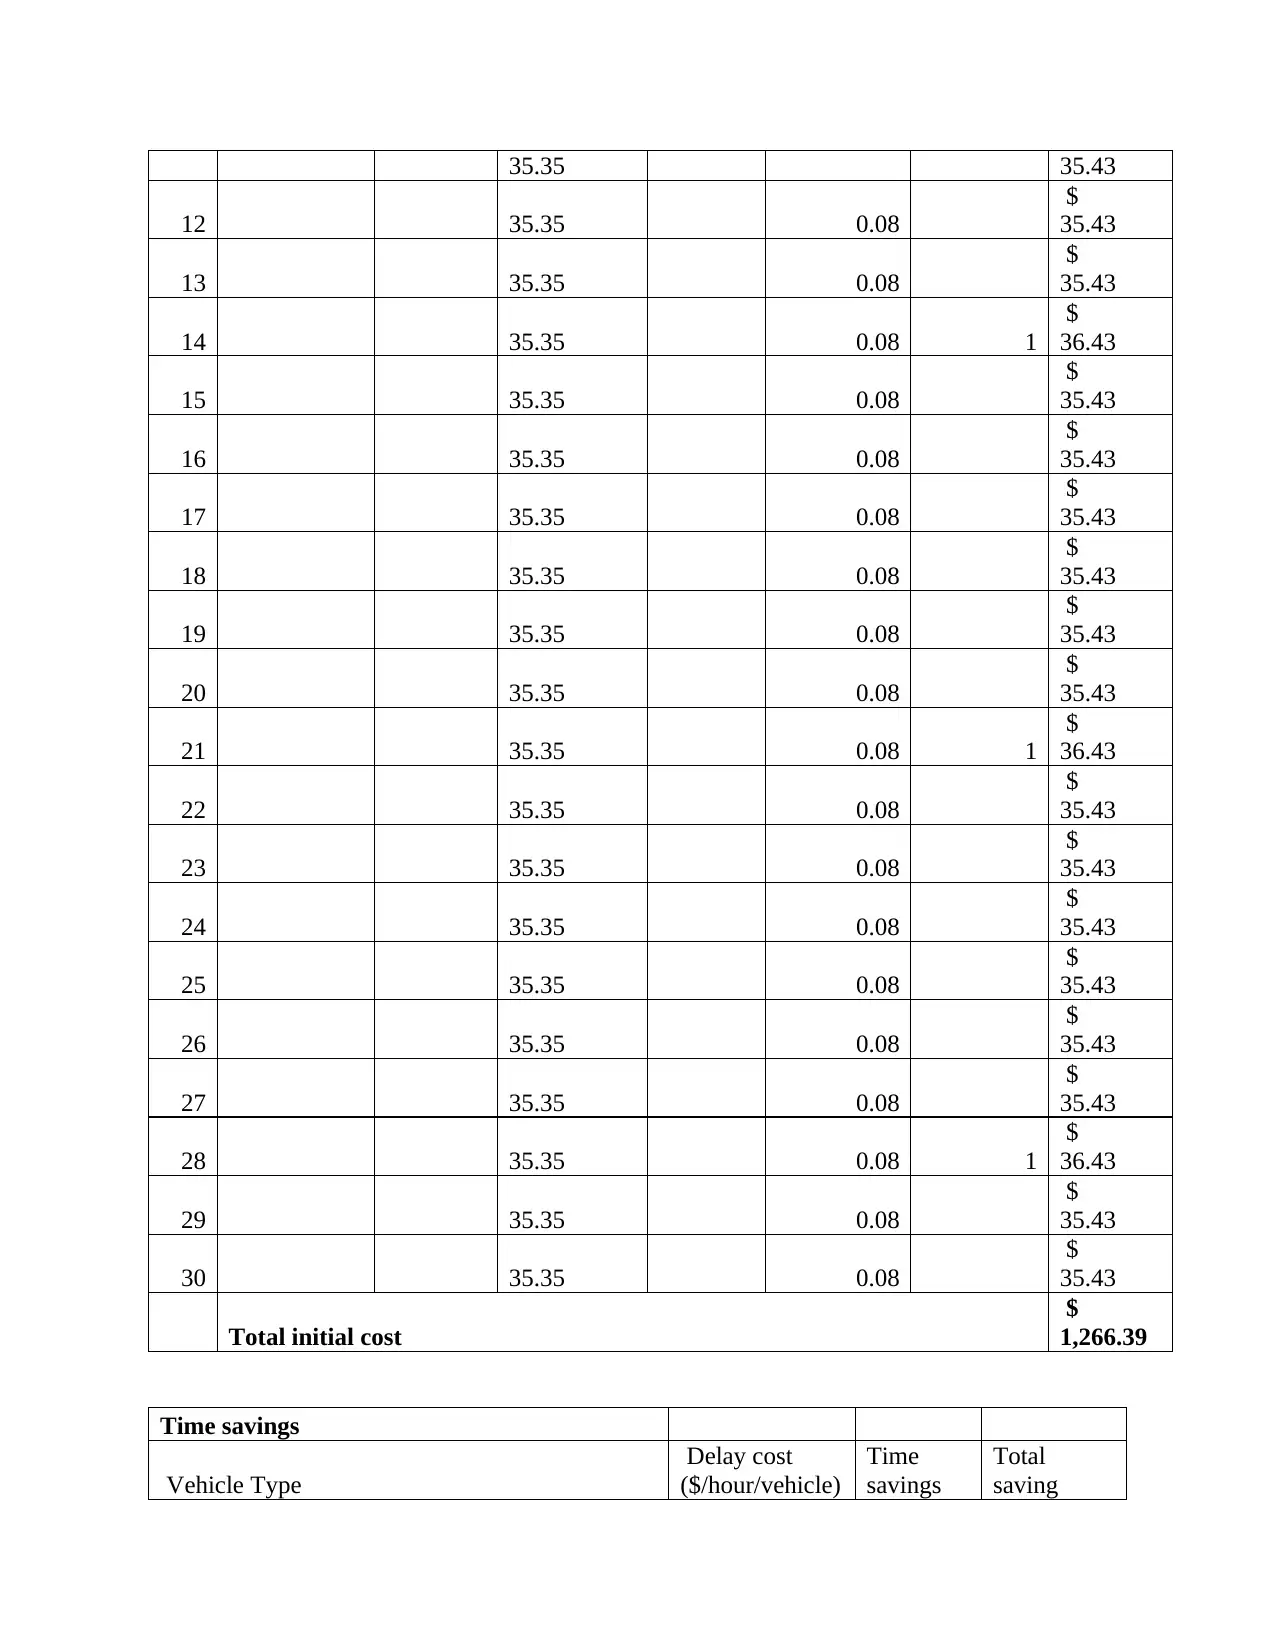
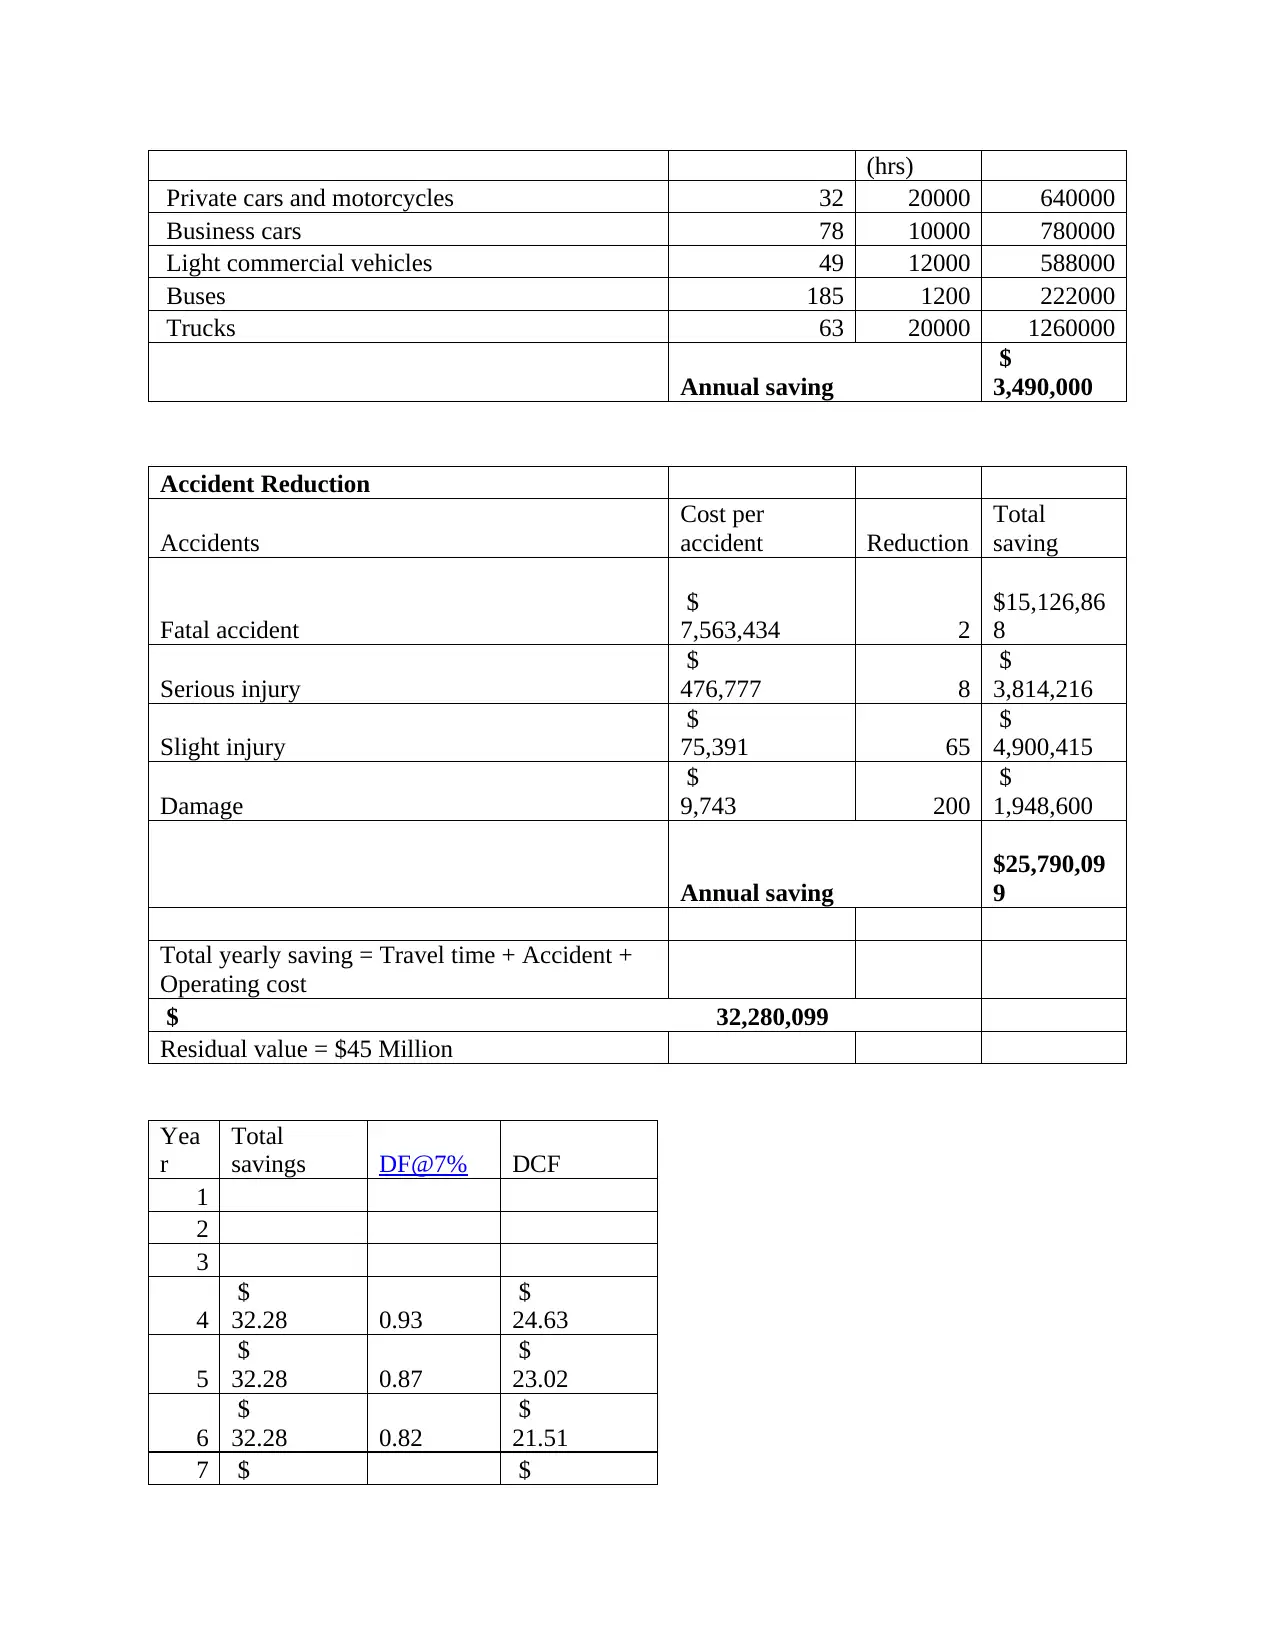
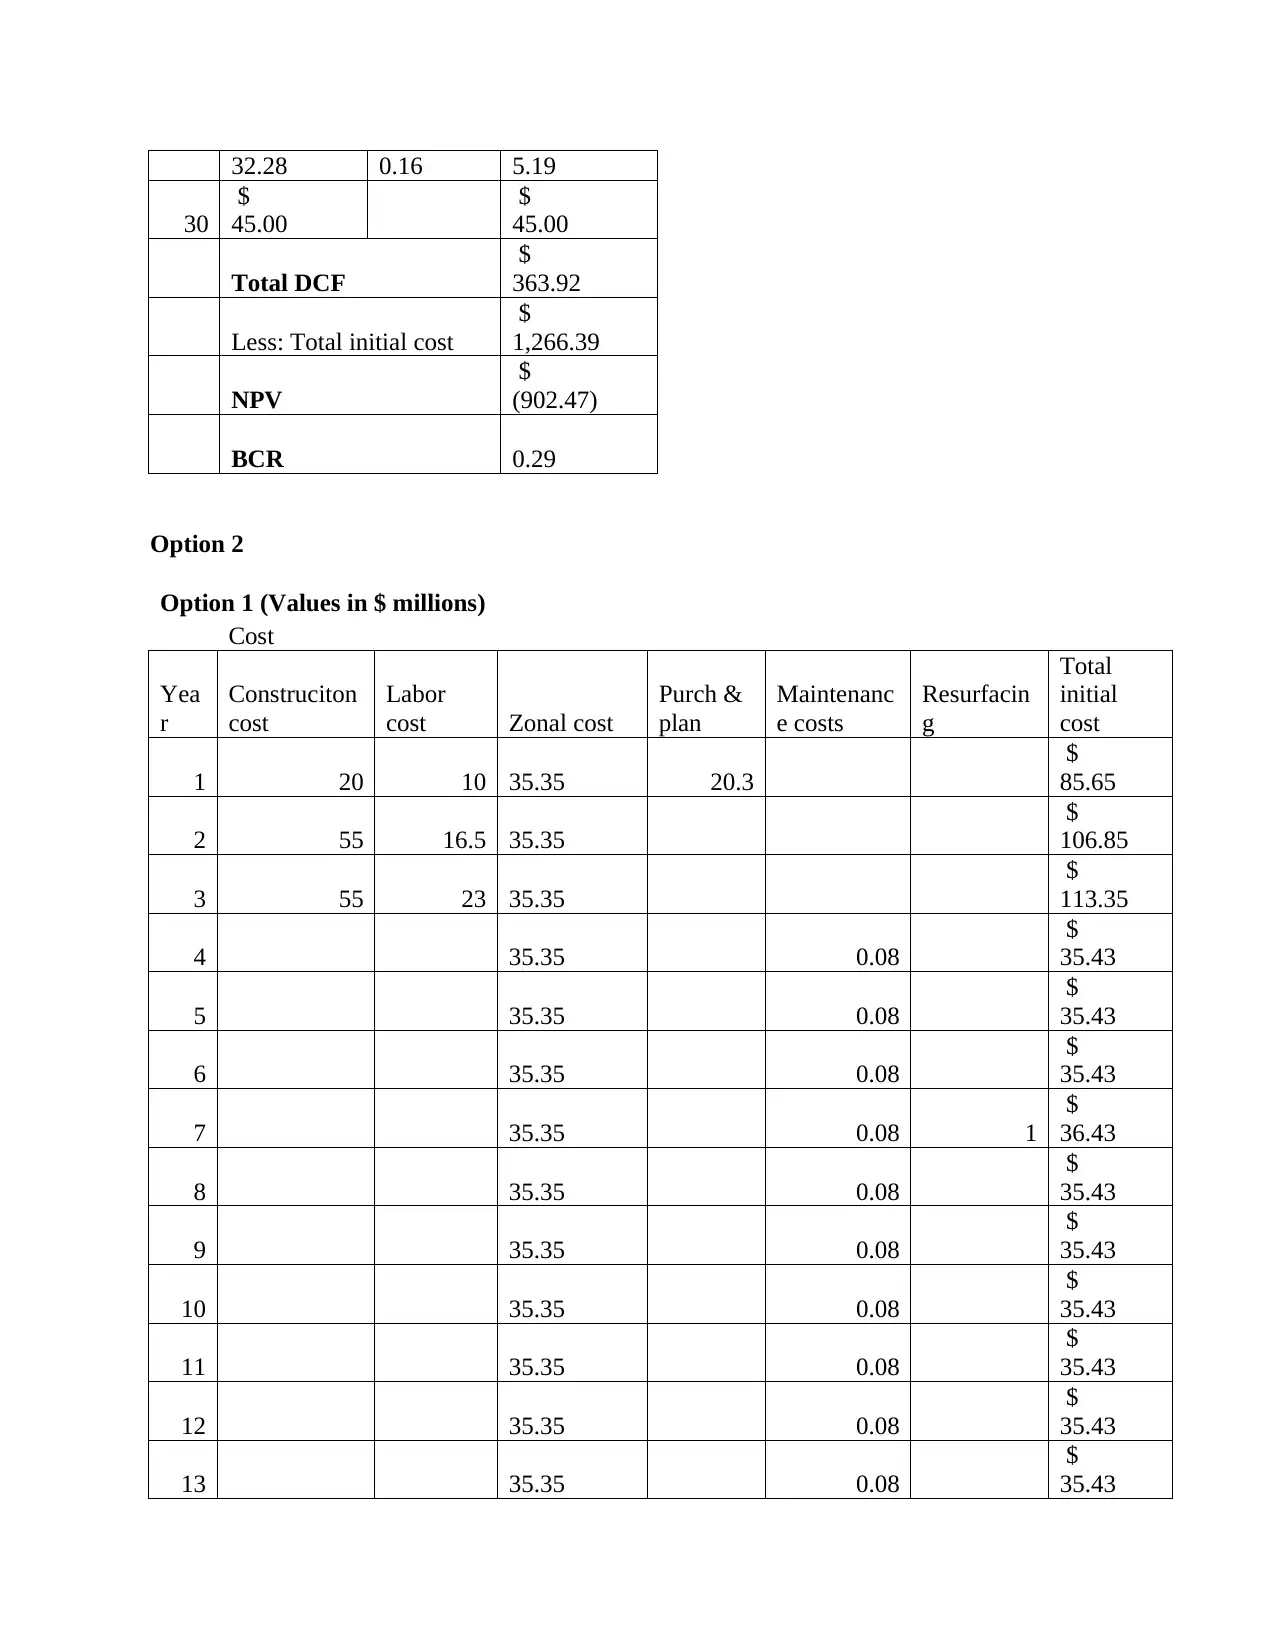
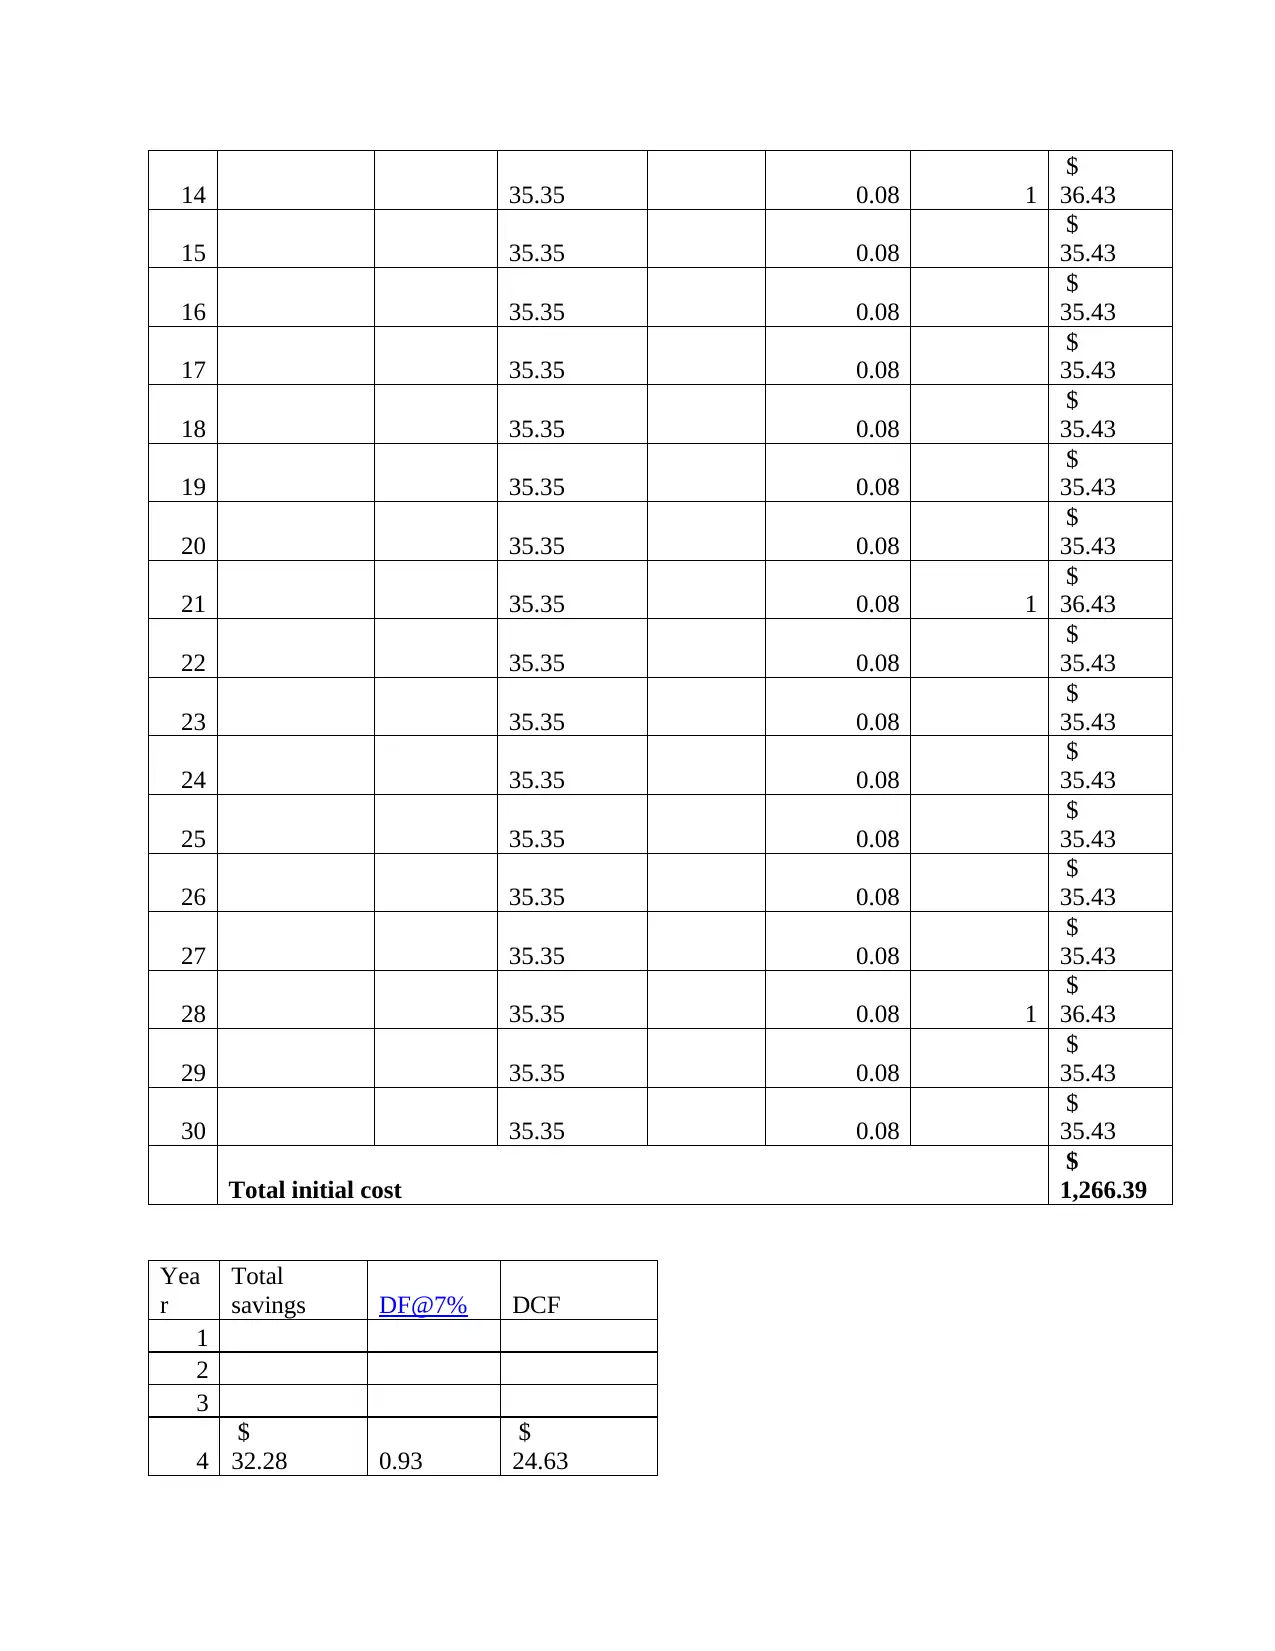
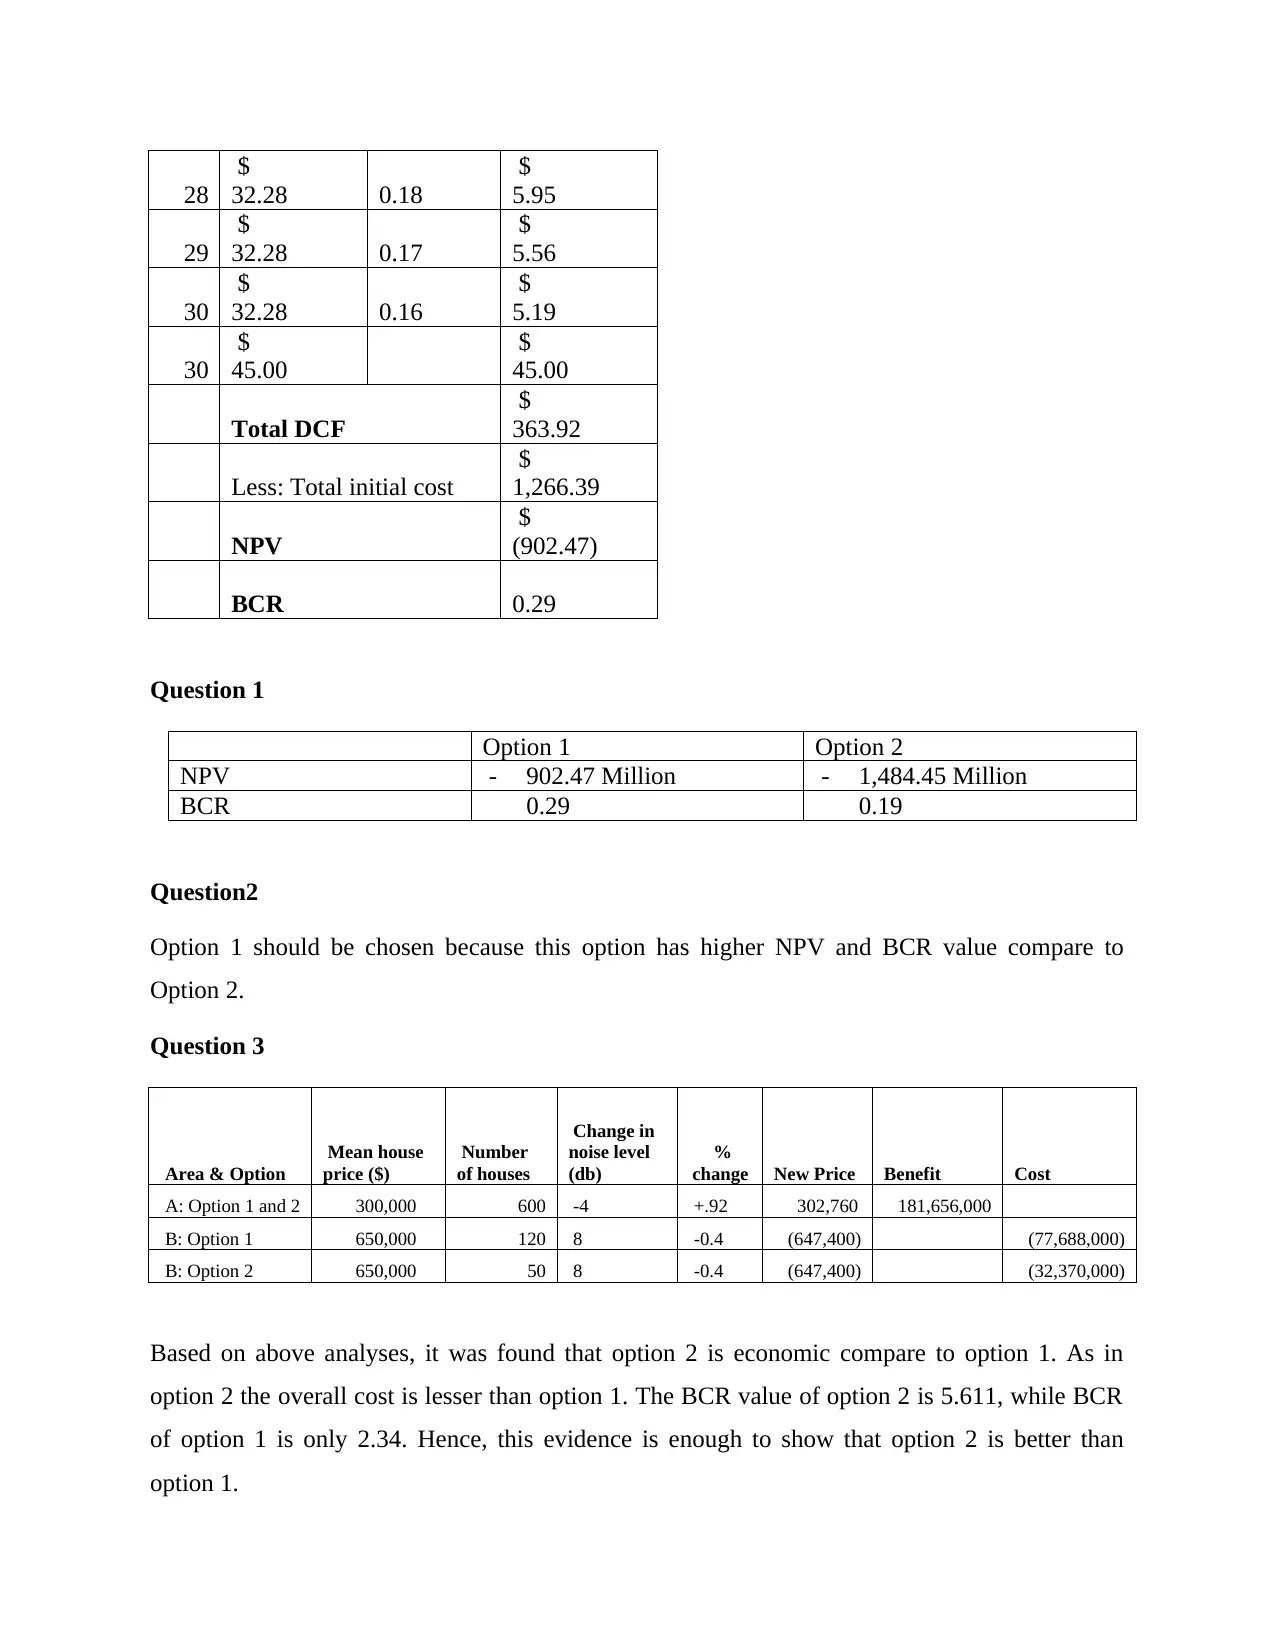
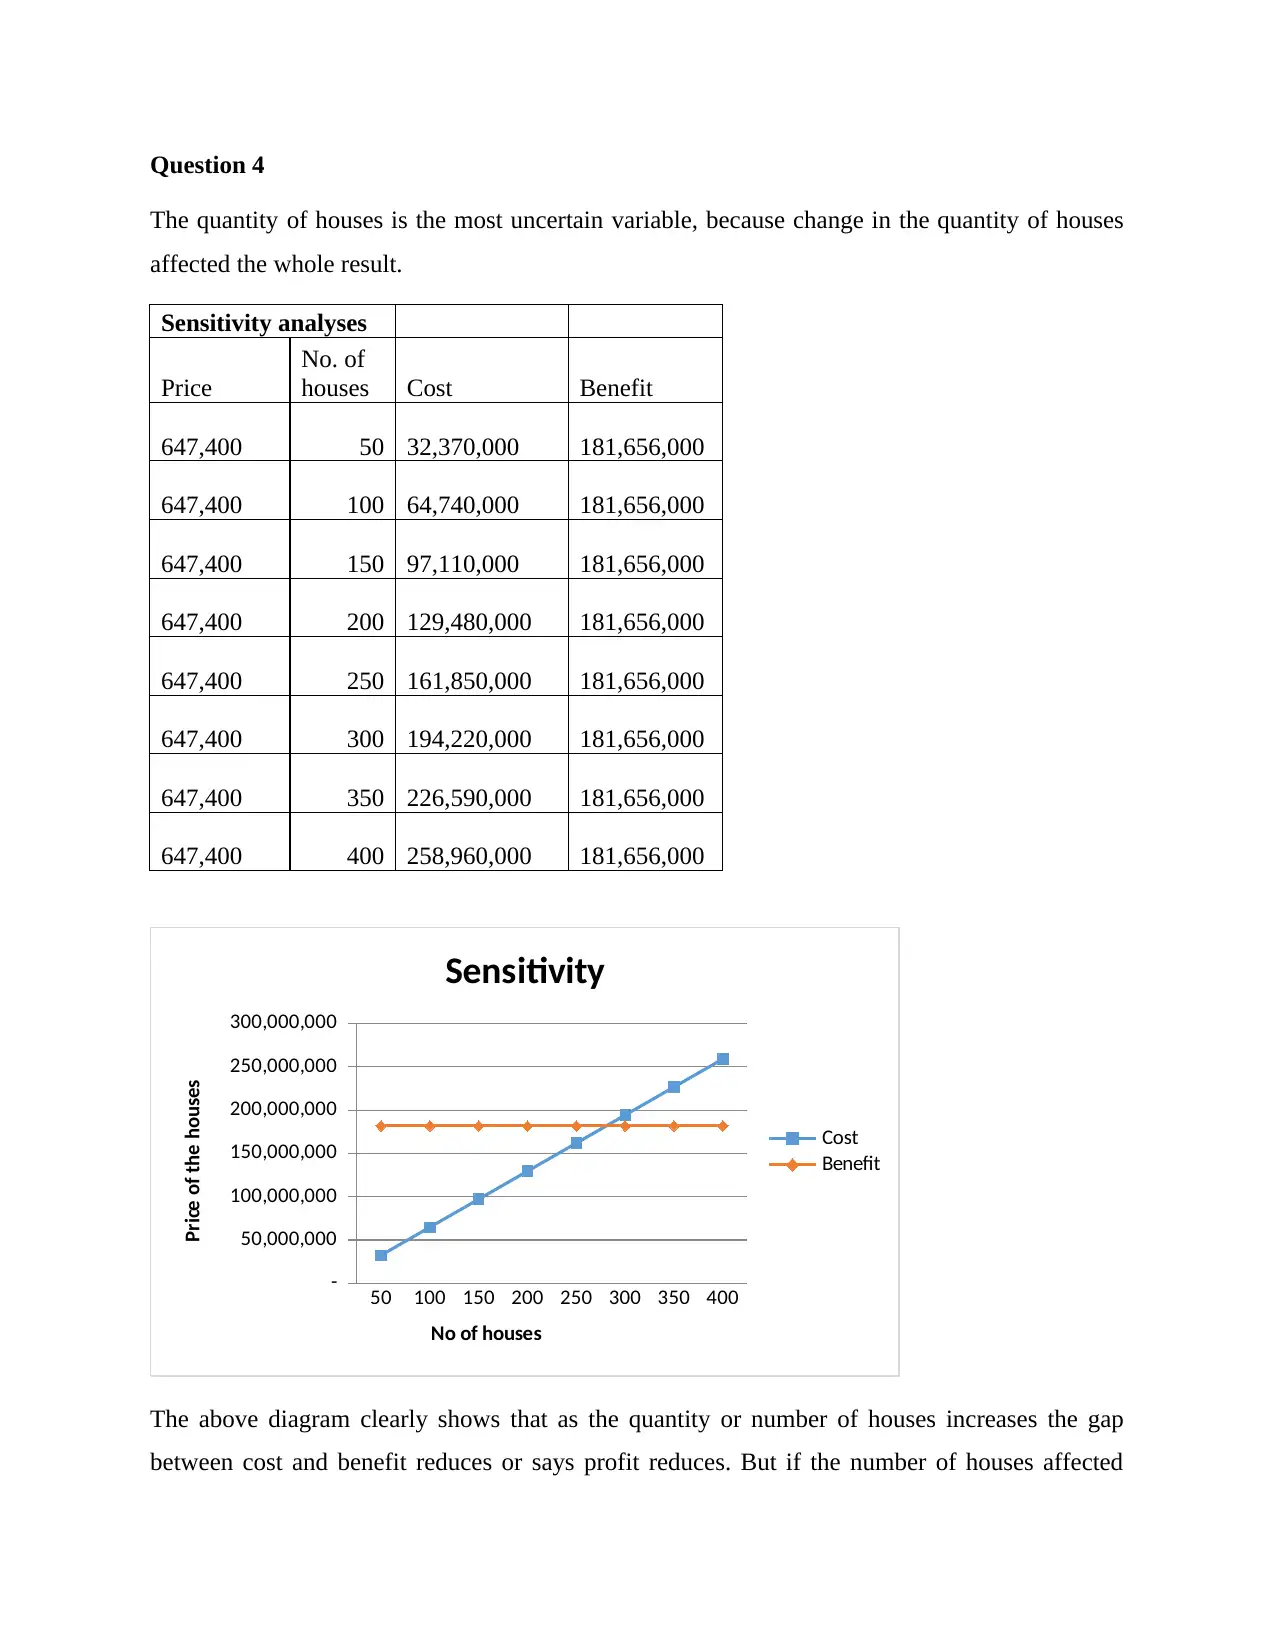
This assignment presents a comprehensive benefit-cost analysis (BCA) comparing two options for a proposed new road project, a dual-lane bypass around a town center. The analysis evaluates costs, including construction, labor, and maintenance, against benefits such as time savings for commuters, accident reduction, and operating cost reductions. The assessment utilizes a social discount rate of 7% over a 30-year lifespan. The assignment calculates Net Present Value (NPV) and Benefit-Cost Ratio (BCR) for each option, with Option 1 showing a negative NPV and a BCR of 0.29, while the provided information on Option 2 is less detailed, but the analysis concludes with a recommendation for Option 1, with a discussion on the impact of house prices on the cost and benefit, and a sensitivity analysis on the quantity of houses. The analysis highlights the limitations of the study, particularly the exclusion of social factors and health impacts, emphasizing the need for a broader perspective beyond monetary benefits. The conclusion indicates that a lower number of houses is preferable to the project's cost and benefit.
Document Page
BENEFIT COST ANALYSIS
tabler-icon-diamond-filled.svg

Paraphrase This Document

Need a fresh take? Get an instant paraphrase of this document with our AI Paraphraser
Document Page
Decision between option 1 and 2
Zone
Value
Zone
Average
time (hrs)
Average
distance (km)
Average no of
visits lost (per year Zonal Value
A
$
0.75 40 300,000
$
17,085,000
B
$
1.50 100 100,000
$
12,550,000
C
$
2.50 200 25,000
$
5,712,500
Total
$
35,347,500
Option 1 (Values in $ millions)
Cost
Yea
r
Construction
cost
Labor
cost Zonal cost
Purch &
plan
Maintenanc
e costs
Resurfacin
g
Total
initial
cost
1 20 10 35.35 20.3
$
85.65
2 55 16.5 35.35
$
106.85
3 55 23 35.35
$
113.35
4 35.35 0.08
$
35.43
5 35.35 0.08
$
35.43
6 35.35 0.08
$
35.43
7 35.35 0.08 1
$
36.43
8 35.35 0.08
$
35.43
9 35.35 0.08
$
35.43
10 35.35 0.08
$
35.43
11 0.08 $
Document Page
35.35 35.43
12 35.35 0.08
$
35.43
13 35.35 0.08
$
35.43
14 35.35 0.08 1
$
36.43
15 35.35 0.08
$
35.43
16 35.35 0.08
$
35.43
17 35.35 0.08
$
35.43
18 35.35 0.08
$
35.43
19 35.35 0.08
$
35.43
20 35.35 0.08
$
35.43
21 35.35 0.08 1
$
36.43
22 35.35 0.08
$
35.43
23 35.35 0.08
$
35.43
24 35.35 0.08
$
35.43
25 35.35 0.08
$
35.43
26 35.35 0.08
$
35.43
27 35.35 0.08
$
35.43
28 35.35 0.08 1
$
36.43
29 35.35 0.08
$
35.43
30 35.35 0.08
$
35.43
Total initial cost
$
1,266.39
Time savings
Vehicle Type
Delay cost
($/hour/vehicle)
Time
savings
Total
saving
Document Page
(hrs)
Private cars and motorcycles 32 20000 640000
Business cars 78 10000 780000
Light commercial vehicles 49 12000 588000
Buses 185 1200 222000
Trucks 63 20000 1260000
Annual saving
$
3,490,000
Accident Reduction
Accidents
Cost per
accident Reduction
Total
saving
Fatal accident
$
7,563,434 2
$15,126,86
8
Serious injury
$
476,777 8
$
3,814,216
Slight injury
$
75,391 65
$
4,900,415
Damage
$
9,743 200
$
1,948,600
Annual saving
$25,790,09
9
Total yearly saving = Travel time + Accident +
Operating cost
$ 32,280,099
Residual value = $45 Million
Yea
r
Total
savings DF@7% DCF
1
2
3
4
$
32.28 0.93
$
24.63
5
$
32.28 0.87
$
23.02
6
$
32.28 0.82
$
21.51
7 $ $
tabler-icon-diamond-filled.svg

Paraphrase This Document

Need a fresh take? Get an instant paraphrase of this document with our AI Paraphraser
Document Page
32.28 0.76 20.10
8
$
32.28 0.71
$
18.79
9
$
32.28 0.67
$
17.56
10
$
32.28 0.62
$
16.41
11
$
32.28 0.58
$
15.34
12
$
32.28 0.54
$
14.33
13
$
32.28 0.51
$
13.40
14
$
32.28 0.48
$
12.52
15
$
32.28 0.44
$
11.70
16
$
32.28 0.41
$
10.93
17
$
32.28 0.39
$
10.22
18
$
32.28 0.36
$
9.55
19
$
32.28 0.34
$
8.93
20
$
32.28 0.32
$
8.34
21
$
32.28 0.30
$
7.80
22
$
32.28 0.28
$
7.29
23
$
32.28 0.26
$
6.81
24
$
32.28 0.24
$
6.36
25
$
32.28 0.23
$
5.95
26
$
32.28 0.21
$
5.56
27
$
32.28 0.20
$
5.19
28
$
32.28 0.18
$
5.95
29
$
32.28 0.17
$
5.56
30 $ $
Document Page
32.28 0.16 5.19
30
$
45.00
$
45.00
Total DCF
$
363.92
Less: Total initial cost
$
1,266.39
NPV
$
(902.47)
BCR 0.29
Option 2
Option 1 (Values in $ millions)
Cost
Yea
r
Construciton
cost
Labor
cost Zonal cost
Purch &
plan
Maintenanc
e costs
Resurfacin
g
Total
initial
cost
1 20 10 35.35 20.3
$
85.65
2 55 16.5 35.35
$
106.85
3 55 23 35.35
$
113.35
4 35.35 0.08
$
35.43
5 35.35 0.08
$
35.43
6 35.35 0.08
$
35.43
7 35.35 0.08 1
$
36.43
8 35.35 0.08
$
35.43
9 35.35 0.08
$
35.43
10 35.35 0.08
$
35.43
11 35.35 0.08
$
35.43
12 35.35 0.08
$
35.43
13 35.35 0.08
$
35.43
Document Page
14 35.35 0.08 1
$
36.43
15 35.35 0.08
$
35.43
16 35.35 0.08
$
35.43
17 35.35 0.08
$
35.43
18 35.35 0.08
$
35.43
19 35.35 0.08
$
35.43
20 35.35 0.08
$
35.43
21 35.35 0.08 1
$
36.43
22 35.35 0.08
$
35.43
23 35.35 0.08
$
35.43
24 35.35 0.08
$
35.43
25 35.35 0.08
$
35.43
26 35.35 0.08
$
35.43
27 35.35 0.08
$
35.43
28 35.35 0.08 1
$
36.43
29 35.35 0.08
$
35.43
30 35.35 0.08
$
35.43
Total initial cost
$
1,266.39
Yea
r
Total
savings DF@7% DCF
1
2
3
4
$
32.28 0.93
$
24.63
tabler-icon-diamond-filled.svg

Paraphrase This Document

Need a fresh take? Get an instant paraphrase of this document with our AI Paraphraser
Document Page
5
$
32.28 0.87
$
23.02
6
$
32.28 0.82
$
21.51
7
$
32.28 0.76
$
20.10
8
$
32.28 0.71
$
18.79
9
$
32.28 0.67
$
17.56
10
$
32.28 0.62
$
16.41
11
$
32.28 0.58
$
15.34
12
$
32.28 0.54
$
14.33
13
$
32.28 0.51
$
13.40
14
$
32.28 0.48
$
12.52
15
$
32.28 0.44
$
11.70
16
$
32.28 0.41
$
10.93
17
$
32.28 0.39
$
10.22
18
$
32.28 0.36
$
9.55
19
$
32.28 0.34
$
8.93
20
$
32.28 0.32
$
8.34
21
$
32.28 0.30
$
7.80
22
$
32.28 0.28
$
7.29
23
$
32.28 0.26
$
6.81
24
$
32.28 0.24
$
6.36
25
$
32.28 0.23
$
5.95
26
$
32.28 0.21
$
5.56
27
$
32.28 0.20
$
5.19
Document Page
28
$
32.28 0.18
$
5.95
29
$
32.28 0.17
$
5.56
30
$
32.28 0.16
$
5.19
30
$
45.00
$
45.00
Total DCF
$
363.92
Less: Total initial cost
$
1,266.39
NPV
$
(902.47)
BCR 0.29
Question 1
Option 1 Option 2
NPV - 902.47 Million - 1,484.45 Million
BCR 0.29 0.19
Question2
Option 1 should be chosen because this option has higher NPV and BCR value compare to
Option 2.
Question 3
Area & Option
Mean house
price ($)
Number
of houses
Change in
noise level
(db)
%
change New Price Benefit Cost
A: Option 1 and 2 300,000 600 -4 +.92 302,760 181,656,000
B: Option 1 650,000 120 8 -0.4 (647,400) (77,688,000)
B: Option 2 650,000 50 8 -0.4 (647,400) (32,370,000)
Based on above analyses, it was found that option 2 is economic compare to option 1. As in
option 2 the overall cost is lesser than option 1. The BCR value of option 2 is 5.611, while BCR
of option 1 is only 2.34. Hence, this evidence is enough to show that option 2 is better than
option 1.
Document Page
Question 4
The quantity of houses is the most uncertain variable, because change in the quantity of houses
affected the whole result.
Sensitivity analyses
Price
No. of
houses Cost Benefit
647,400 50 32,370,000 181,656,000
647,400 100 64,740,000 181,656,000
647,400 150 97,110,000 181,656,000
647,400 200 129,480,000 181,656,000
647,400 250 161,850,000 181,656,000
647,400 300 194,220,000 181,656,000
647,400 350 226,590,000 181,656,000
647,400 400 258,960,000 181,656,000
50 100 150 200 250 300 350 400
-
50,000,000
100,000,000
150,000,000
200,000,000
250,000,000
300,000,000
Sensitivity
Cost
Benefit
No of houses
Price of the houses
The above diagram clearly shows that as the quantity or number of houses increases the gap
between cost and benefit reduces or says profit reduces. But if the number of houses affected
tabler-icon-diamond-filled.svg

Paraphrase This Document

Need a fresh take? Get an instant paraphrase of this document with our AI Paraphraser
Document Page
cross the level of 300, than cost will exceed benefit. Therefore, the decision should be based on
quantity of houses; less number of houses should be accepted.
Question 5
Limitations
The major limitation in these analyses is not including of social factor. Sometimes social needs
has to be prioritized other than major cost and monetary benefits. In the above example price of
the houses has considered but impact on persons health has ignored. Also cost of hospitalization
also ignored in the above analyses which is the major limitation. It was required to consider
number of people living in that area and strength of children leaving in particular area should be
given major concern.
chevron_up_icon
1 out of 11
circle_padding
hide_on_mobile
zoom_out_icon
[object Object]