BEO1105 Assignment: Market Equilibrium, Elasticity, and Firm Strategy

Verified

Added on  2024/04/25

|16
|2042
|205
Homework Assignment
AI Summary
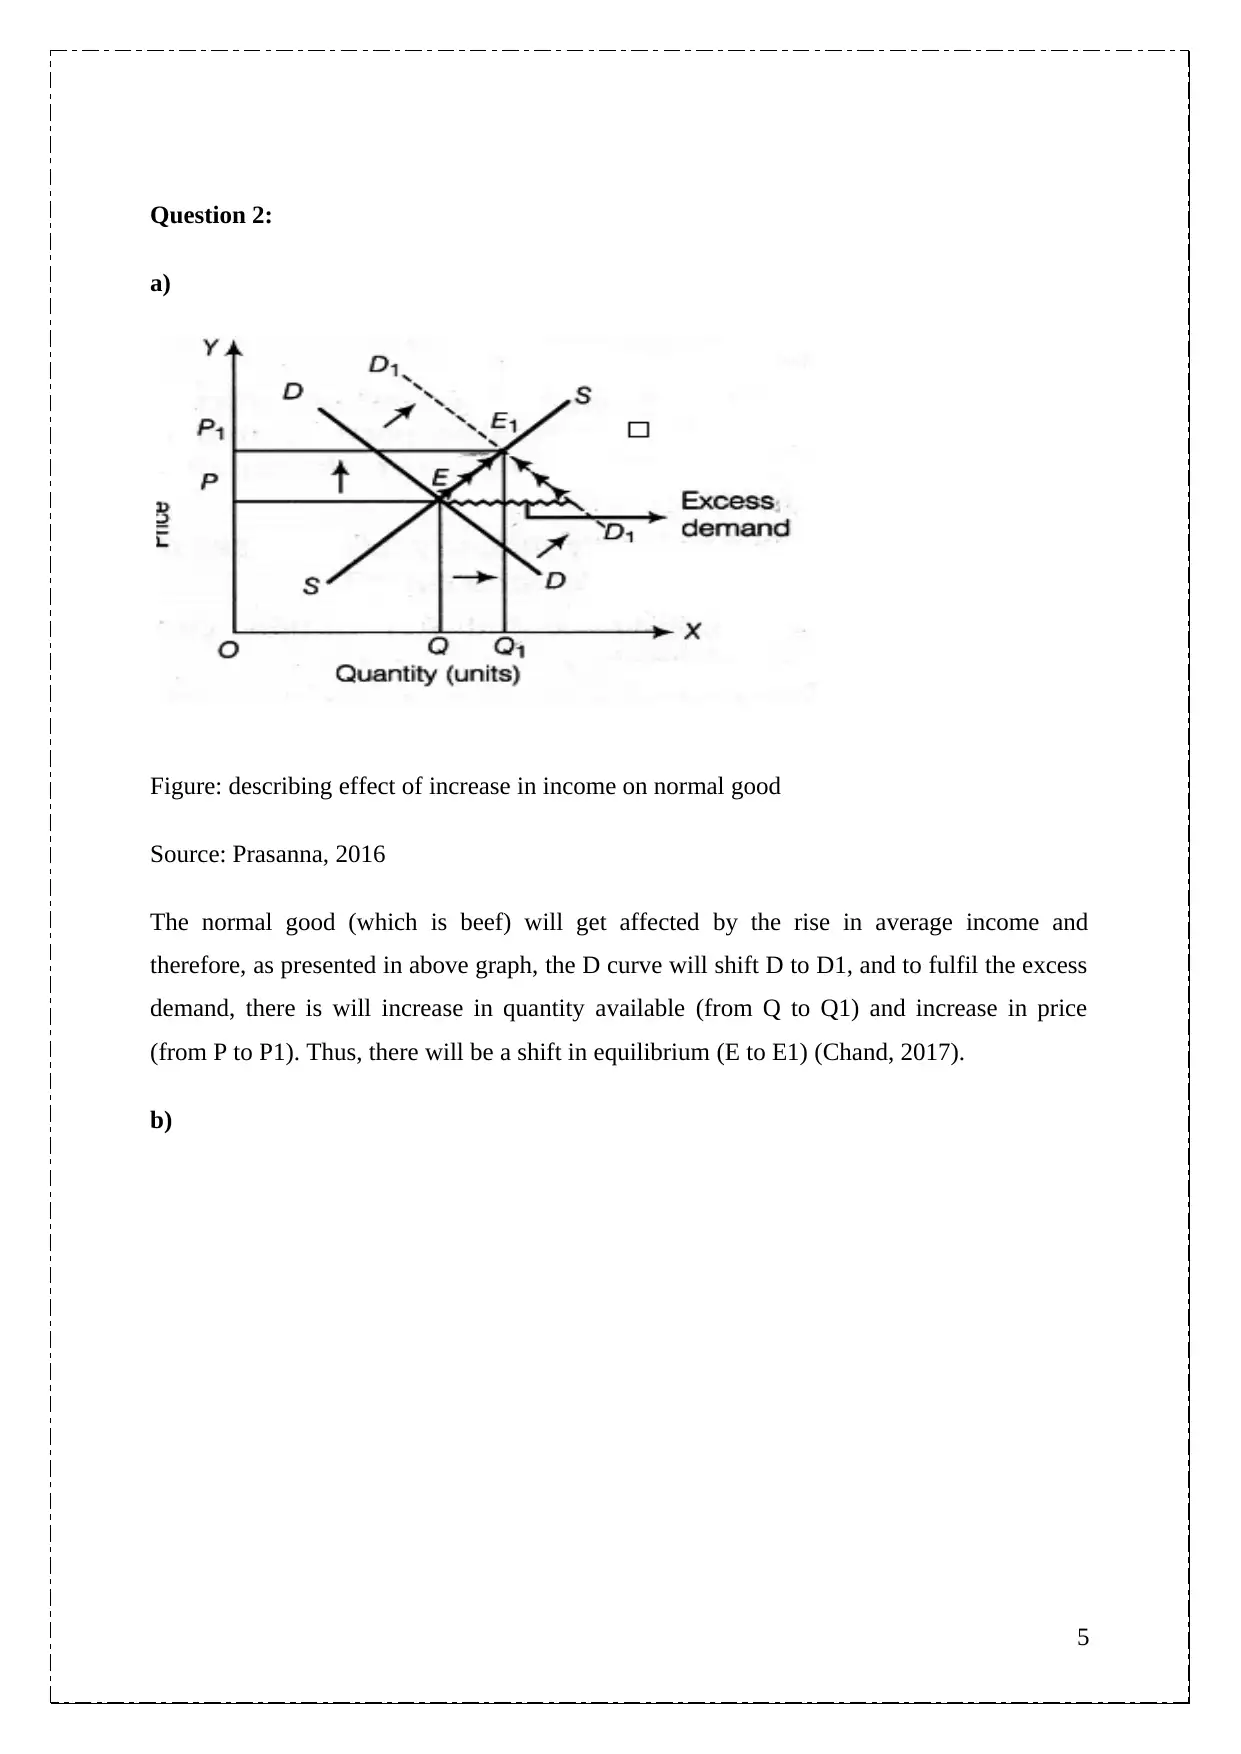
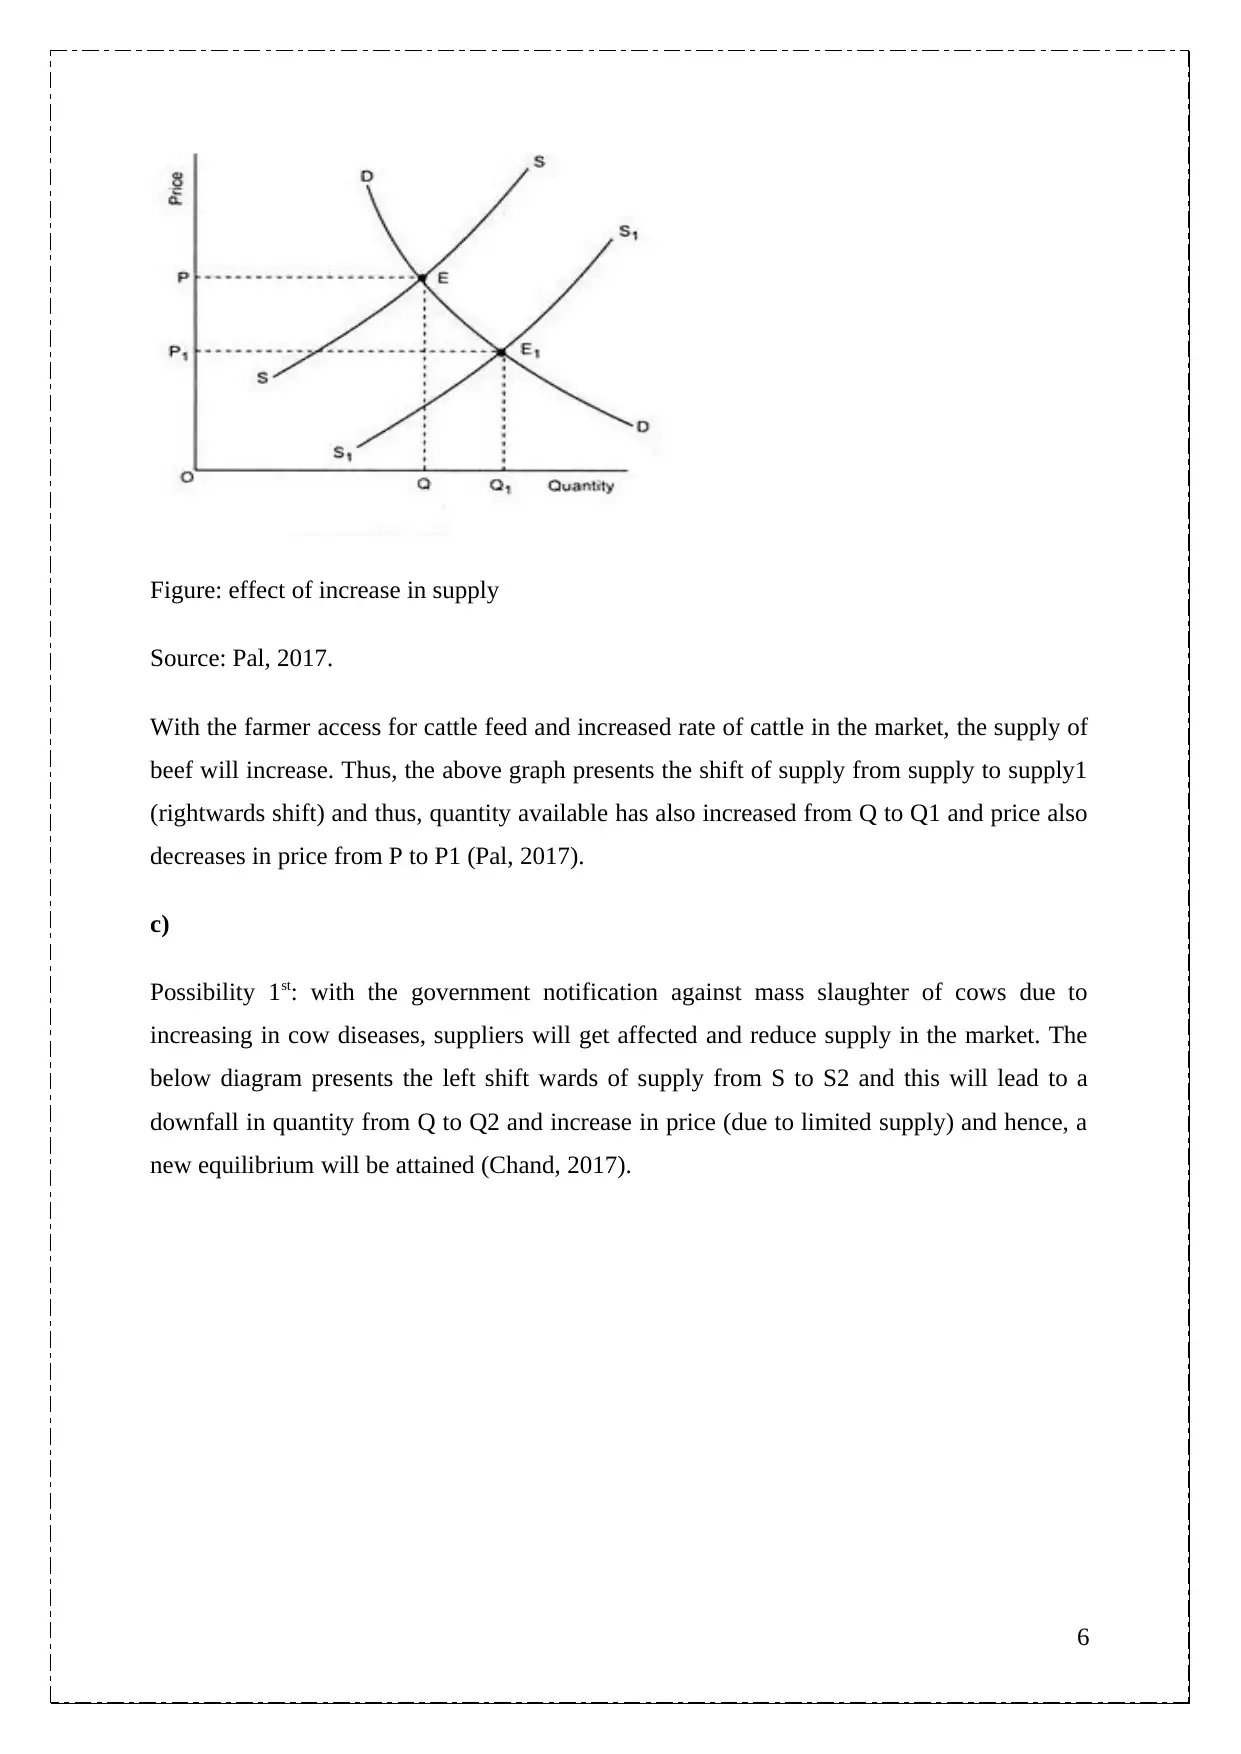
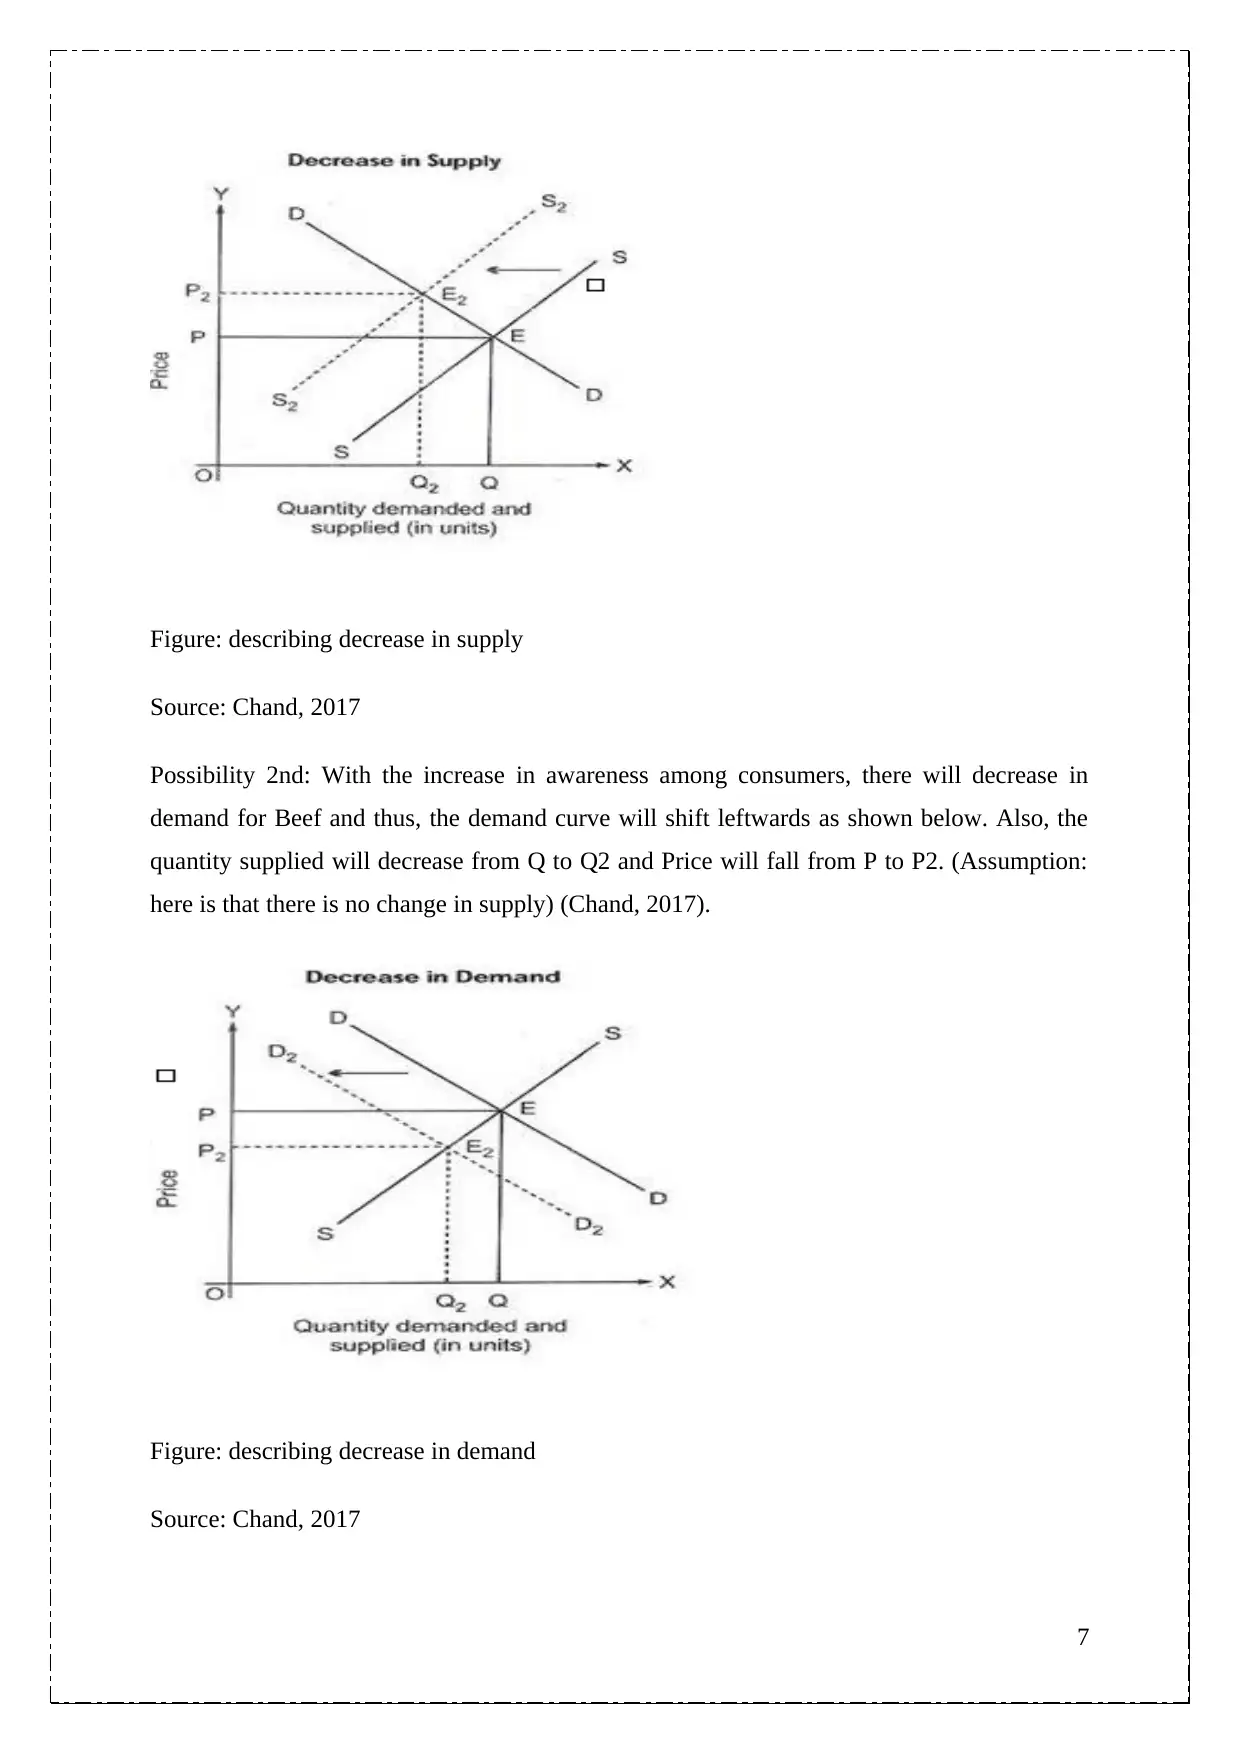
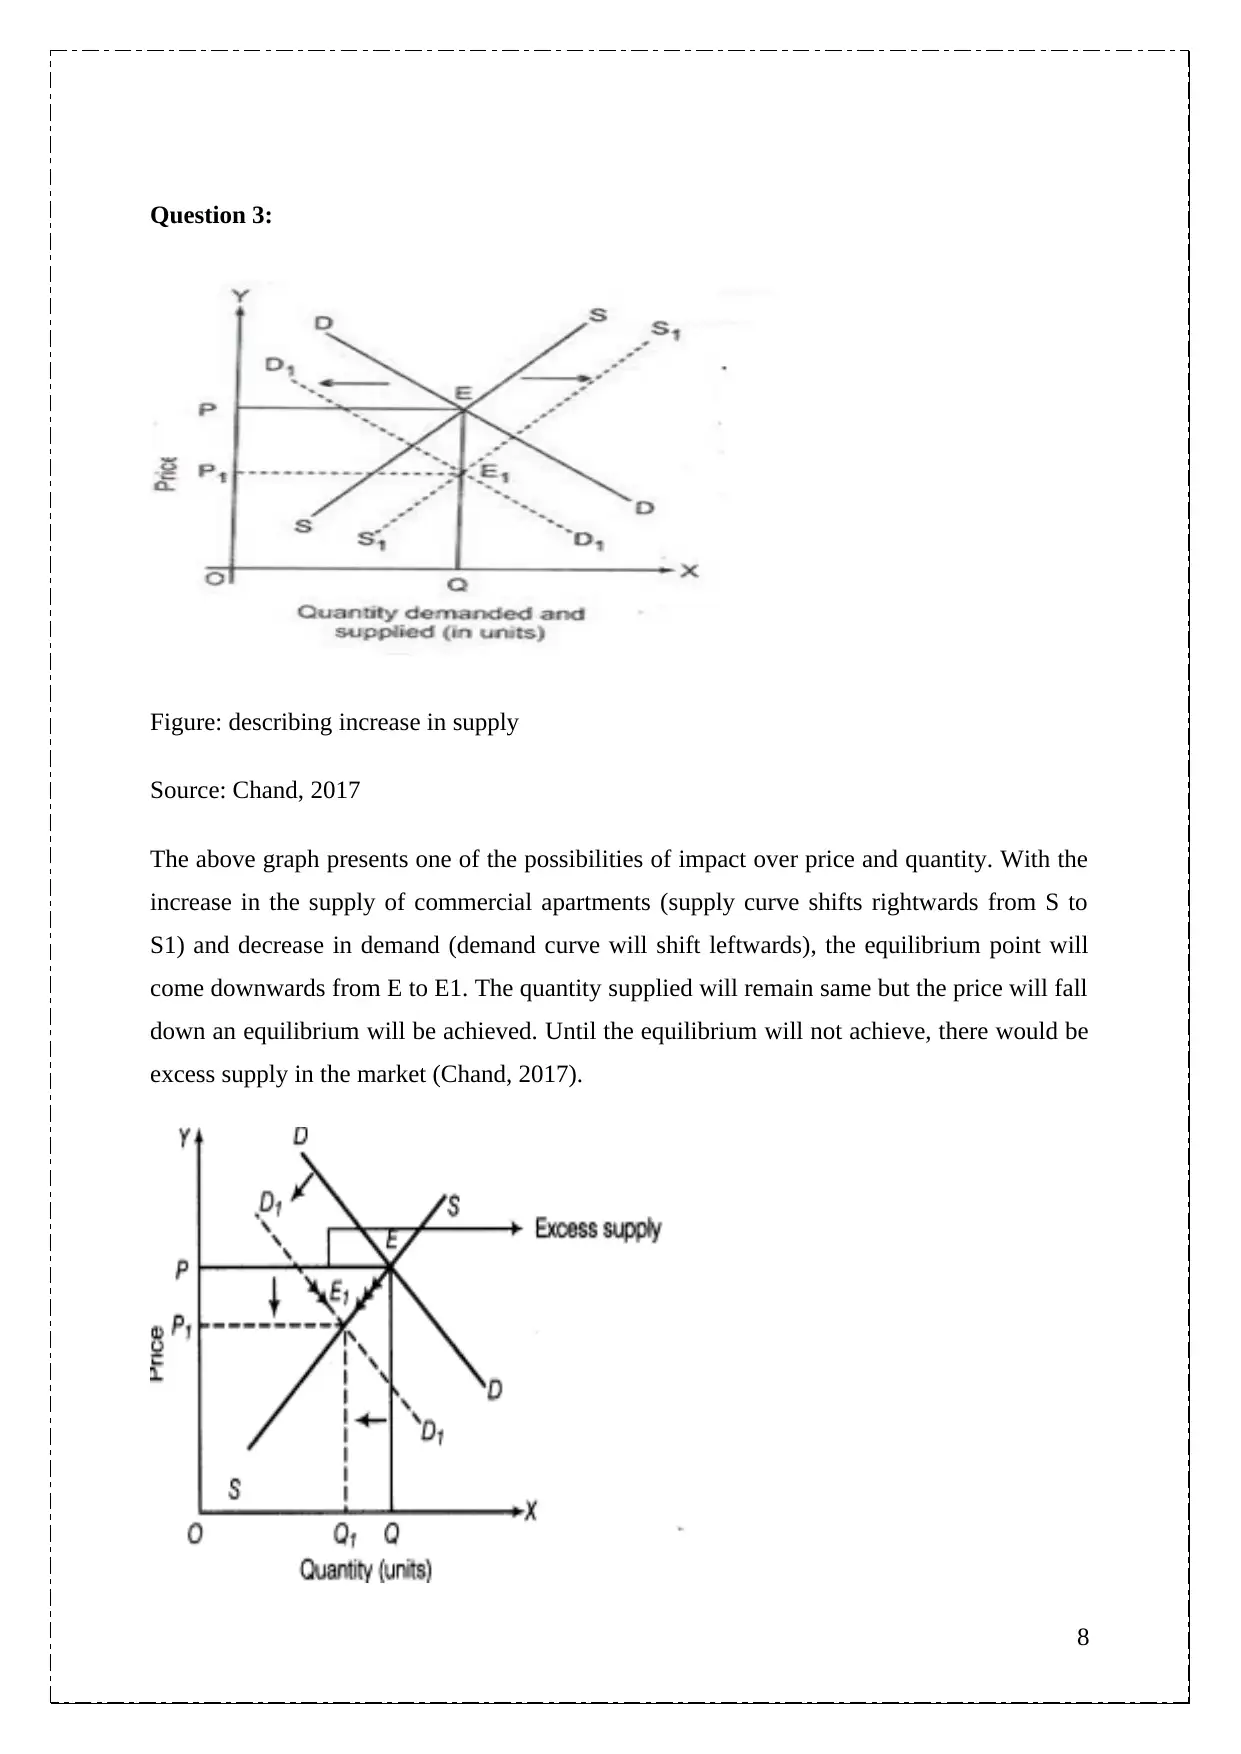
This BEO1105 assignment provides detailed solutions to questions related to market equilibrium, elasticity, and firm strategies. It analyzes the impact of shifts in supply and demand curves on market prices and quantities, considering factors like changes in income, input costs, and consumer preferences. The assignment also explores the concept of price elasticity of demand and its implications for businesses. Furthermore, it differentiates between sales maximization and profit maximization strategies, providing numerical examples and graphical representations to illustrate these concepts. The document includes relevant graphs and references to support the analysis. Desklib offers a wide range of similar assignments and study resources for students.
Document Page
BEO1105 Assignment
1
tabler-icon-diamond-filled.svg

Paraphrase This Document

Need a fresh take? Get an instant paraphrase of this document with our AI Paraphraser
Document Page
Contents
Question 1:.................................................................................................................................3
Question 2:.................................................................................................................................5
Question 3:.................................................................................................................................8
Question 4:...............................................................................................................................10
Question 5:...............................................................................................................................12
References................................................................................................................................15
2
Document Page
Question 1:
a) The below diagram clearly presents the picture of the first option of efficient cars. Since,
with the lack of petrol, there is decrease in supply (of petrol), S (supply curve) shifted
leftwards to S2, the shift in supply curve lead to change in equilibrium point from E to E2
because there is fall in quantity available in the market (from Q to Q2) and resulted in
increase in price (Chand, 2017).
Figure1: describing decrease in supply of petrol and effect over quantity and price of petrol
Source: Chand, 2017
b)
3
Document Page
Figure 2: depicting the equilibrium process of substitute good (liquid gas) due to decrease in
supply of petrol (main product)
Source: Chand, 2017
The above graph depicts the shift of demand curve of liquid gas towards right due to a
decrease in the supply of the main product (petrol). Though there is no increase in the price
of petrol there is a shortage of supply of petrol and people will prefer to purchase liquid gas
for their cars. Thus, the demand will move from D to D1 and the quantity supplied will
increase from Q to Q1 and eventually the price will also increase from P to P1 of liquid gas
(substitute good) (Chand, 2017).
4
tabler-icon-diamond-filled.svg

Paraphrase This Document

Need a fresh take? Get an instant paraphrase of this document with our AI Paraphraser
Document Page
Question 2:
a)
Figure: describing effect of increase in income on normal good
Source: Prasanna, 2016
The normal good (which is beef) will get affected by the rise in average income and
therefore, as presented in above graph, the D curve will shift D to D1, and to fulfil the excess
demand, there is will increase in quantity available (from Q to Q1) and increase in price
(from P to P1). Thus, there will be a shift in equilibrium (E to E1) (Chand, 2017).
b)
5
Document Page
Figure: effect of increase in supply
Source: Pal, 2017.
With the farmer access for cattle feed and increased rate of cattle in the market, the supply of
beef will increase. Thus, the above graph presents the shift of supply from supply to supply1
(rightwards shift) and thus, quantity available has also increased from Q to Q1 and price also
decreases in price from P to P1 (Pal, 2017).
c)
Possibility 1st: with the government notification against mass slaughter of cows due to
increasing in cow diseases, suppliers will get affected and reduce supply in the market. The
below diagram presents the left shift wards of supply from S to S2 and this will lead to a
downfall in quantity from Q to Q2 and increase in price (due to limited supply) and hence, a
new equilibrium will be attained (Chand, 2017).
6
Document Page
Figure: describing decrease in supply
Source: Chand, 2017
Possibility 2nd: With the increase in awareness among consumers, there will decrease in
demand for Beef and thus, the demand curve will shift leftwards as shown below. Also, the
quantity supplied will decrease from Q to Q2 and Price will fall from P to P2. (Assumption:
here is that there is no change in supply) (Chand, 2017).
Figure: describing decrease in demand
Source: Chand, 2017
7
tabler-icon-diamond-filled.svg

Paraphrase This Document

Need a fresh take? Get an instant paraphrase of this document with our AI Paraphraser
Document Page
Question 3:
Figure: describing increase in supply
Source: Chand, 2017
The above graph presents one of the possibilities of impact over price and quantity. With the
increase in the supply of commercial apartments (supply curve shifts rightwards from S to
S1) and decrease in demand (demand curve will shift leftwards), the equilibrium point will
come downwards from E to E1. The quantity supplied will remain same but the price will fall
down an equilibrium will be achieved. Until the equilibrium will not achieve, there would be
excess supply in the market (Chand, 2017).
8
Document Page
Figure: describing excess supply
Source: Sastry, 2015
The above graph shows the second probability of demand and supply curve. With the
provision of a supply of commercial apartments on S curve, there is a decrease in demand
(leftward shift of demand curve from D to D1), this would eventually reduce the quantity
available from Q to Q1 and decrease in prices from P to P1 (Sastry, 2015).
9
Document Page
Question 4:
a) Price elasticity of demand: It measures the response in quantity demanded due to
change in value or price of a product (Thimmapuram, & Kim, 2013).
Particulars Old New
Price $3.50 $4.25
Quantity demanded 25 units 15 units
14 16 18 20 22 24 26
0
1
2
3
4
5
Demand Curve
Demand Curve
Quantity demanded
P
r
i
c
e
Change in quantity demanded:
= (15-25)/ 25 *100
= -40%
Change in price:
(4.25-3.5)/ 3.5*100
= 21.42%
=-40%/ 21.42%
10
tabler-icon-diamond-filled.svg

Paraphrase This Document

Need a fresh take? Get an instant paraphrase of this document with our AI Paraphraser
Document Page
=-1.86
In the above scenario, it can be understood that the product is elastic as 21.42% change in
prices brought 40% change in the quantity demanded.
b)
Elasticity is a phenomenon which describes the sensitivity of a product’s demand in
consideration to other economic factors such as price, income, substitute etc. For a business,
it is important to learn the elasticity value as it presents the effect which a businessman
products can occur due to other factors (Thimmapuram, & Kim, 2013).
For instance: In terms of price factor, a product is said to be highly elastic, if minor changes
in price lead to great change in the quantity demanded and oppositely, it is inelastic when a
major large change in price leads to a minor change in quantity demanded.
Thus, with the change in external economic variables, a businessman can forecast regarding
the futuristic effect over its product and can also vary its production and manufacturing
policies and can sustain its profits and organization (Thimmapuram, & Kim, 2013).
11
Document Page
Question 5:
Sales maximizing strategy is one where a businessman is selling maximum products which it
can be produced and that too without incurring any losses. Numerically, it can be presented
as below:
Total Cost= Total Revenue or Average Cost= Average Revenue
For instance:
No of
output
TC AC TR AR
1 10 10 13 13
2 18 9 25 12.5
3 25 8.33333
3
30 10
4 29 7.25 33 8.25
5 37 7.4 41 8.2
6 47 7.83 46.98 7.83
In the above example, it is demonstrated that at the sixth unit, an organization has AC=AR,
which means this is the sales maximisation point at which without making losses an
organization is able to sales maximum unit and also earning the same amount which it cost to
manufacture. Thus, it is the sales maximisation point (A2 Economics & RS with Komilla,
2010). The following graph represents the curve:
Figure: describing sales maximisation
12
chevron_up_icon
1 out of 16
circle_padding
hide_on_mobile
zoom_out_icon
[object Object]