BEO6600 Business Economics T3 2018: Market Analysis and Fiscal Impact
VerifiedAdded on 2023/04/26
|18
|4064
|316
Report
AI Summary
This report delves into various aspects of business economics, starting with an analysis of market boundaries and structures, using Aldi as a case study, and critically evaluating claims related to price and income elasticity of demand. It further examines the impact of externalities, specifically the effect of drought on agricultural markets and the consequences of government subsidies to both farmers and consumers. The report also analyzes the Australian government's budget and fiscal changes, exploring their implications on the economy. The document provides demand and supply graph for better understanding the concepts. This resource is available on Desklib, a platform offering a wide array of study tools and solved assignments for students.
Running head: BUSINESS ECONOMICS
Business Economics
Name of the Student
Name of the University
Course ID
Business Economics
Name of the Student
Name of the University
Course ID
Paraphrase This Document
Need a fresh take? Get an instant paraphrase of this document with our AI Paraphraser
1BUSINESS ECONOMICS
Table of Contents
Part 1: Market and Elasticities...................................................................................................2
Question 1.1 Market boundary and market structure of Aldi................................................2
Question 1.2 Critical evaluation of claims of the article and elasticity.................................2
Part 2: Market and Externalities.................................................................................................4
Question 2.1: Impact of drought on market outcome............................................................4
Question 2.2: Effect of government subsidy given to farmers...............................................6
Question 2.2 Effect of government subsidy given to consumers...........................................8
Part 3: Australia government budget and fiscal change.............................................................9
Question 3.1...........................................................................................................................9
Question 3.2.........................................................................................................................11
References................................................................................................................................14
2BUSINESS ECONOMICS
Part 1: Market and Elasticities
Question 1.1 Market boundary and market structure of Aldi
The German based company Aldi is currently operating in Australian supermarket
industry which is highly concentrated and fiercely competitive. The fast growth of Aldi since
2001 in Australia has a considerable effect on supermarket industry of Australia. The German
based competitors Aldi has faced intense competition from two existing giants Woolworths
and Coles. The discount operator Aldi largely influences shopping trend of Australian. The
private label products have become increasingly popular among Australians. The strong
growth of Aldi has increased concentration within the industry in the last five years. Aldi
currently holds 8.9 percent market share in Australia (retailworldmagazine.com.au 2018).
However, given the current tendency of Australians to switch to online grocery shopping, the
company needs to reaffirm its own value credentials.
Question 1.2 Critical evaluation of claims of the article and elasticity
“The conventional wisdom that grocery spending is largely immune from the
economic cycle – because it falls into the basket of necessity rather than discretionary
spending – has been thrown into doubt”;
Price elasticity of demand refers to an economic measure representing a change in
quantity demanded following a certain percentage change in price. analysis of price elasticity
of demand is important to evaluate changes in revenue due to a change in price and
associated demand. Income elasticity of demand measure changes in demand following a
change in income (Frank and Cartwright 2013). Income elasticity helps to determine effect on
demand during fluctuation in income. Different phases of business cycle or economic cycle
are associated with a change in income and corresponding change in demand. Now nature of
income elasticity depends on the type of product. For necessary items, demand is generally
⊘ This is a preview!⊘
Do you want full access?
Subscribe today to unlock all pages.
Trusted by 1+ million students worldwide
3BUSINESS ECONOMICS
assumed to be income inelastic in nature, that is percentage change in demand is always less
than the corresponding percentage change in income. For luxury items, demand is income
elastic meaning small change in income can bring a large change in demand (Moulin 2014).
Demand for groceries that were generally fall in the category of necessary items were
previously assumed to be income inelastic. As demand adjusts by a relatively smaller
magnitude for a given change in income demand and hence revenue fluctuates relatively less
with business cycle fluctuation. As it falls in the category of necessity rather than
discretionary spending, expenditure on groceries immune from changes in economic cycle.
The traditional believe however now has been highly contested. With increase in cheaper
alternative people now are showing tendency to switch their spending to these alternative.
With changes in life style people now have focused on cut back their spending on groceries to
finance other living costs (Baumol and Blinder 2015). The Deloitte report has found that in
response to an increase in living expense one in three Australians cut back their spending on
groceries by either buying fewer groceries or switching to private level brands. Nearly 12
percent of Australians now prefer to buy fewer groceries to finance additional living cost.
These evidences suggest that spending on groceries are no longer immune from business
cycle due to change in life style and preferences.
“Entertainment subscription services is another area that is moving from luxury to
essential”;
Income elasticity of demand depends on nature of a good that is whether the good is a
necessary or a luxury. As people cannot adjust their demand for necessities even when
income changes, demand is relatively income inelastic (Cowell 2018). In case of luxury or
discretionary spending, demand changes significantly with change in income. Earlier
smartphones or entertainment services were come under discretionary spending of people.
People then preferred to watch shows on television. Introduction of different online
Paraphrase This Document
Need a fresh take? Get an instant paraphrase of this document with our AI Paraphraser

4BUSINESS ECONOMICS
entertainment services now have attracted a large pool of customers. People now are
spending more and more to subscribe entertainment packages. Subscription to Netflix or
Spotify now has become an important part of household budget. People even ready to cut
down their spending on car, holidays, clothing or even groceries to finance subscription of
entertainment services. As documented in the Deloitte report, when people in Australia asked
regarding way to finance the extra living cost only 4 percent prefer to curtail their
subscription services as against 12 percent to lower luxury or discretionary spending and 12
percent to buy fewer groceries. This shows popularity of entertainment services among
people (McKenzie and Lee 2016). As people ready to cut back their spending on other
essential of luxury items to pay for entertainment service, this can now be considered as an
essential instead of luxury.
“The most resilient services were child care/education and housing…”
The most resilient services were child care/education and housing meaning that these
services face relatively lower elasticity of demand. These are services where people tend to
cut back their spending the least. Given a busy life schedule people couples in Australia tend
to increase their demand for child care service (Friedman 2017). As people cannot sacrifice
their jobs to take care of children of their own the demand for child care remains more or less
stable. Another necessary service is education. Because of a better future people tend to
increase demand for education services. People therefore tend to adjust their demand for
education less when income changes. Spending on housing is another important part of
household expenditure (Cowen and Tabarrok 2015). With the expectation of increase in
housing price people tend to adjust their demand of housing less with change in income. All
these indicate that demand for these services are relatively income inelastic in nature.
Part 2: Market and Externalities
5BUSINESS ECONOMICS
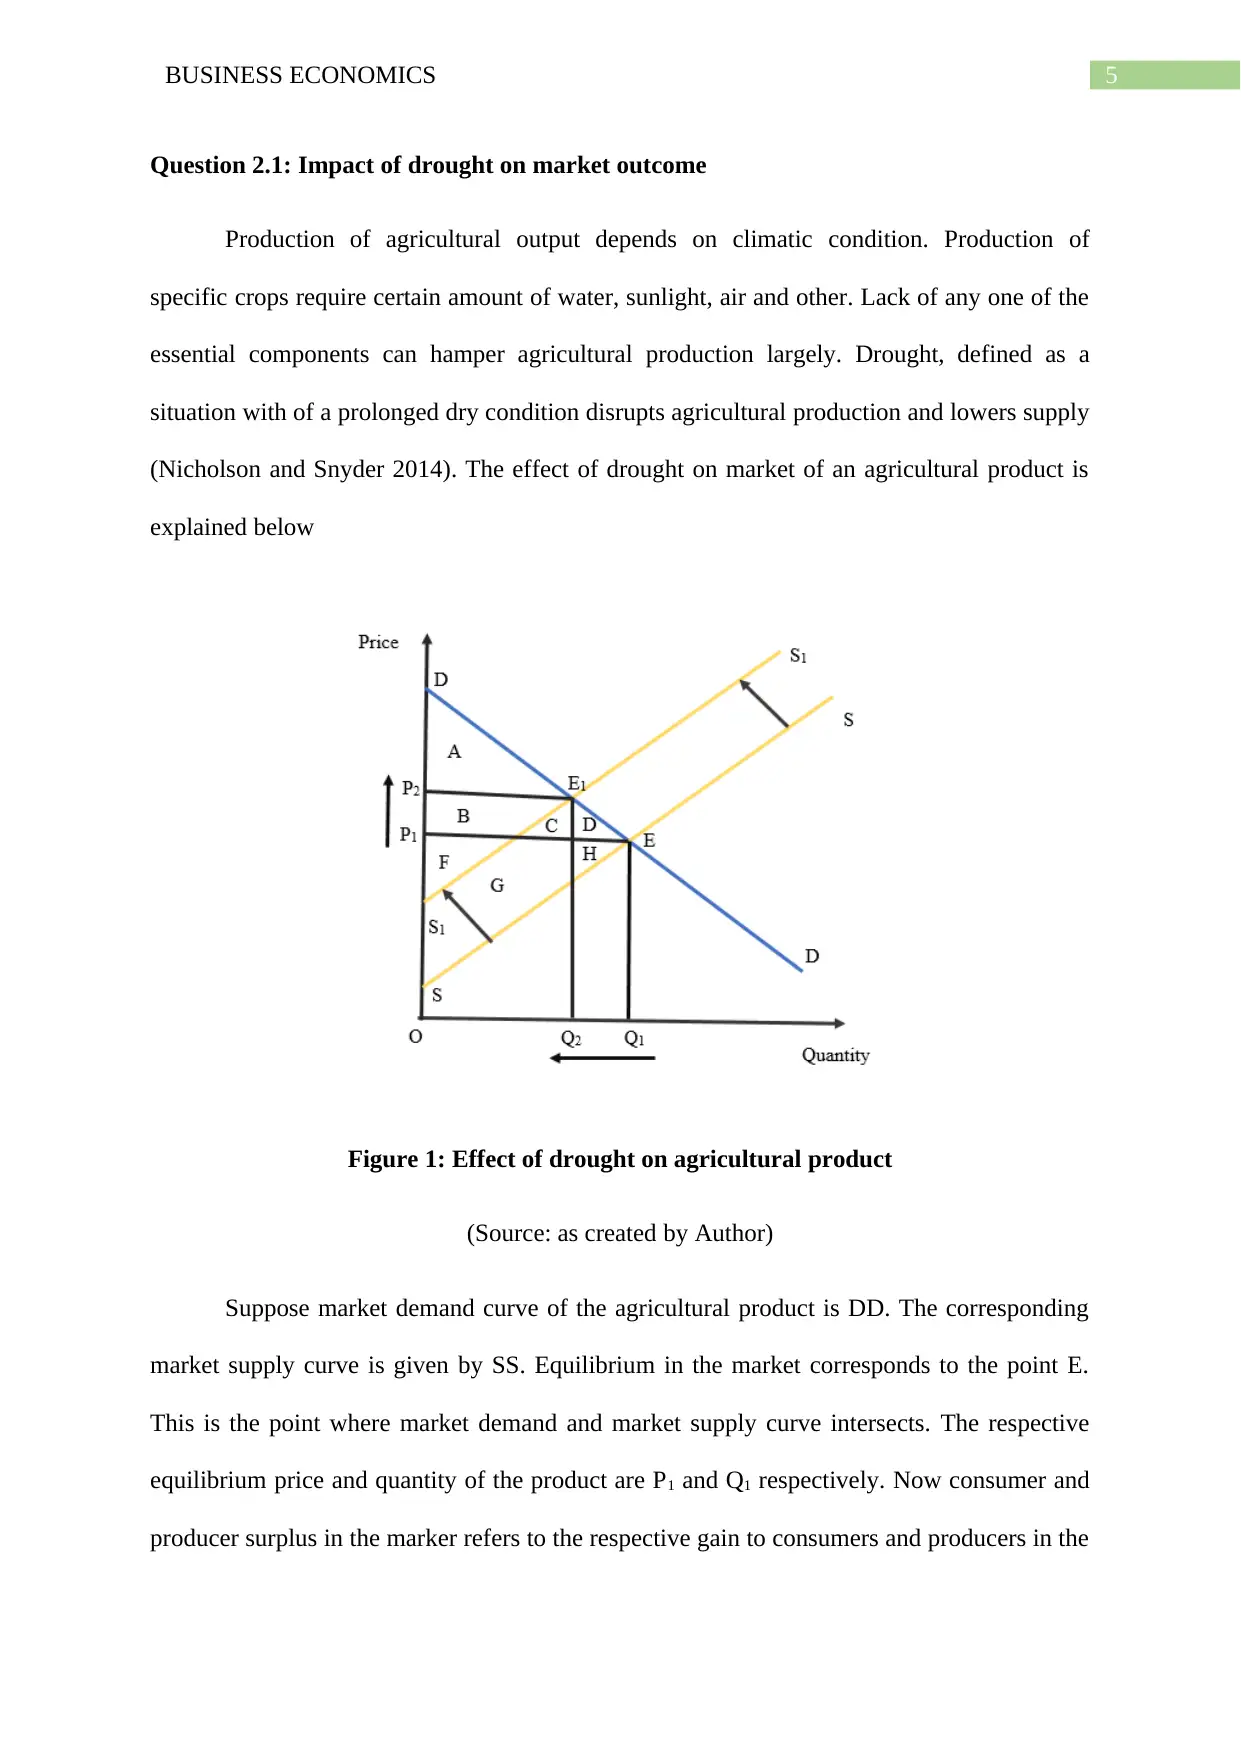
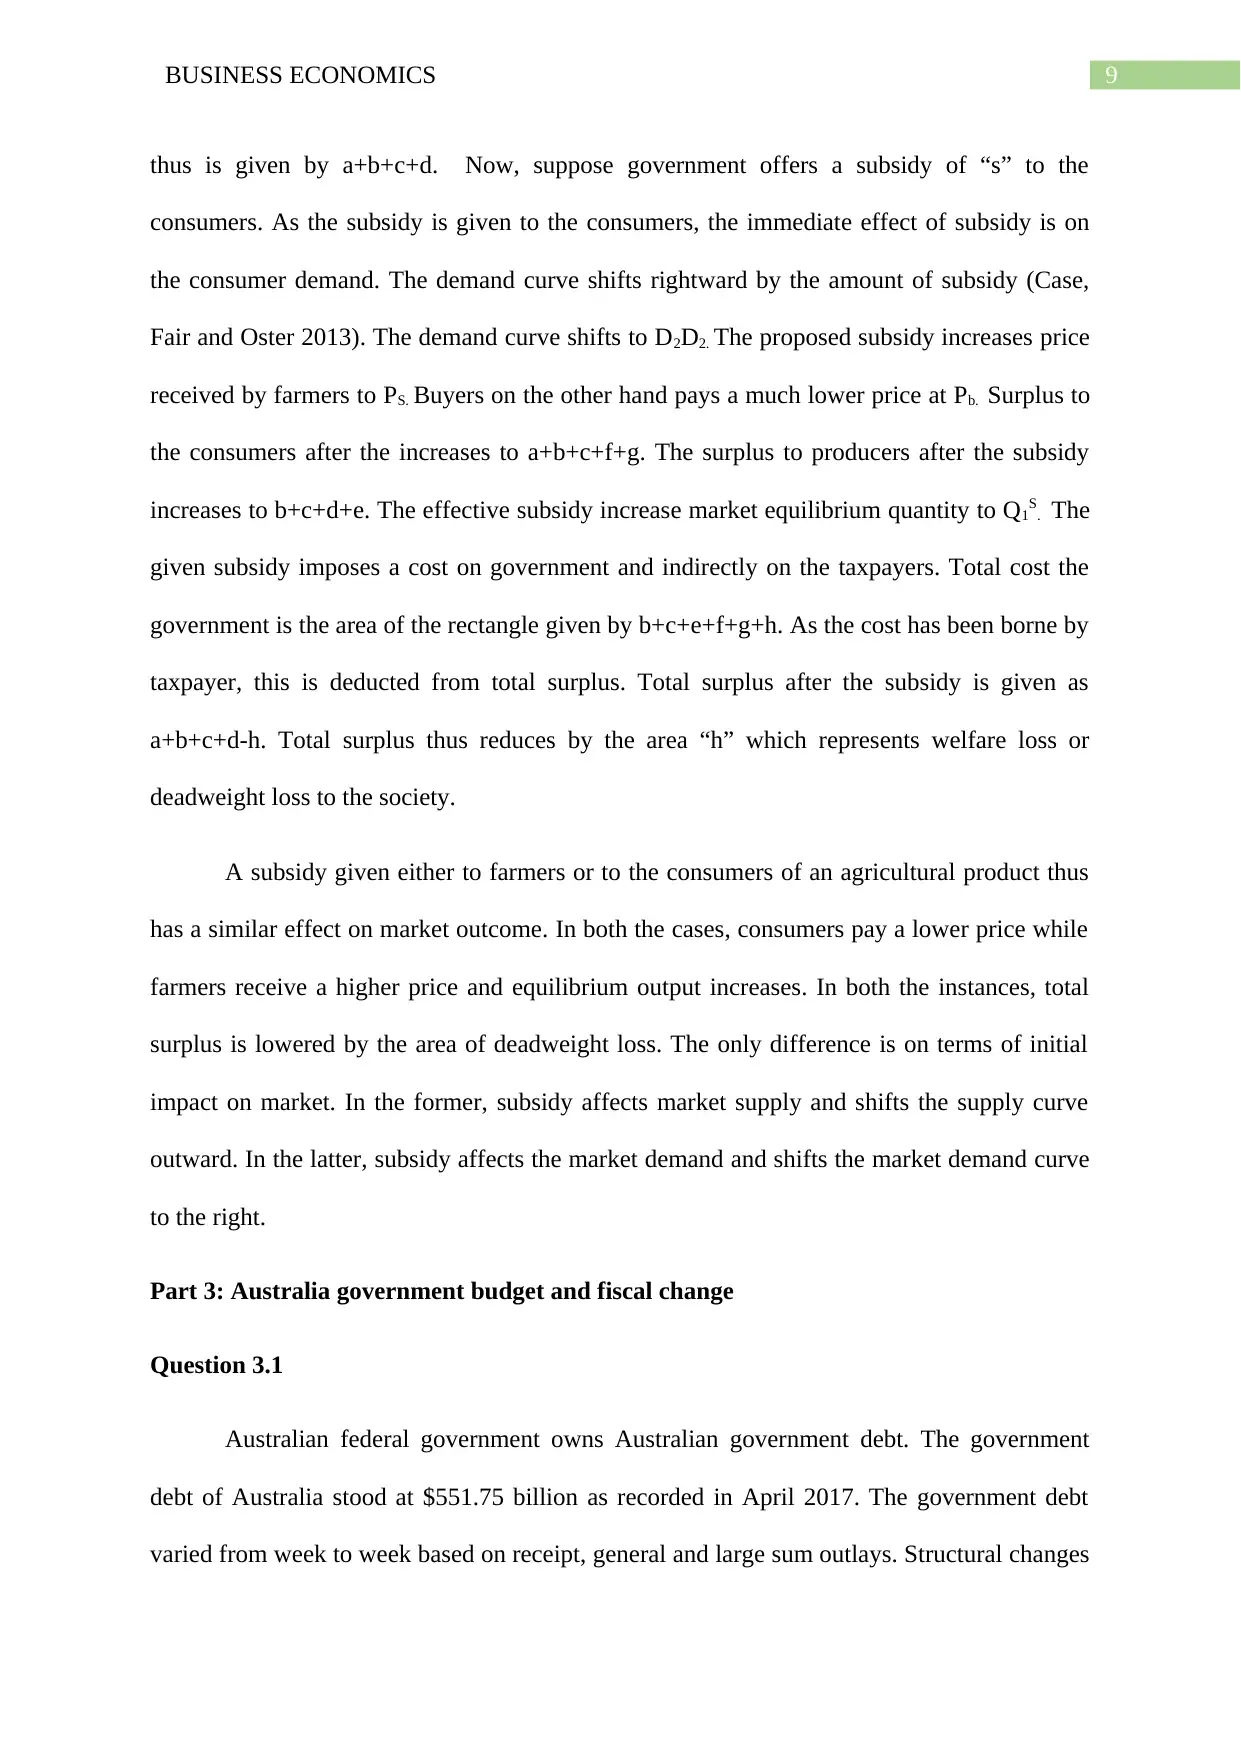
Question 2.1: Impact of drought on market outcome
Production of agricultural output depends on climatic condition. Production of
specific crops require certain amount of water, sunlight, air and other. Lack of any one of the
essential components can hamper agricultural production largely. Drought, defined as a
situation with of a prolonged dry condition disrupts agricultural production and lowers supply
(Nicholson and Snyder 2014). The effect of drought on market of an agricultural product is
explained below
Figure 1: Effect of drought on agricultural product
(Source: as created by Author)
Suppose market demand curve of the agricultural product is DD. The corresponding
market supply curve is given by SS. Equilibrium in the market corresponds to the point E.
This is the point where market demand and market supply curve intersects. The respective
equilibrium price and quantity of the product are P1 and Q1 respectively. Now consumer and
producer surplus in the marker refers to the respective gain to consumers and producers in the
⊘ This is a preview!⊘
Do you want full access?
Subscribe today to unlock all pages.
Trusted by 1+ million students worldwide
6BUSINESS ECONOMICS
market (Blad and Keiding 2014). Consumer surplus is described as the enclosed area above
the equilibrium price and below the market demand curve. Following the above figure,
consumer surplus under free market equilibrium is given by the composite area of
A+B+C+D. Similarly, producer surplus is the enclosed area above the supply curve and
below equilibrium. In the above figure, producer surplus is given by the area F+G+H. Now,
outbreak of a drought alters market outcome by affecting the market supply. The lack of
water and unfavorable soil condition during drought lowers agricultural productivity
(Nechyba 2016). As supply contracts, the supply curve shifts inward to S1S1. Consequently,
equilibrium shifts up along the demand curve to E1. The contraction of supply due to drought
lowers equilibrium quantity to Q2. Given the demand, the supply shortage increases
equilibrium price to P2. The change in equilibrium condition leads to a change in consumer
and producer surplus. The increased price lower consumer surplus only to the area of the
triangle A. Producer surplus on the other hand lower to only to area B+F. Part of the
consumer surplus specifically “B”, is now enjoyed by producers because of high price
(Mahanty 2014). Drought thus reduces market quantity while raise market prices. Total
surplus reduces because of a decline in both consumer and producer surplus.
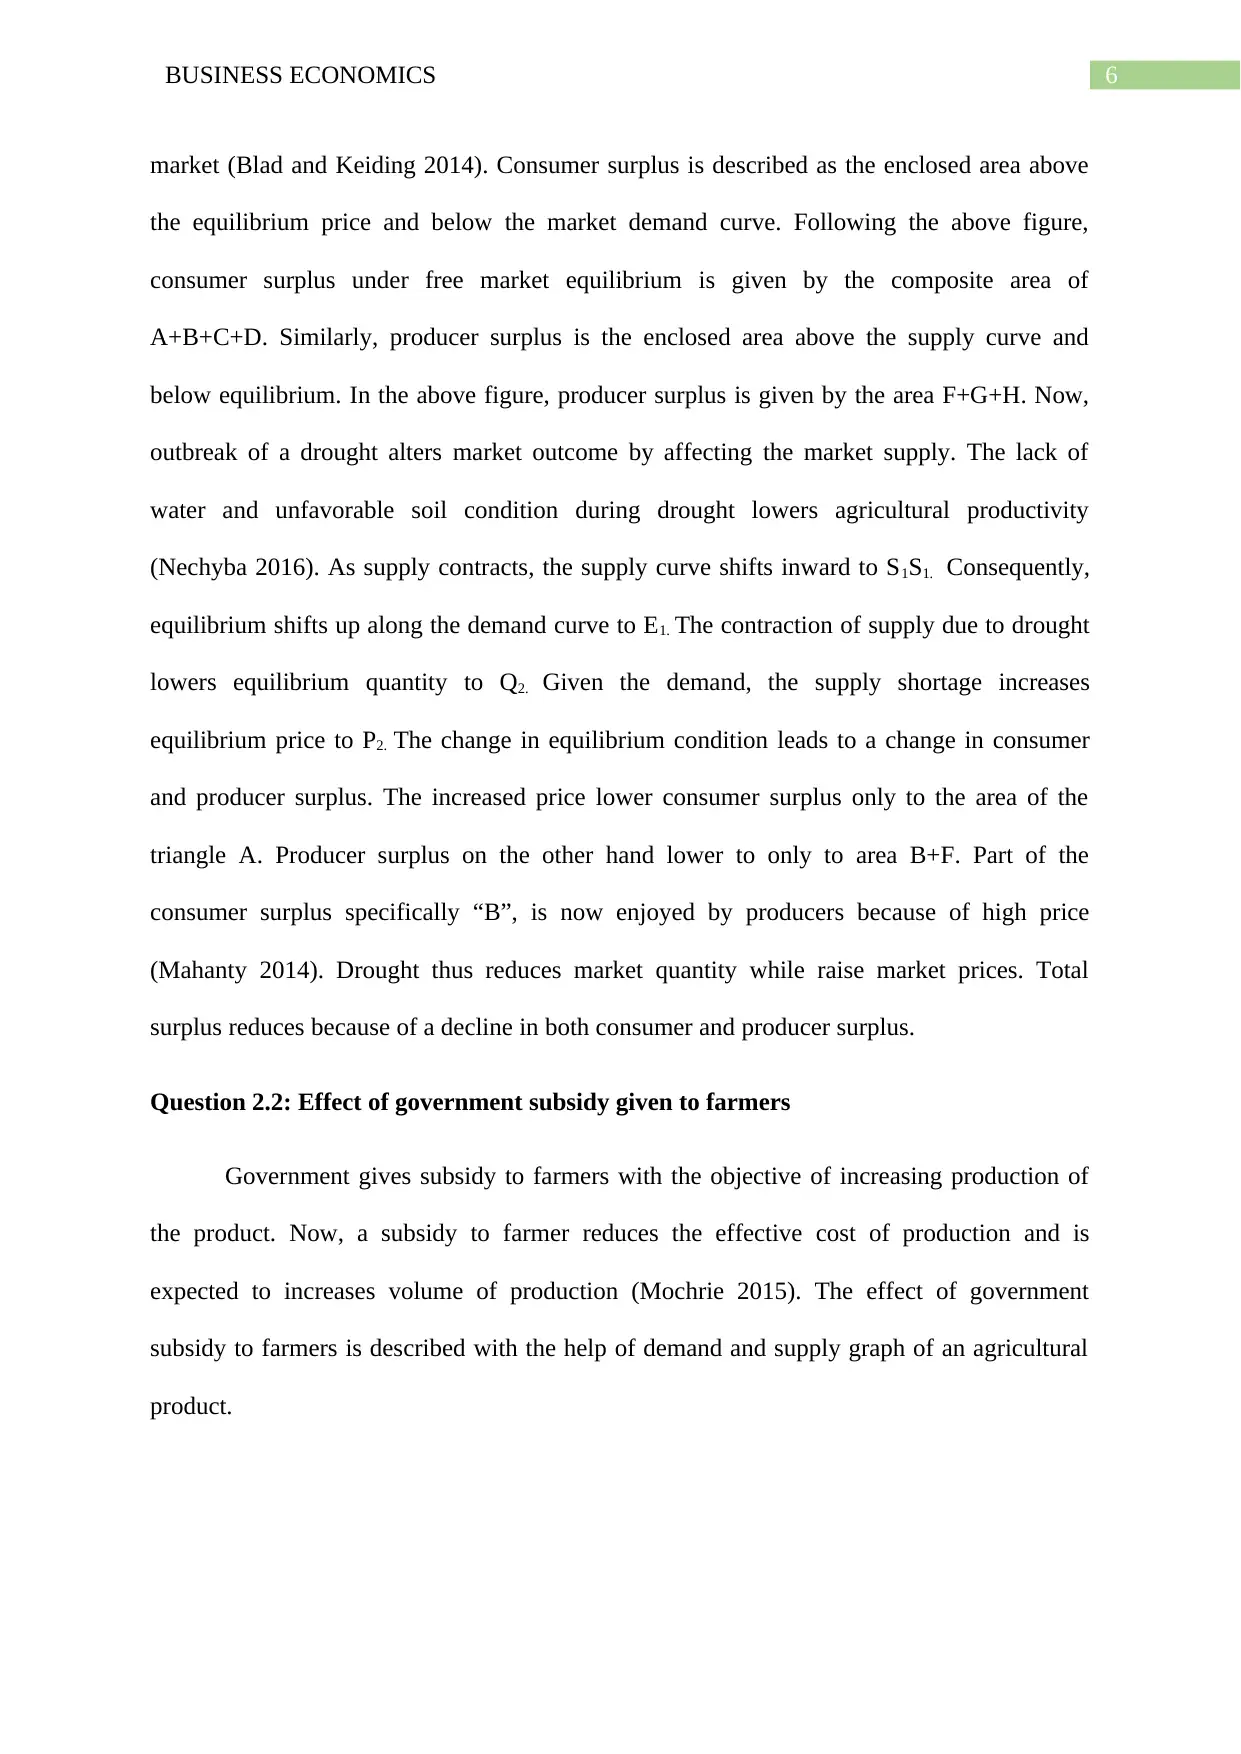
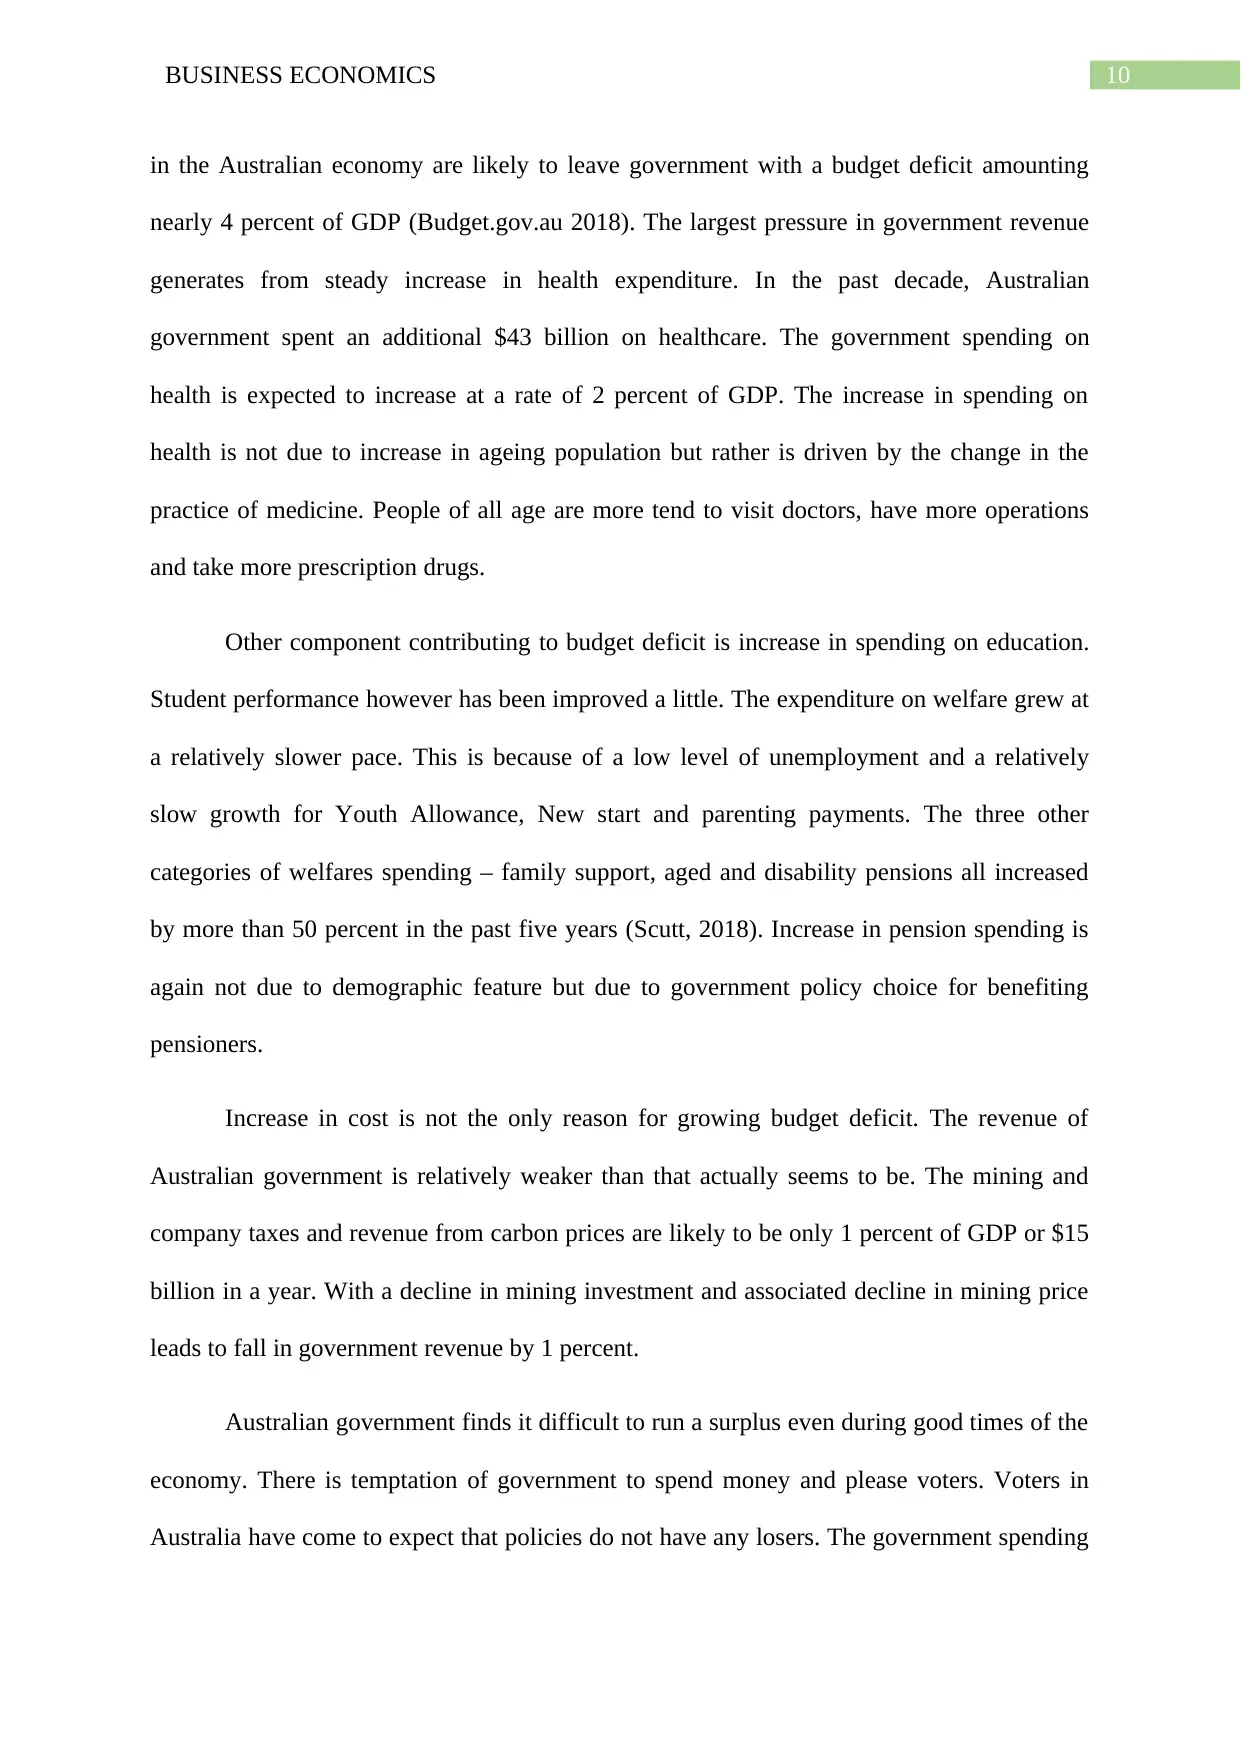
Question 2.2: Effect of government subsidy given to farmers
Government gives subsidy to farmers with the objective of increasing production of
the product. Now, a subsidy to farmer reduces the effective cost of production and is
expected to increases volume of production (Mochrie 2015). The effect of government
subsidy to farmers is described with the help of demand and supply graph of an agricultural
product.
market (Blad and Keiding 2014). Consumer surplus is described as the enclosed area above
the equilibrium price and below the market demand curve. Following the above figure,
consumer surplus under free market equilibrium is given by the composite area of
A+B+C+D. Similarly, producer surplus is the enclosed area above the supply curve and
below equilibrium. In the above figure, producer surplus is given by the area F+G+H. Now,
outbreak of a drought alters market outcome by affecting the market supply. The lack of
water and unfavorable soil condition during drought lowers agricultural productivity
(Nechyba 2016). As supply contracts, the supply curve shifts inward to S1S1. Consequently,
equilibrium shifts up along the demand curve to E1. The contraction of supply due to drought
lowers equilibrium quantity to Q2. Given the demand, the supply shortage increases
equilibrium price to P2. The change in equilibrium condition leads to a change in consumer
and producer surplus. The increased price lower consumer surplus only to the area of the
triangle A. Producer surplus on the other hand lower to only to area B+F. Part of the
consumer surplus specifically “B”, is now enjoyed by producers because of high price
(Mahanty 2014). Drought thus reduces market quantity while raise market prices. Total
surplus reduces because of a decline in both consumer and producer surplus.
Question 2.2: Effect of government subsidy given to farmers
Government gives subsidy to farmers with the objective of increasing production of
the product. Now, a subsidy to farmer reduces the effective cost of production and is
expected to increases volume of production (Mochrie 2015). The effect of government
subsidy to farmers is described with the help of demand and supply graph of an agricultural
product.
Paraphrase This Document
Need a fresh take? Get an instant paraphrase of this document with our AI Paraphraser
7BUSINESS ECONOMICS
Figure 2: Impact of government subsidy on farmers
(Source: as created by Author)
The curve S1S1 shows market supply of the agricultural product. The associated
demand for the agricultural product is explained by the curve D1D1. Without subsidy, market
price is P* and market quantity is Q*. Under free market forces consumer surplus is given by
the area A+B. Corresponding producer surplus is area C+D. Total surplus thus is equivalent
to the area A+B+C+D. Now, suppose government offers a subsidy of “S” to the farmers. As
the subsidy is given to the farmers, immediate effect of the subsidy is to shift the supply
curve to the right to S2S2 by the amount of subsidy (Jain and Ohri 2015). Buyers now pay
lower price of PB. Farmers on the other hand receives a higher price at PS. The difference in
prices is equivalent to the amount of subsidy. The subsidy increase equilibrium quantity of
the product from Q* to QS. At the lower price, consumer surplus now increases to
A+B+C+F+G. The higher price increases producer surplus to B+C+D+E. The subsidy has a
cost to the government. The cost equals subsidy times the quantity produced after subsidy.
Total cost of subsidy to the government is given by B+C+E+F+G+H. The total surplus after
subsidy thus is given as A+B+C+D – H. Total surplus after the subsidy thus lowers by the
8BUSINESS ECONOMICS
area H. This area represents deadweight loss resulted from misallocation of resources due to
subsidy (Stoneman, Bartoloni and Baussola 2018).
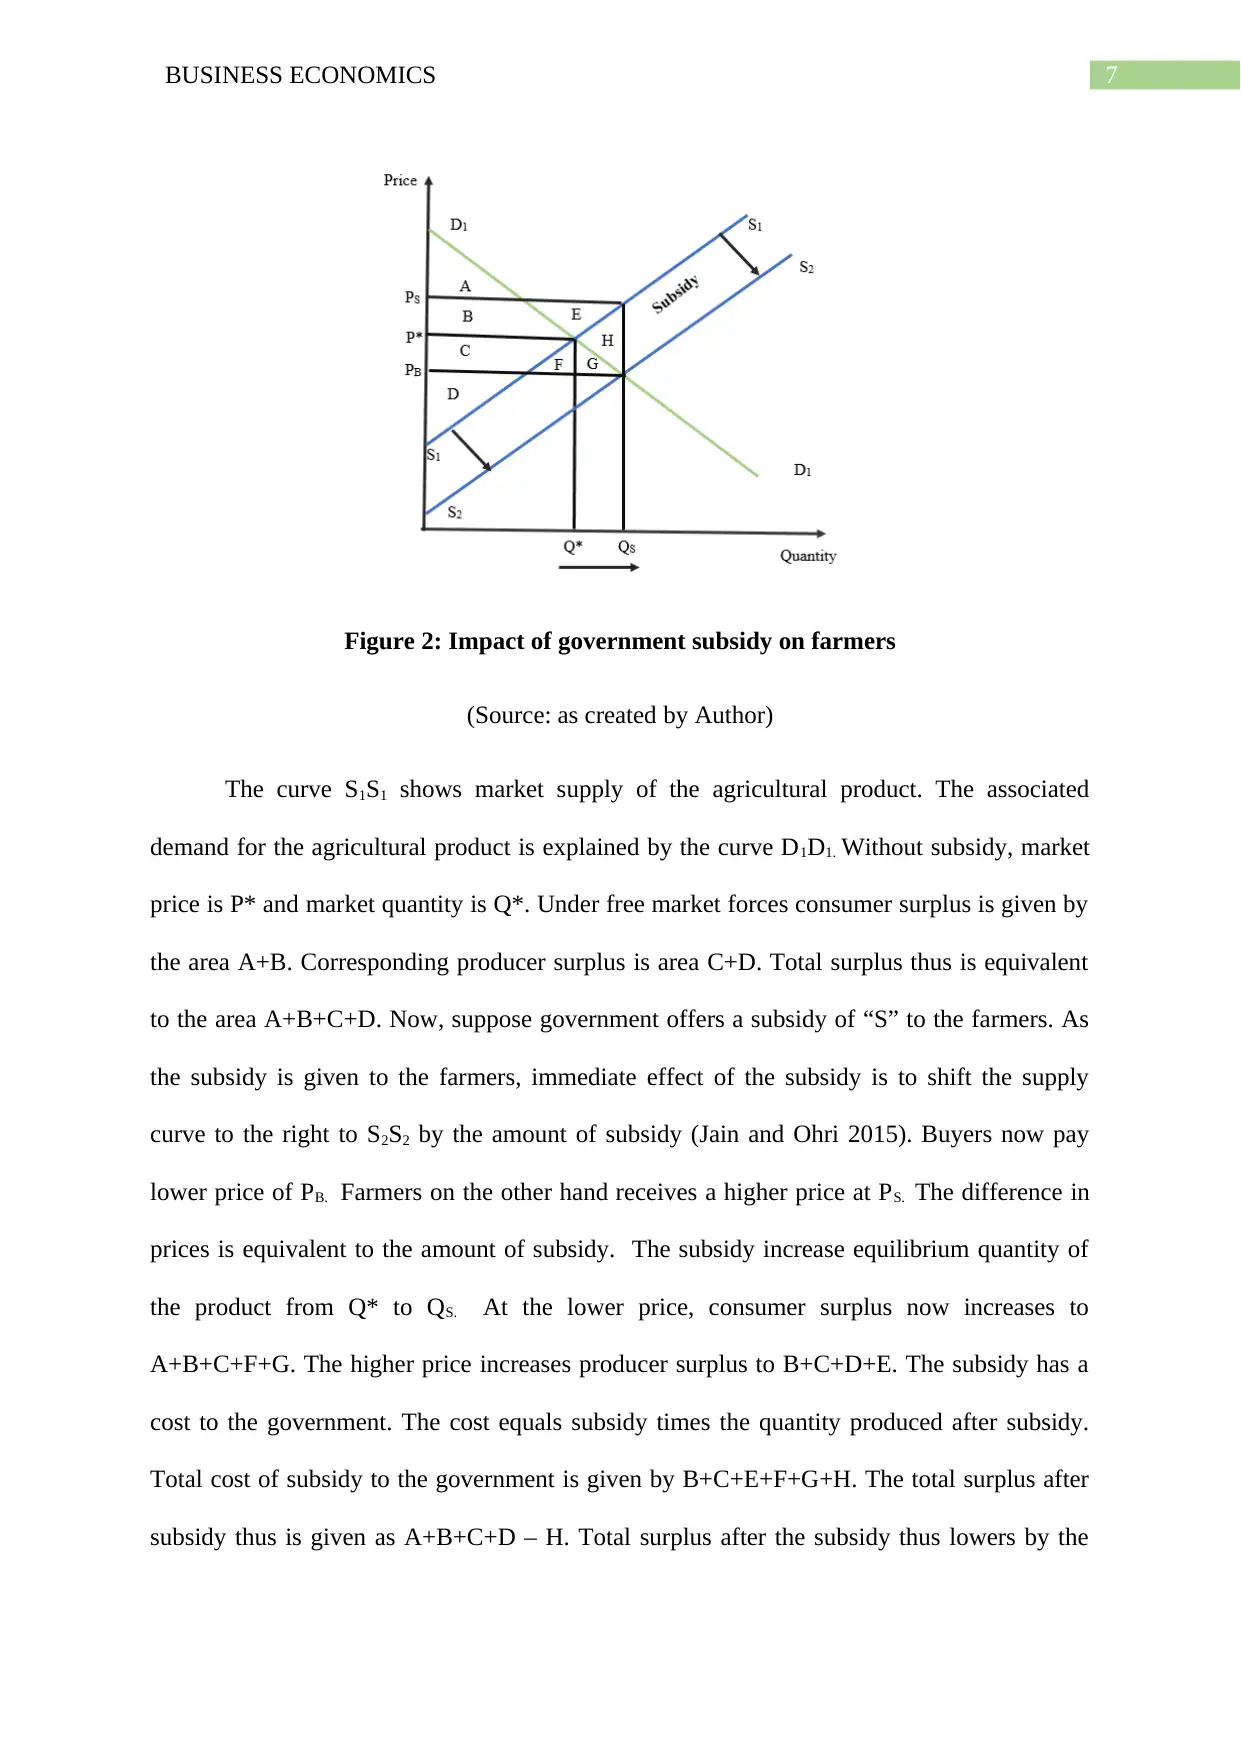
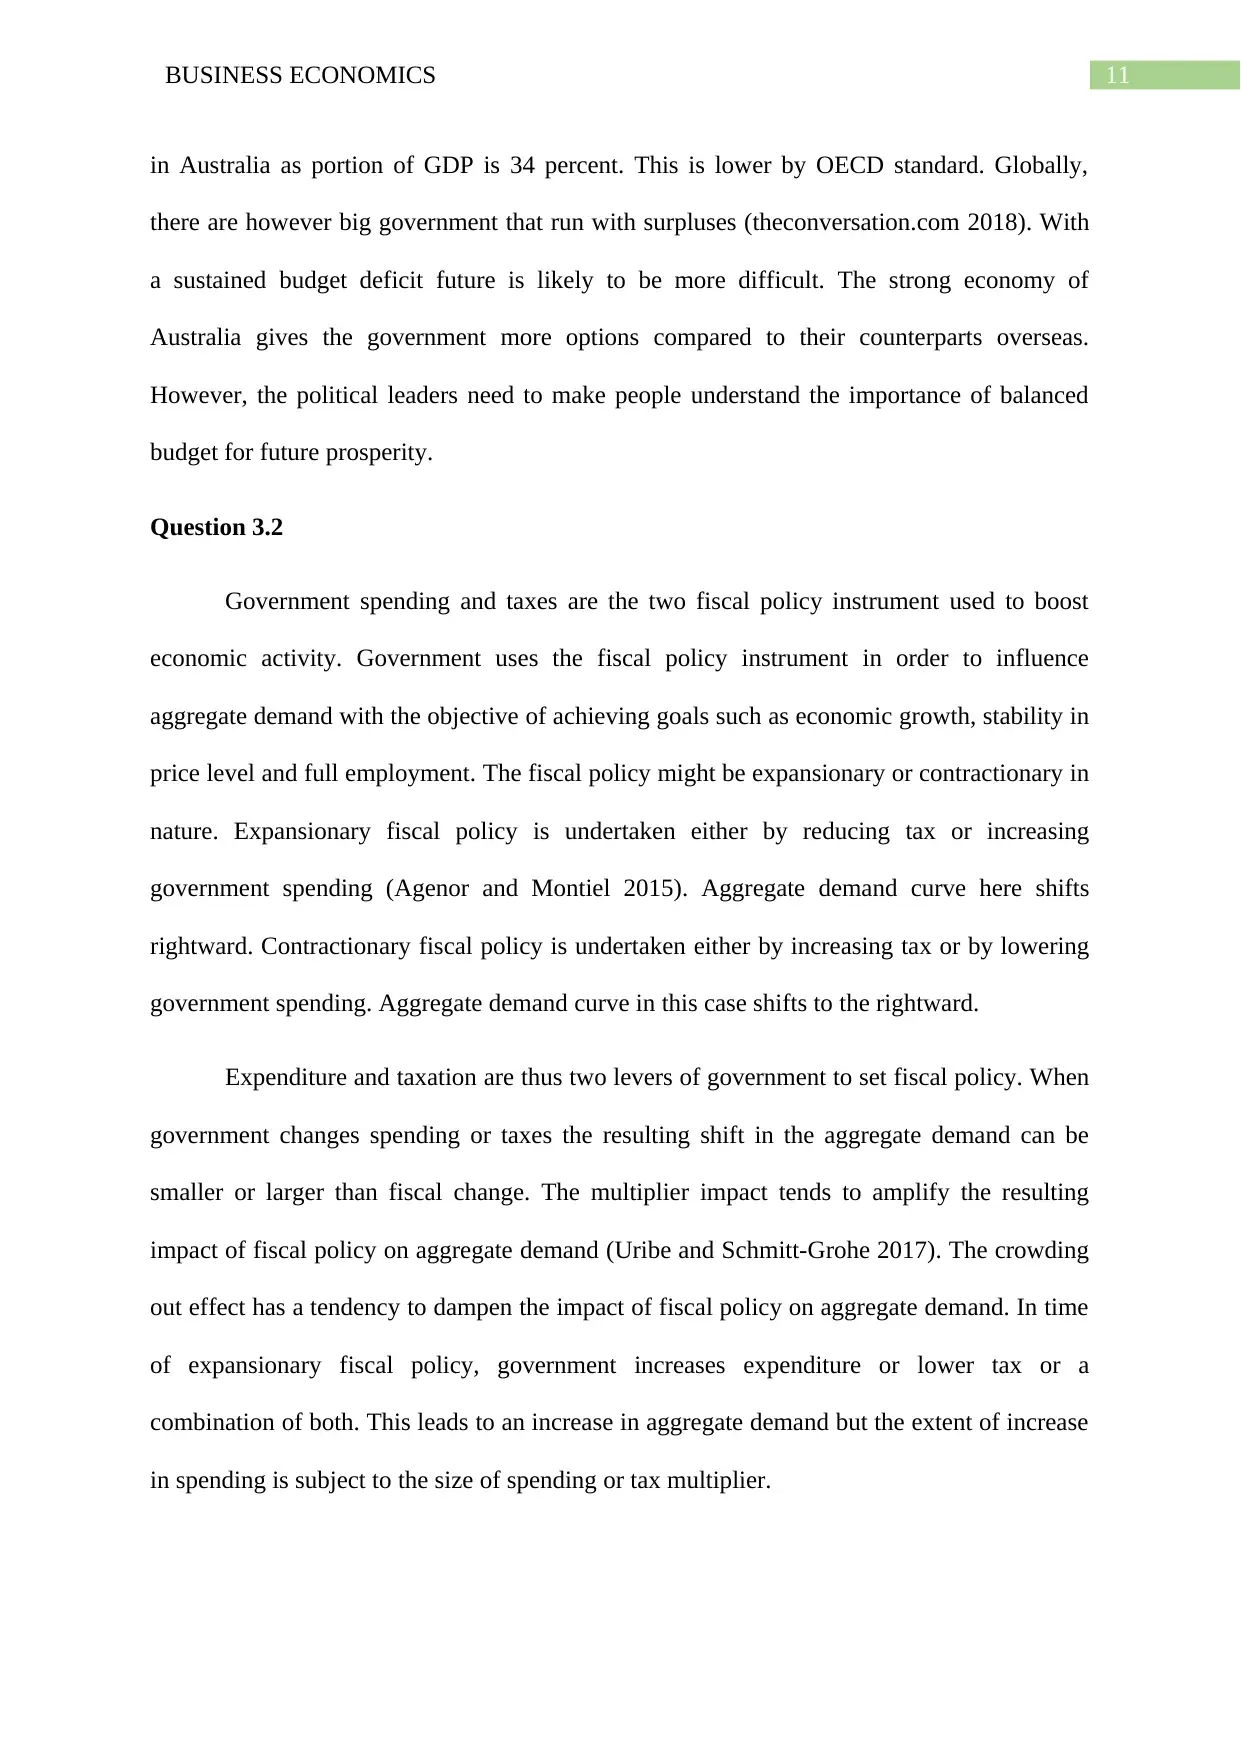
Question 2.2 Effect of government subsidy given to consumers
Government can also provide subsidy to consumers to encourage consumption of the
product. Subsidy by reducing effective price to buyers’ increase consumption and thus
indirectly helps producers. The impact of a subsidy to consumers has a similar effect to that
of a subsidy on farmers. This is explained in the figure below.
Figure 3: Impact of government subsidy on consumers
(Source: as created by Author)
Before the subsidy, demand and supply condition in the market are given by D1D1 and
S1S1 respectively. Equilibrium price and quantity in the market are given by P1 and Q1
respectively. At the free market equilibrium producer enjoy an area of surplus given by c+d.
Consumers enjoys a surplus given by the area a+b. Total economic surplus before the subsidy
area H. This area represents deadweight loss resulted from misallocation of resources due to
subsidy (Stoneman, Bartoloni and Baussola 2018).
Question 2.2 Effect of government subsidy given to consumers
Government can also provide subsidy to consumers to encourage consumption of the
product. Subsidy by reducing effective price to buyers’ increase consumption and thus
indirectly helps producers. The impact of a subsidy to consumers has a similar effect to that
of a subsidy on farmers. This is explained in the figure below.
Figure 3: Impact of government subsidy on consumers
(Source: as created by Author)
Before the subsidy, demand and supply condition in the market are given by D1D1 and
S1S1 respectively. Equilibrium price and quantity in the market are given by P1 and Q1
respectively. At the free market equilibrium producer enjoy an area of surplus given by c+d.
Consumers enjoys a surplus given by the area a+b. Total economic surplus before the subsidy
⊘ This is a preview!⊘
Do you want full access?
Subscribe today to unlock all pages.
Trusted by 1+ million students worldwide
9BUSINESS ECONOMICS
thus is given by a+b+c+d. Now, suppose government offers a subsidy of “s” to the
consumers. As the subsidy is given to the consumers, the immediate effect of subsidy is on
the consumer demand. The demand curve shifts rightward by the amount of subsidy (Case,
Fair and Oster 2013). The demand curve shifts to D2D2. The proposed subsidy increases price
received by farmers to PS. Buyers on the other hand pays a much lower price at Pb. Surplus to
the consumers after the increases to a+b+c+f+g. The surplus to producers after the subsidy
increases to b+c+d+e. The effective subsidy increase market equilibrium quantity to Q1S. The
given subsidy imposes a cost on government and indirectly on the taxpayers. Total cost the
government is the area of the rectangle given by b+c+e+f+g+h. As the cost has been borne by
taxpayer, this is deducted from total surplus. Total surplus after the subsidy is given as
a+b+c+d-h. Total surplus thus reduces by the area “h” which represents welfare loss or
deadweight loss to the society.
A subsidy given either to farmers or to the consumers of an agricultural product thus
has a similar effect on market outcome. In both the cases, consumers pay a lower price while
farmers receive a higher price and equilibrium output increases. In both the instances, total
surplus is lowered by the area of deadweight loss. The only difference is on terms of initial
impact on market. In the former, subsidy affects market supply and shifts the supply curve
outward. In the latter, subsidy affects the market demand and shifts the market demand curve
to the right.
Part 3: Australia government budget and fiscal change
Question 3.1
Australian federal government owns Australian government debt. The government
debt of Australia stood at $551.75 billion as recorded in April 2017. The government debt
varied from week to week based on receipt, general and large sum outlays. Structural changes
Paraphrase This Document
Need a fresh take? Get an instant paraphrase of this document with our AI Paraphraser
10BUSINESS ECONOMICS
in the Australian economy are likely to leave government with a budget deficit amounting
nearly 4 percent of GDP (Budget.gov.au 2018). The largest pressure in government revenue
generates from steady increase in health expenditure. In the past decade, Australian
government spent an additional $43 billion on healthcare. The government spending on
health is expected to increase at a rate of 2 percent of GDP. The increase in spending on
health is not due to increase in ageing population but rather is driven by the change in the
practice of medicine. People of all age are more tend to visit doctors, have more operations
and take more prescription drugs.
Other component contributing to budget deficit is increase in spending on education.
Student performance however has been improved a little. The expenditure on welfare grew at
a relatively slower pace. This is because of a low level of unemployment and a relatively
slow growth for Youth Allowance, New start and parenting payments. The three other
categories of welfares spending – family support, aged and disability pensions all increased
by more than 50 percent in the past five years (Scutt, 2018). Increase in pension spending is
again not due to demographic feature but due to government policy choice for benefiting
pensioners.
Increase in cost is not the only reason for growing budget deficit. The revenue of
Australian government is relatively weaker than that actually seems to be. The mining and
company taxes and revenue from carbon prices are likely to be only 1 percent of GDP or $15
billion in a year. With a decline in mining investment and associated decline in mining price
leads to fall in government revenue by 1 percent.
Australian government finds it difficult to run a surplus even during good times of the
economy. There is temptation of government to spend money and please voters. Voters in
Australia have come to expect that policies do not have any losers. The government spending
11BUSINESS ECONOMICS
in Australia as portion of GDP is 34 percent. This is lower by OECD standard. Globally,
there are however big government that run with surpluses (theconversation.com 2018). With
a sustained budget deficit future is likely to be more difficult. The strong economy of
Australia gives the government more options compared to their counterparts overseas.
However, the political leaders need to make people understand the importance of balanced
budget for future prosperity.
Question 3.2
Government spending and taxes are the two fiscal policy instrument used to boost
economic activity. Government uses the fiscal policy instrument in order to influence
aggregate demand with the objective of achieving goals such as economic growth, stability in
price level and full employment. The fiscal policy might be expansionary or contractionary in
nature. Expansionary fiscal policy is undertaken either by reducing tax or increasing
government spending (Agenor and Montiel 2015). Aggregate demand curve here shifts
rightward. Contractionary fiscal policy is undertaken either by increasing tax or by lowering
government spending. Aggregate demand curve in this case shifts to the rightward.
Expenditure and taxation are thus two levers of government to set fiscal policy. When
government changes spending or taxes the resulting shift in the aggregate demand can be
smaller or larger than fiscal change. The multiplier impact tends to amplify the resulting
impact of fiscal policy on aggregate demand (Uribe and Schmitt-Grohe 2017). The crowding
out effect has a tendency to dampen the impact of fiscal policy on aggregate demand. In time
of expansionary fiscal policy, government increases expenditure or lower tax or a
combination of both. This leads to an increase in aggregate demand but the extent of increase
in spending is subject to the size of spending or tax multiplier.
⊘ This is a preview!⊘
Do you want full access?
Subscribe today to unlock all pages.
Trusted by 1+ million students worldwide
1 out of 18
Related Documents


Your All-in-One AI-Powered Toolkit for Academic Success.
+13062052269
info@desklib.com
Available 24*7 on WhatsApp / Email
![[object Object]](/_next/static/media/star-bottom.7253800d.svg)
Unlock your academic potential
Copyright © 2020–2026 A2Z Services. All Rights Reserved. Developed and managed by ZUCOL.