Berkshire Hathaway's Acquisition - Warren E Buffet 2005 Case Analysis
VerifiedAdded on 2023/06/03
|20
|4233
|375
Case Study
AI Summary
This case study analyzes Berkshire Hathaway's acquisition of PacifiCorp in 2005, examining the market reaction, valuation methods, and bid assessment. It evaluates the deal's impact on Berkshire Hathaway's market value and explores the financial implications of the acquisition. The analysis includes a review of Berkshire Hathaway's investment in MidAmerican Energy Holdings and its past performance, along with an assessment of its investments in companies like American Express and Coca-Cola. The study uses earnings multiple methods to value PacifiCorp and assesses the investment's potential to create value, providing a comprehensive overview of the financial strategies and outcomes associated with the acquisition.
Running head: FINANCE
Warren E Buffet 2005
Name of the Student:
Name of the University:
Author’s Note:
Warren E Buffet 2005
Name of the Student:
Name of the University:
Author’s Note:
Paraphrase This Document
Need a fresh take? Get an instant paraphrase of this document with our AI Paraphraser
1WARREN E BUFFET
Table of Contents
In Response to Question 1...............................................................................................................2
In Response to Question 2...............................................................................................................3
In Response to Question 3...............................................................................................................5
In Response to Question 4...............................................................................................................7
In Response to Question 5...............................................................................................................8
In Response to Question 6...............................................................................................................9
In Response to Question 7.............................................................................................................10
Reference.......................................................................................................................................11
Appendix........................................................................................................................................13
2WARREN E BUFFET
In Response to Question 1
The acquisition of Pacific Corp by Berkshire Hathaway subsidiary company
MidAmerican Energy Holdings was done on May 24, 2005. The Berkshire Hathaway
Incorporation through its investment company MidAmerican Energy Holdings Company did the
acquisition. The parent company for the Pacific Corp was the Scottish Power plc, for an all 9.4
billion, which was a mix of debt and equity. The stock market took this acquisition as a positive
news for the Berkshire Hathaway Incorporation where the shares of the company rose by around
2.4% for that day when the acquisition was announced which represented an all-total rise of 2.55
billion dollars in the market value of the company (Peterson and Malko 2015).
The Berkshire Hathaway was having more than around 43 billion dollars of its
investment parked in Cash and Cash equivalents that were not earning sufficient for the investors
and stakeholders. Since the year 2001, it is crucial to note that the company was in search of
some potential investments that could bring potential source of revenue generation for the
company. The company was in search of an elephant i.e.., a company or an industry where the
investment done by the company is viable and the same was done by the company when the
company found that in the year 2004 (Sunderasan 2015). The return the Berkshire Hathaway saw
in the Energy Industry was lucrative and especially the company Pacific Corp was one of the
lucrative company. The company had some key feature such as it was one of the leading in terms
of market share; the low cost output and the 1.6 million-customer base were some of the key
feature. The company would create value for the MidAmerican Energy Holding Company,
which in turn will create the value for the Berkshire Hathaway company through the sources of
the investment done in the company. The Berkshire Company was having an ideal amount of
⊘ This is a preview!⊘
Do you want full access?
Subscribe today to unlock all pages.
Trusted by 1+ million students worldwide
3WARREN E BUFFET
investment to be deployed put in cash and cash equivalents however; the company due to scarce
investment asset class could not utilize the same (Aggarwal and Burgess 2014).
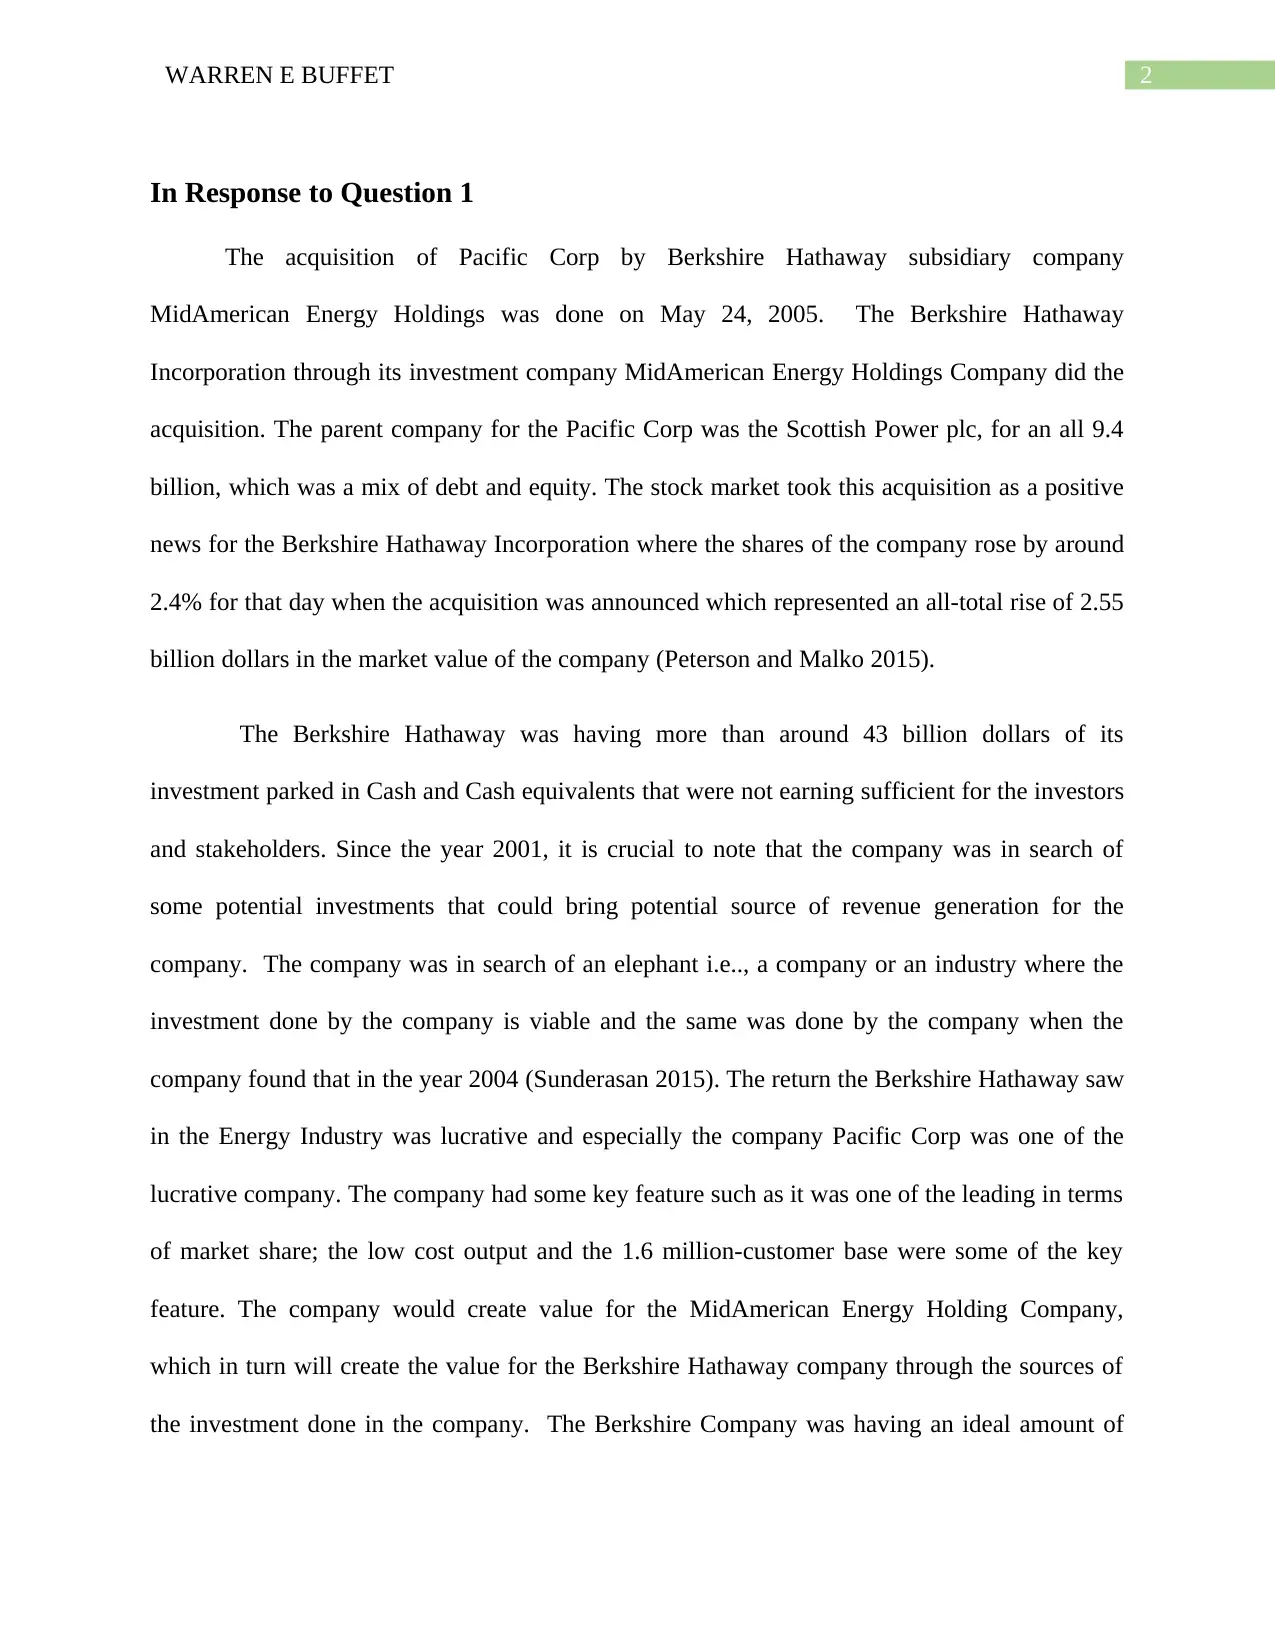
The 2.54 billion dollar increase in the market value of the Berkshire Hathaway Company
was seen when the company announced for the second biggest acquisition of the company for
about 9.4 billion dollars. The same would solve the problem of the Berkshire Hathaway
Company that the same was faced because of the pilling amount in the cash and cash equivalents
of the company since the year2011. The company found the lucrative energy sector company
Pacific Corp Company that was one of the lucrative company due to its presence in the major 6
states of the United States. The company along with the strong customer’s base and low cost
output along with the rising and better trade off profitability feature provided the company to
acquire the Pacific Corporation Company.
2004 2005
0
500
1000
1500
2000
2500
3000
3500
4000
Pacifi c Corporati on
Net Income Shareholder' Equity
Figure 1: Pacific Corporation Financials
In Response to Question 2
The choice of valuation method selected for the valuation of PacifiCorp was the use of
Earnings Multiple method and the valuation approach gives us the pricing and valuation of the
company in terms of the different components of the financial statements. Yes after the financial
investment to be deployed put in cash and cash equivalents however; the company due to scarce
investment asset class could not utilize the same (Aggarwal and Burgess 2014).
The 2.54 billion dollar increase in the market value of the Berkshire Hathaway Company
was seen when the company announced for the second biggest acquisition of the company for
about 9.4 billion dollars. The same would solve the problem of the Berkshire Hathaway
Company that the same was faced because of the pilling amount in the cash and cash equivalents
of the company since the year2011. The company found the lucrative energy sector company
Pacific Corp Company that was one of the lucrative company due to its presence in the major 6
states of the United States. The company along with the strong customer’s base and low cost
output along with the rising and better trade off profitability feature provided the company to
acquire the Pacific Corporation Company.
2004 2005
0
500
1000
1500
2000
2500
3000
3500
4000
Pacifi c Corporati on
Net Income Shareholder' Equity
Figure 1: Pacific Corporation Financials
In Response to Question 2
The choice of valuation method selected for the valuation of PacifiCorp was the use of
Earnings Multiple method and the valuation approach gives us the pricing and valuation of the
company in terms of the different components of the financial statements. Yes after the financial
Paraphrase This Document
Need a fresh take? Get an instant paraphrase of this document with our AI Paraphraser
4WARREN E BUFFET
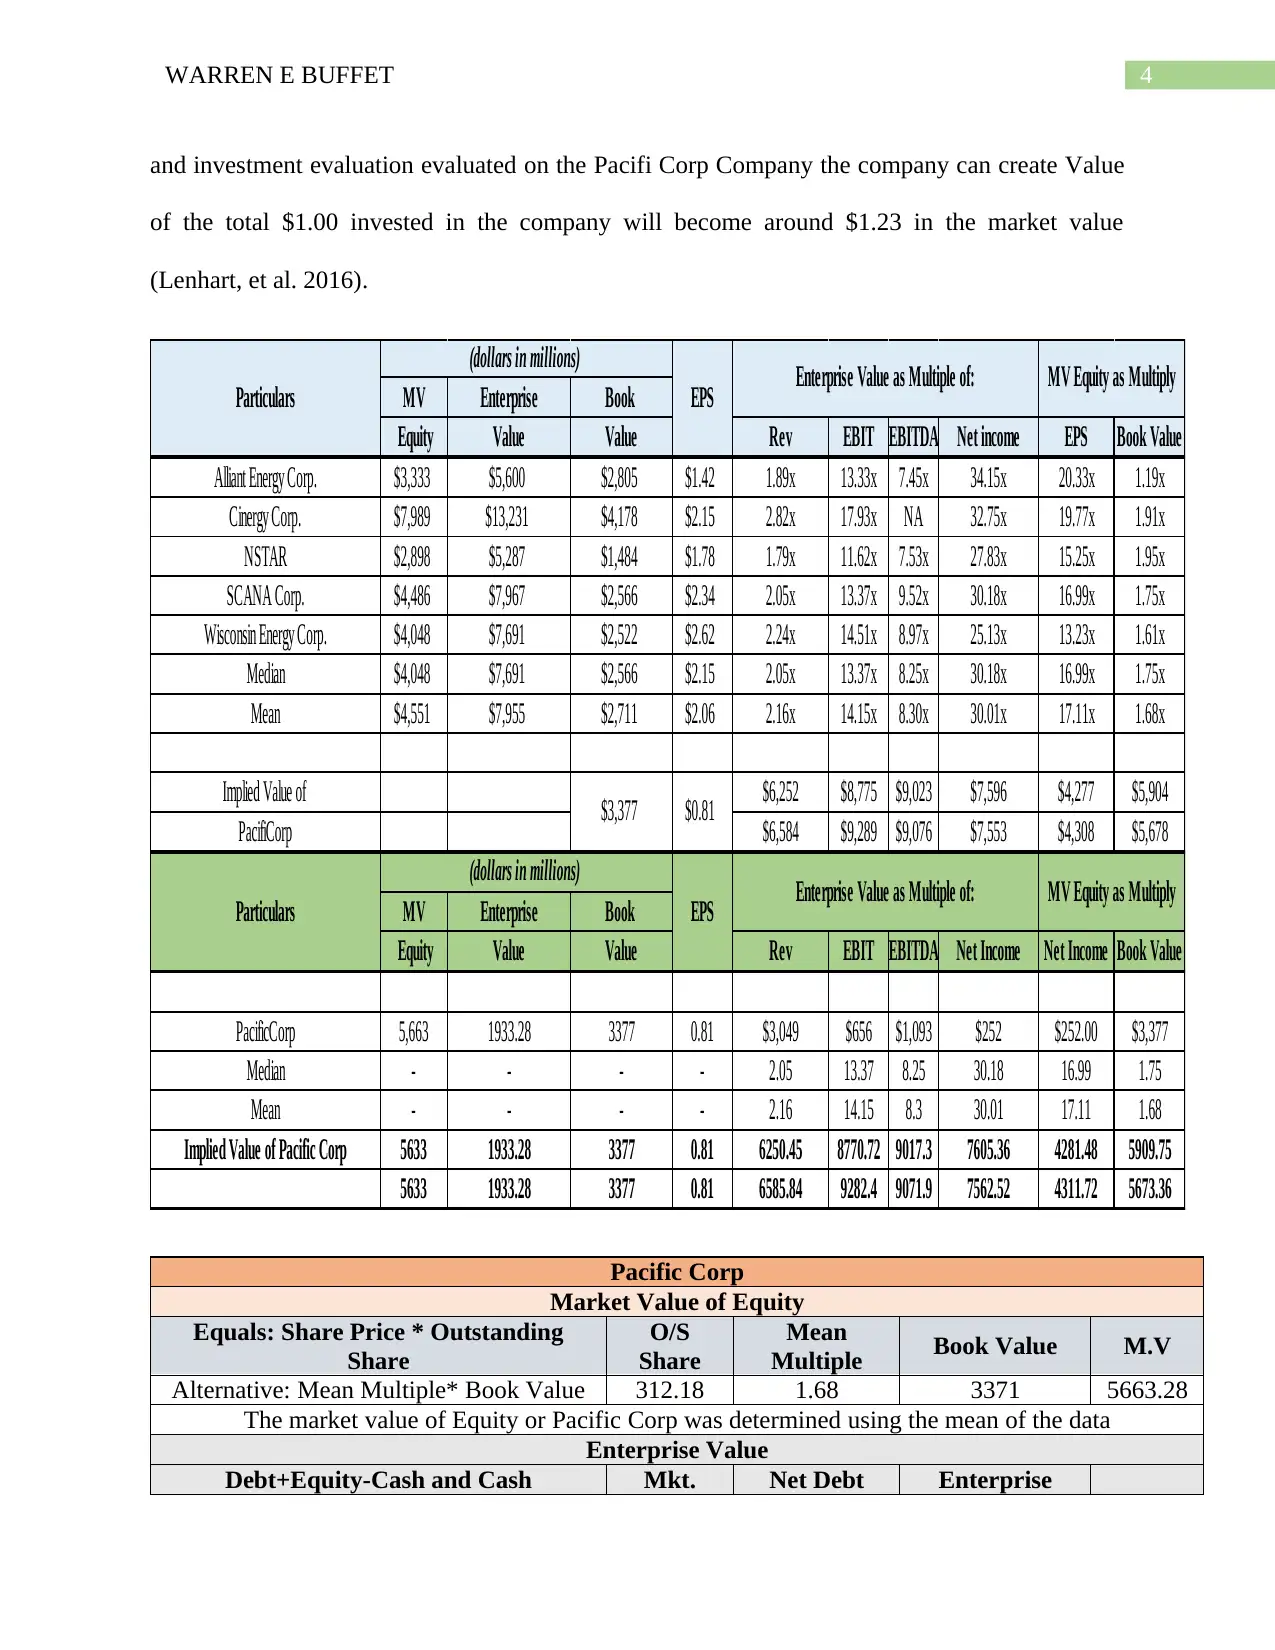
and investment evaluation evaluated on the Pacifi Corp Company the company can create Value
of the total $1.00 invested in the company will become around $1.23 in the market value
(Lenhart, et al. 2016).
MV Enterprise Book
Equity Value Value Rev EBIT EBITDA Net income EPS Book Value
Alliant Energy Corp. $3,333 $5,600 $2,805 $1.42 1.89x 13.33x 7.45x 34.15x 20.33x 1.19x
Cinergy Corp. $7,989 $13,231 $4,178 $2.15 2.82x 17.93x NA 32.75x 19.77x 1.91x
NSTAR $2,898 $5,287 $1,484 $1.78 1.79x 11.62x 7.53x 27.83x 15.25x 1.95x
SCANA Corp. $4,486 $7,967 $2,566 $2.34 2.05x 13.37x 9.52x 30.18x 16.99x 1.75x
Wisconsin Energy Corp. $4,048 $7,691 $2,522 $2.62 2.24x 14.51x 8.97x 25.13x 13.23x 1.61x
Median $4,048 $7,691 $2,566 $2.15 2.05x 13.37x 8.25x 30.18x 16.99x 1.75x
Mean $4,551 $7,955 $2,711 $2.06 2.16x 14.15x 8.30x 30.01x 17.11x 1.68x
Implied Value of $6,252 $8,775 $9,023 $7,596 $4,277 $5,904
PacifiCorp $6,584 $9,289 $9,076 $7,553 $4,308 $5,678
MV Enterprise Book
Equity Value Value Rev EBIT EBITDA Net Income Net Income Book Value
PacificCorp 5,663 1933.28 3377 0.81 $3,049 $656 $1,093 $252 $252.00 $3,377
Median - - - - 2.05 13.37 8.25 30.18 16.99 1.75
Mean - - - - 2.16 14.15 8.3 30.01 17.11 1.68
Implied Value of Pacific Corp 5633 1933.28 3377 0.81 6250.45 8770.72 9017.3 7605.36 4281.48 5909.75
5633 1933.28 3377 0.81 6585.84 9282.4 9071.9 7562.52 4311.72 5673.36
(dollars in millions) Enterprise Value as Multiple of:
MV Equity as Multiply
MV Equity as Multiply
Particulars EPS
EPSParticulars
(dollars in millions) Enterprise Value as Multiple of:
$3,377 $0.81
Pacific Corp
Market Value of Equity
Equals: Share Price * Outstanding
Share
O/S
Share
Mean
Multiple Book Value M.V
Alternative: Mean Multiple* Book Value 312.18 1.68 3371 5663.28
The market value of Equity or Pacific Corp was determined using the mean of the data
Enterprise Value
Debt+Equity-Cash and Cash Mkt. Net Debt Enterprise
5WARREN E BUFFET
Equivalents Value Value
Or: Market Value - Net Debt 5633.28 3700 1933.28
Net Debt S.T Debt L. T Debt Cash Net
Debt
Net Debt = S.T. Debt + L.T. Debt 270 3629 199 3700
Investment Evaluation of Pacific Corp
Investment Horizon (Assumption) 5
Initial Investment 9.4
No Dividends are Paid and Cash Flows are
Reinvested
Return on Equity (Growth Rate) 15%
Discount Rate/Cost of Equity 9%
Year of Investments 0 1 2 3 4 5
Investment or Book Value of Equity 9.4 10.81 12.4315 14.29623 16.44066 18.90676
Market Value (Or Intrinsic Value) =
Present Value @ 9% of
18.907 = 12.288
Market/Book = 12.28/9.4 = 1.307234
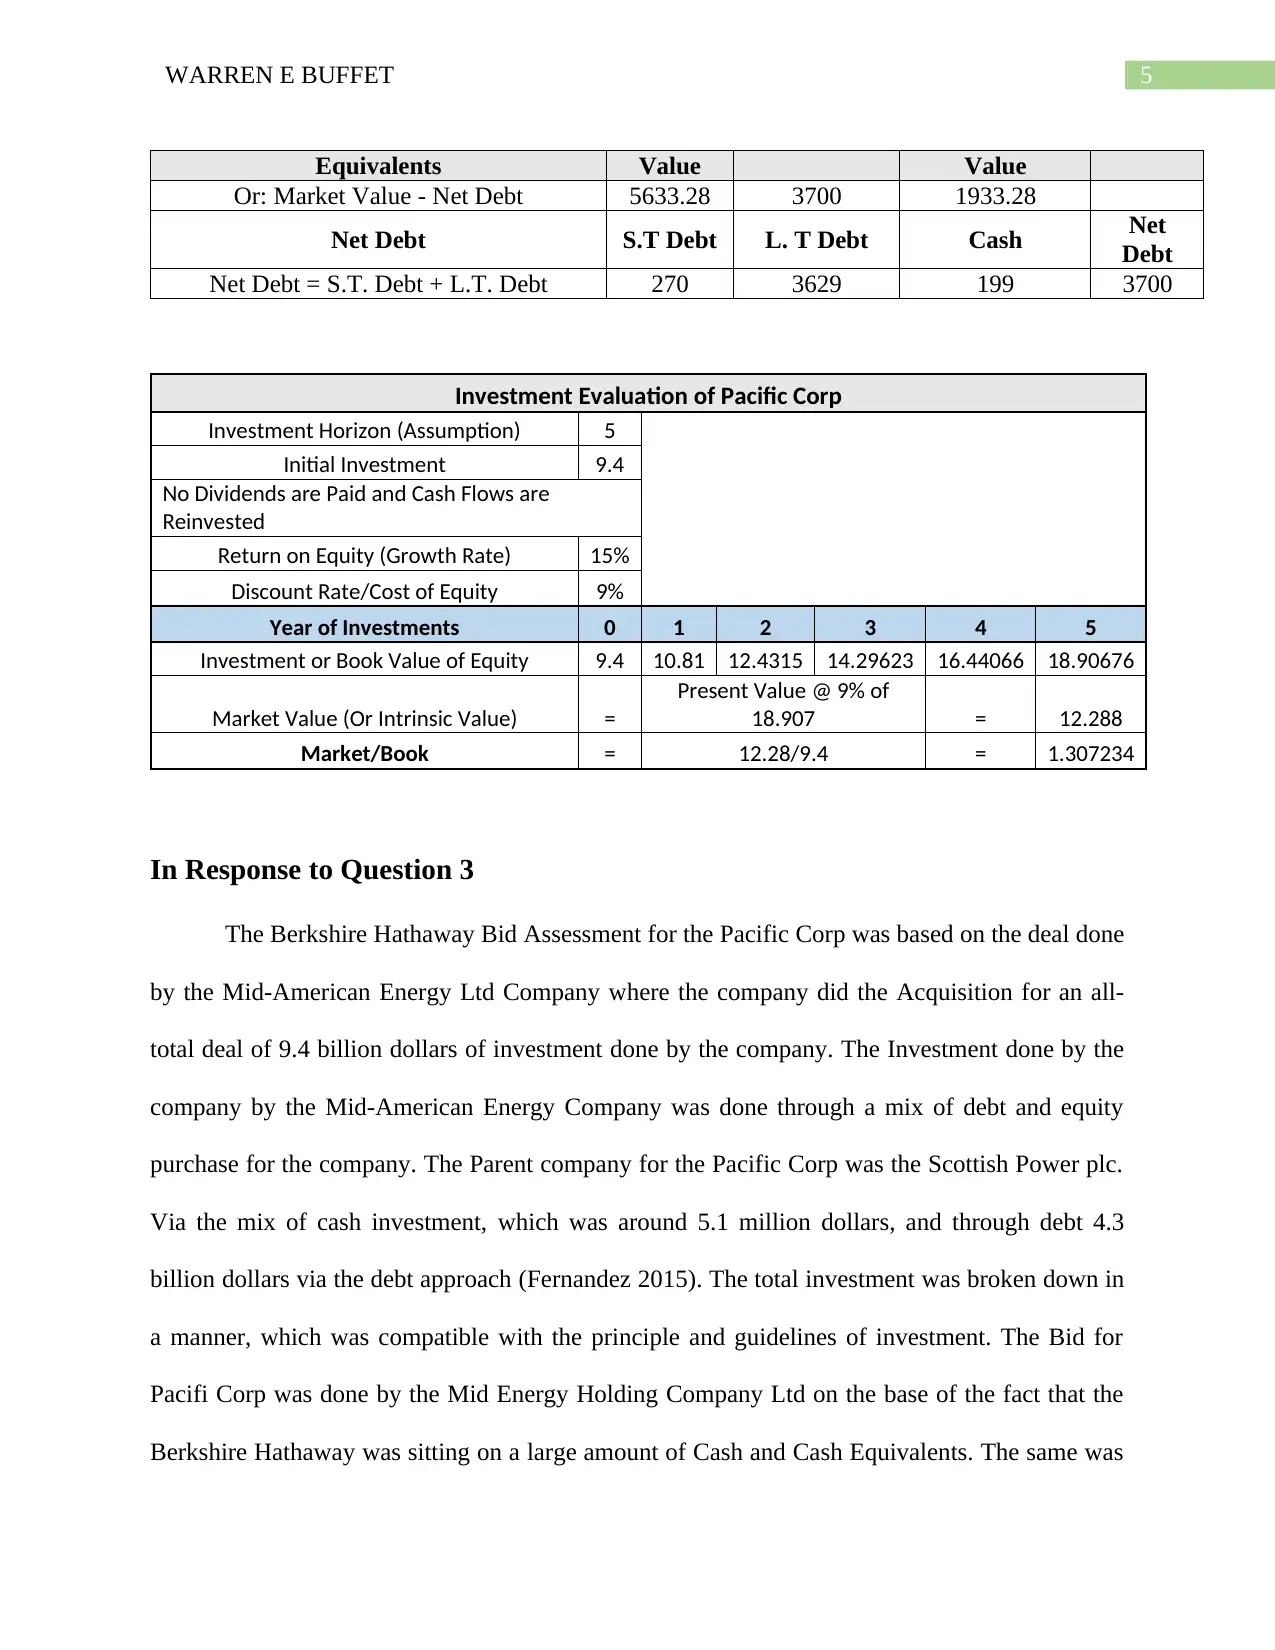
In Response to Question 3
The Berkshire Hathaway Bid Assessment for the Pacific Corp was based on the deal done
by the Mid-American Energy Ltd Company where the company did the Acquisition for an all-
total deal of 9.4 billion dollars of investment done by the company. The Investment done by the
company by the Mid-American Energy Company was done through a mix of debt and equity
purchase for the company. The Parent company for the Pacific Corp was the Scottish Power plc.
Via the mix of cash investment, which was around 5.1 million dollars, and through debt 4.3
billion dollars via the debt approach (Fernandez 2015). The total investment was broken down in
a manner, which was compatible with the principle and guidelines of investment. The Bid for
Pacifi Corp was done by the Mid Energy Holding Company Ltd on the base of the fact that the
Berkshire Hathaway was sitting on a large amount of Cash and Cash Equivalents. The same was
Equivalents Value Value
Or: Market Value - Net Debt 5633.28 3700 1933.28
Net Debt S.T Debt L. T Debt Cash Net
Debt
Net Debt = S.T. Debt + L.T. Debt 270 3629 199 3700
Investment Evaluation of Pacific Corp
Investment Horizon (Assumption) 5
Initial Investment 9.4
No Dividends are Paid and Cash Flows are
Reinvested
Return on Equity (Growth Rate) 15%
Discount Rate/Cost of Equity 9%
Year of Investments 0 1 2 3 4 5
Investment or Book Value of Equity 9.4 10.81 12.4315 14.29623 16.44066 18.90676
Market Value (Or Intrinsic Value) =
Present Value @ 9% of
18.907 = 12.288
Market/Book = 12.28/9.4 = 1.307234
In Response to Question 3
The Berkshire Hathaway Bid Assessment for the Pacific Corp was based on the deal done
by the Mid-American Energy Ltd Company where the company did the Acquisition for an all-
total deal of 9.4 billion dollars of investment done by the company. The Investment done by the
company by the Mid-American Energy Company was done through a mix of debt and equity
purchase for the company. The Parent company for the Pacific Corp was the Scottish Power plc.
Via the mix of cash investment, which was around 5.1 million dollars, and through debt 4.3
billion dollars via the debt approach (Fernandez 2015). The total investment was broken down in
a manner, which was compatible with the principle and guidelines of investment. The Bid for
Pacifi Corp was done by the Mid Energy Holding Company Ltd on the base of the fact that the
Berkshire Hathaway was sitting on a large amount of Cash and Cash Equivalents. The same was
⊘ This is a preview!⊘
Do you want full access?
Subscribe today to unlock all pages.
Trusted by 1+ million students worldwide
6WARREN E BUFFET
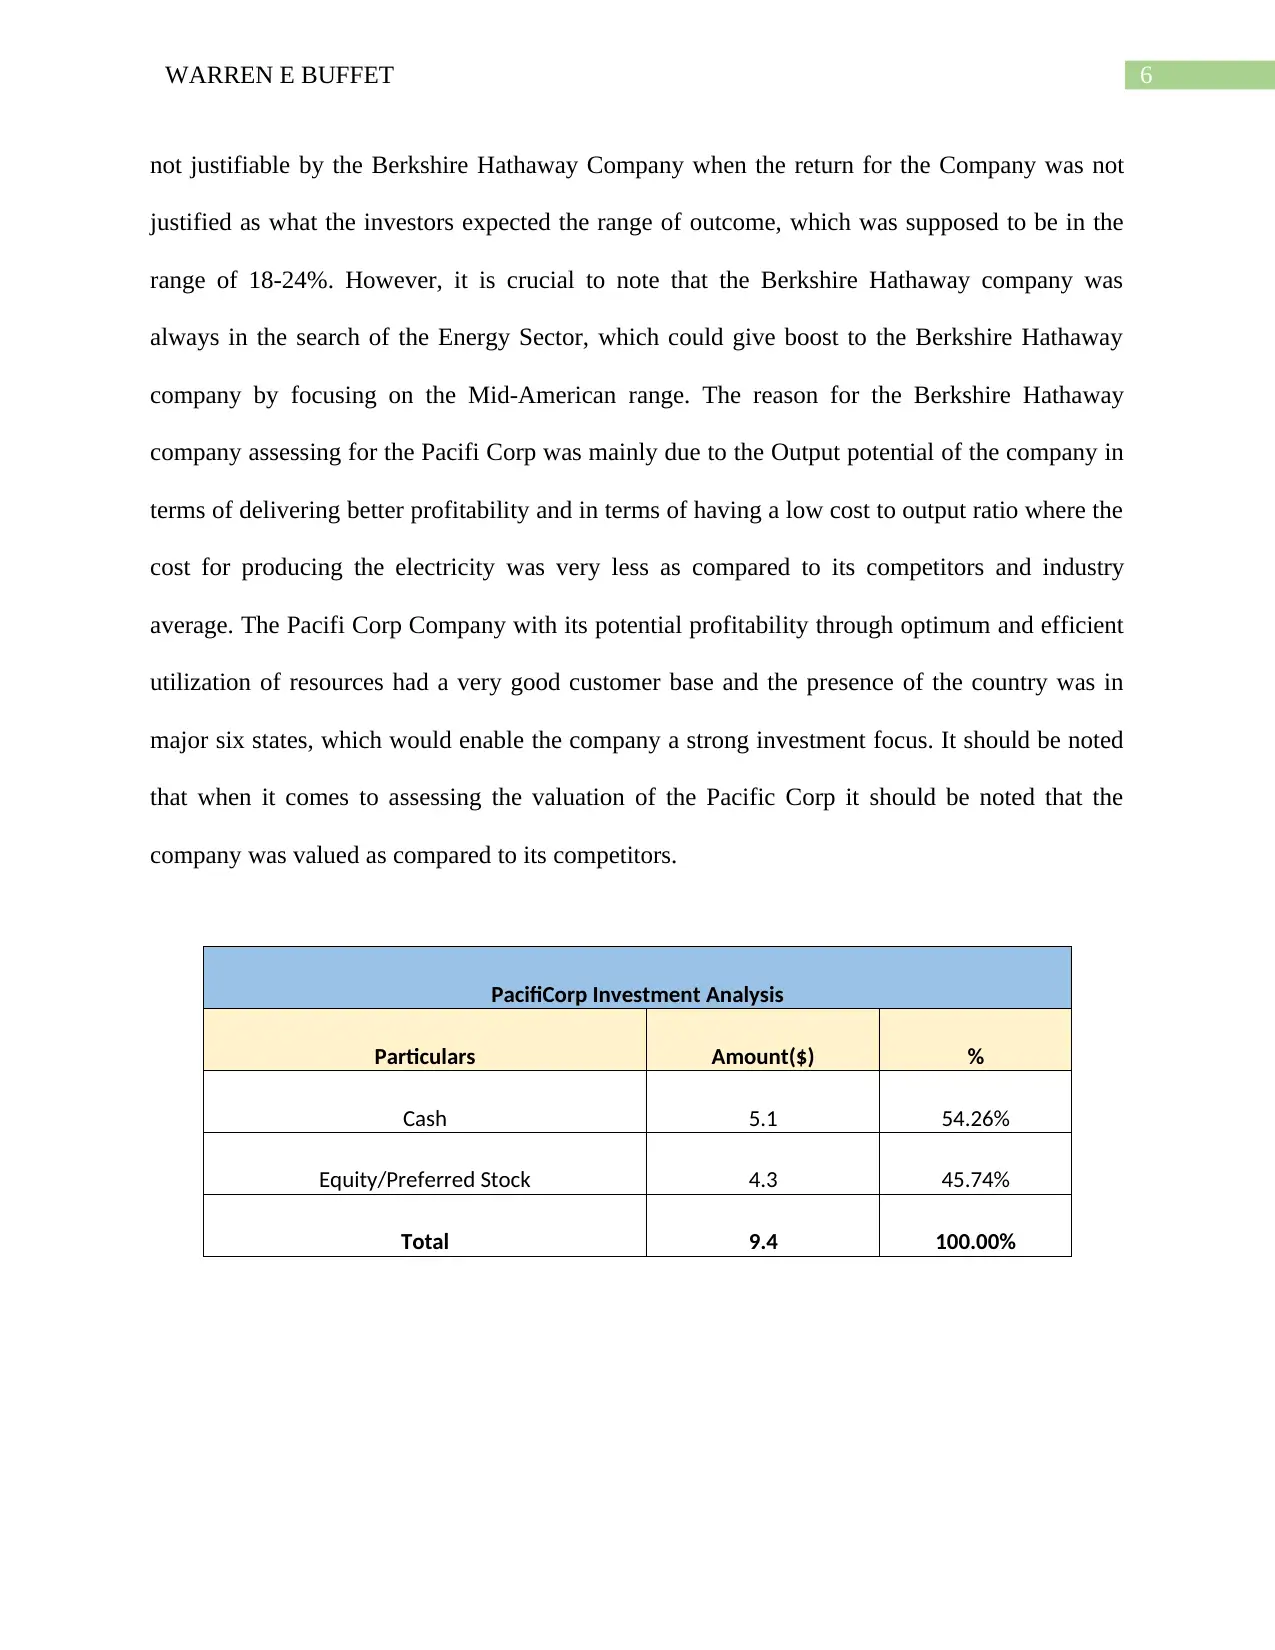
not justifiable by the Berkshire Hathaway Company when the return for the Company was not
justified as what the investors expected the range of outcome, which was supposed to be in the
range of 18-24%. However, it is crucial to note that the Berkshire Hathaway company was
always in the search of the Energy Sector, which could give boost to the Berkshire Hathaway
company by focusing on the Mid-American range. The reason for the Berkshire Hathaway
company assessing for the Pacifi Corp was mainly due to the Output potential of the company in
terms of delivering better profitability and in terms of having a low cost to output ratio where the
cost for producing the electricity was very less as compared to its competitors and industry
average. The Pacifi Corp Company with its potential profitability through optimum and efficient
utilization of resources had a very good customer base and the presence of the country was in
major six states, which would enable the company a strong investment focus. It should be noted
that when it comes to assessing the valuation of the Pacific Corp it should be noted that the
company was valued as compared to its competitors.
PacifiCorp Investment Analysis
Particulars Amount($) %
Cash 5.1 54.26%
Equity/Preferred Stock 4.3 45.74%
Total 9.4 100.00%
Paraphrase This Document
Need a fresh take? Get an instant paraphrase of this document with our AI Paraphraser
7WARREN E BUFFET
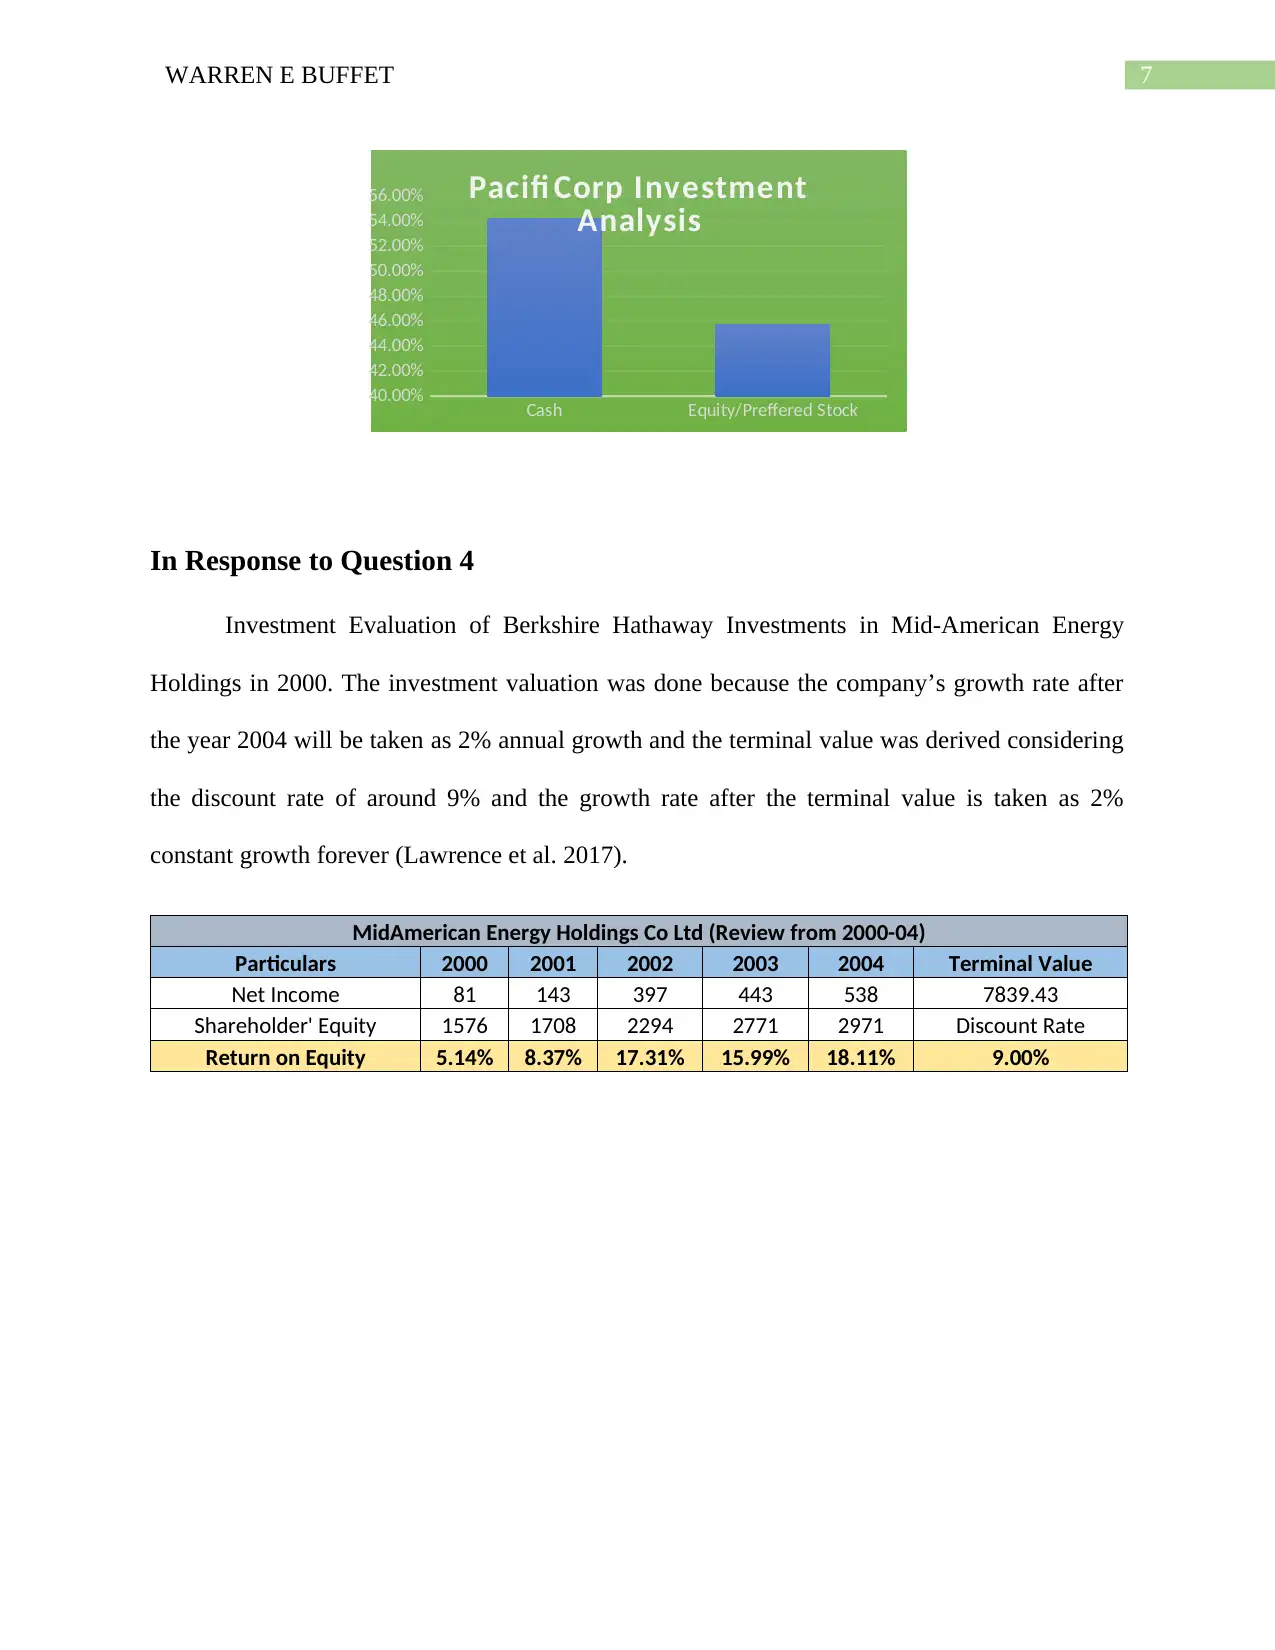
In Response to Question 4
Investment Evaluation of Berkshire Hathaway Investments in Mid-American Energy
Holdings in 2000. The investment valuation was done because the company’s growth rate after
the year 2004 will be taken as 2% annual growth and the terminal value was derived considering
the discount rate of around 9% and the growth rate after the terminal value is taken as 2%
constant growth forever (Lawrence et al. 2017).
MidAmerican Energy Holdings Co Ltd (Review from 2000-04)
Particulars 2000 2001 2002 2003 2004 Terminal Value
Net Income 81 143 397 443 538 7839.43
Shareholder' Equity 1576 1708 2294 2771 2971 Discount Rate
Return on Equity 5.14% 8.37% 17.31% 15.99% 18.11% 9.00%
Cash Equity/Preffered Stock
40.00%
42.00%
44.00%
46.00%
48.00%
50.00%
52.00%
54.00%
56.00% Pacifi Corp Investment
Analysis
8WARREN E BUFFET
In Response to Question 5
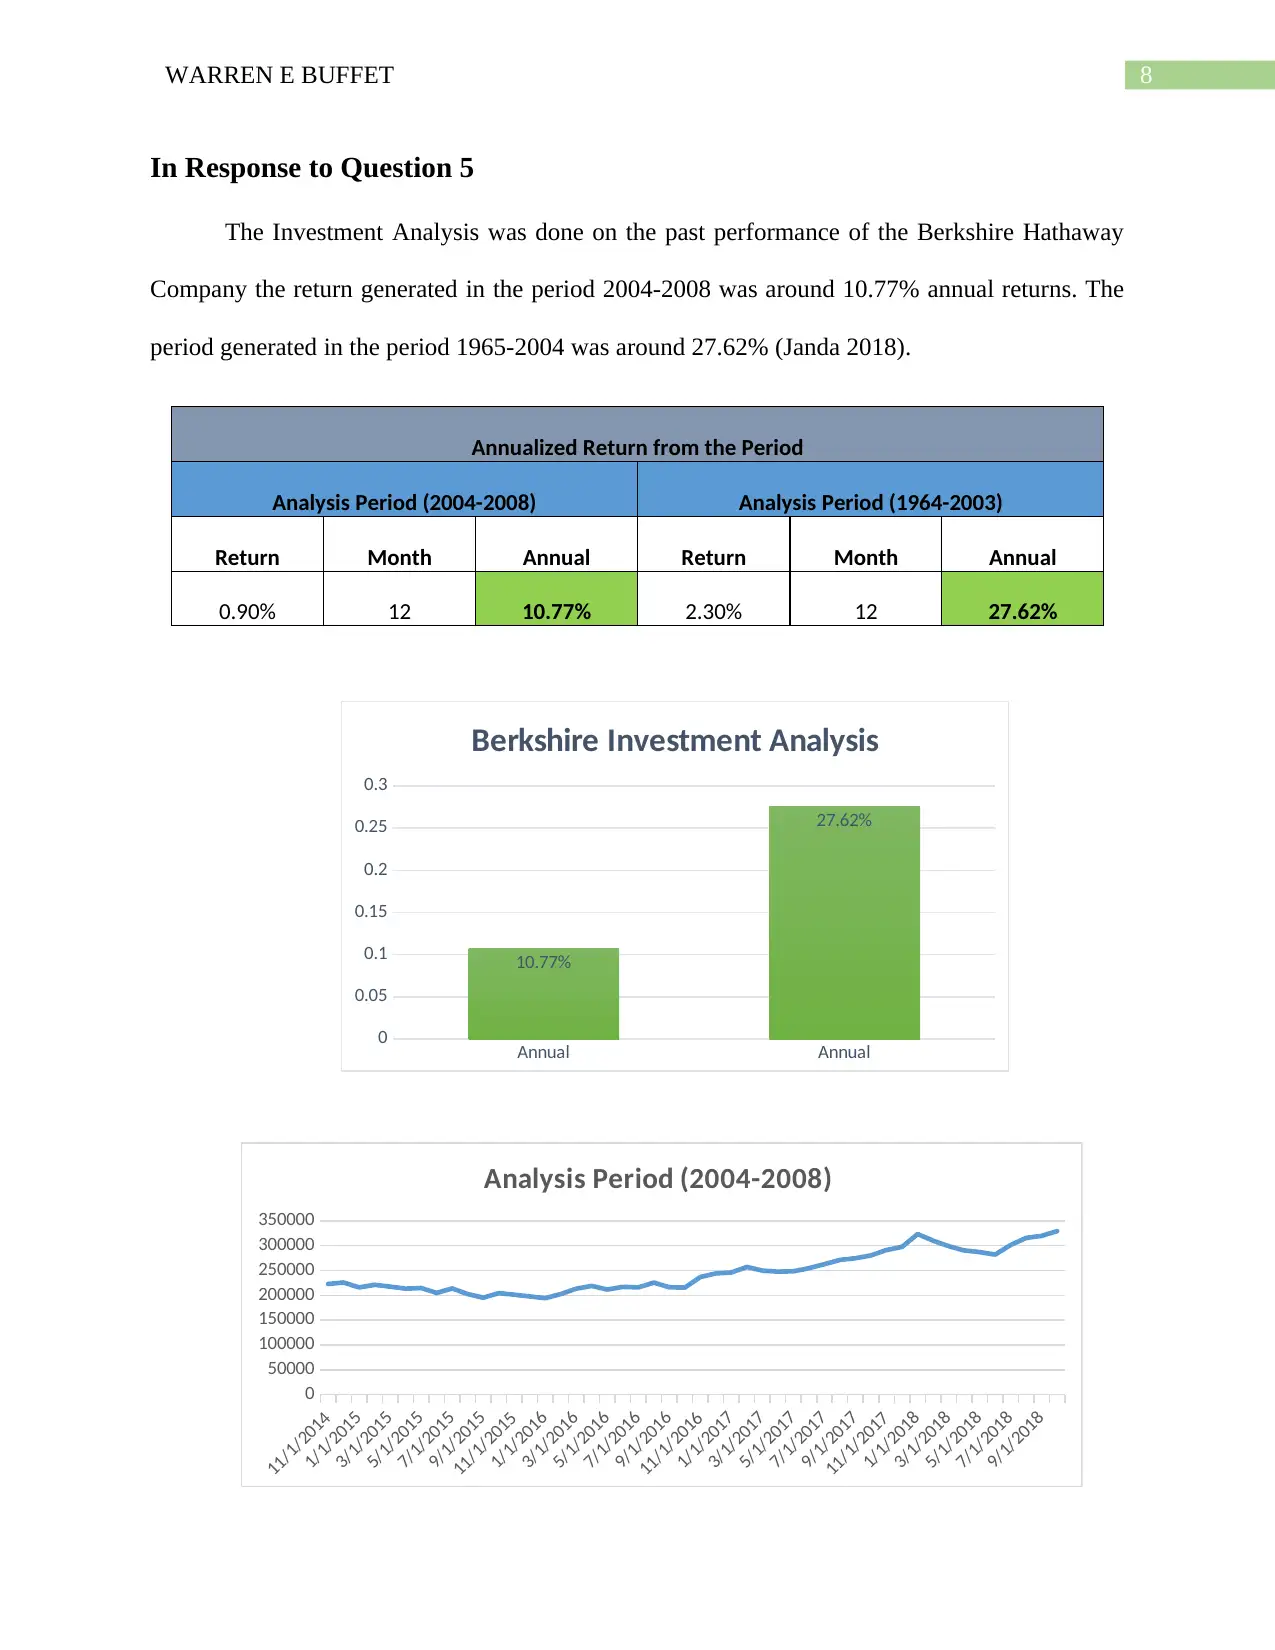
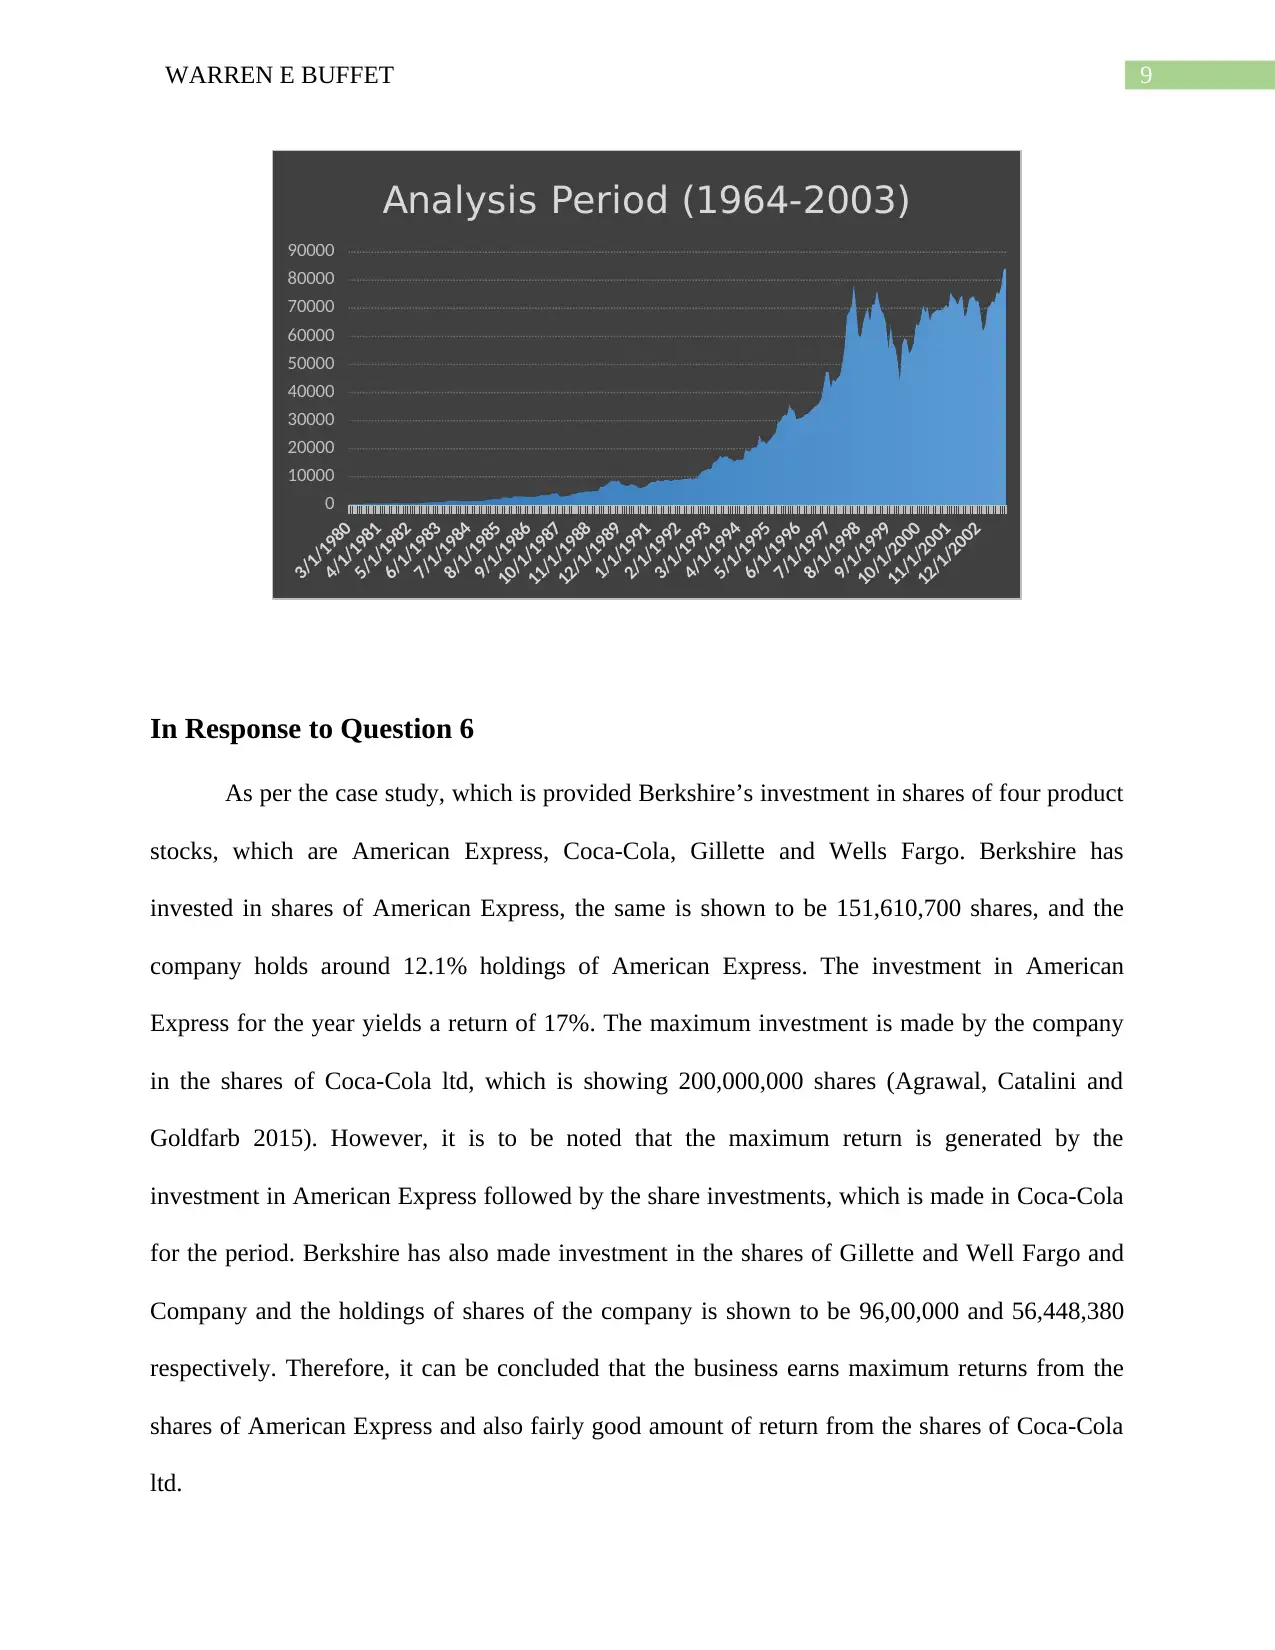
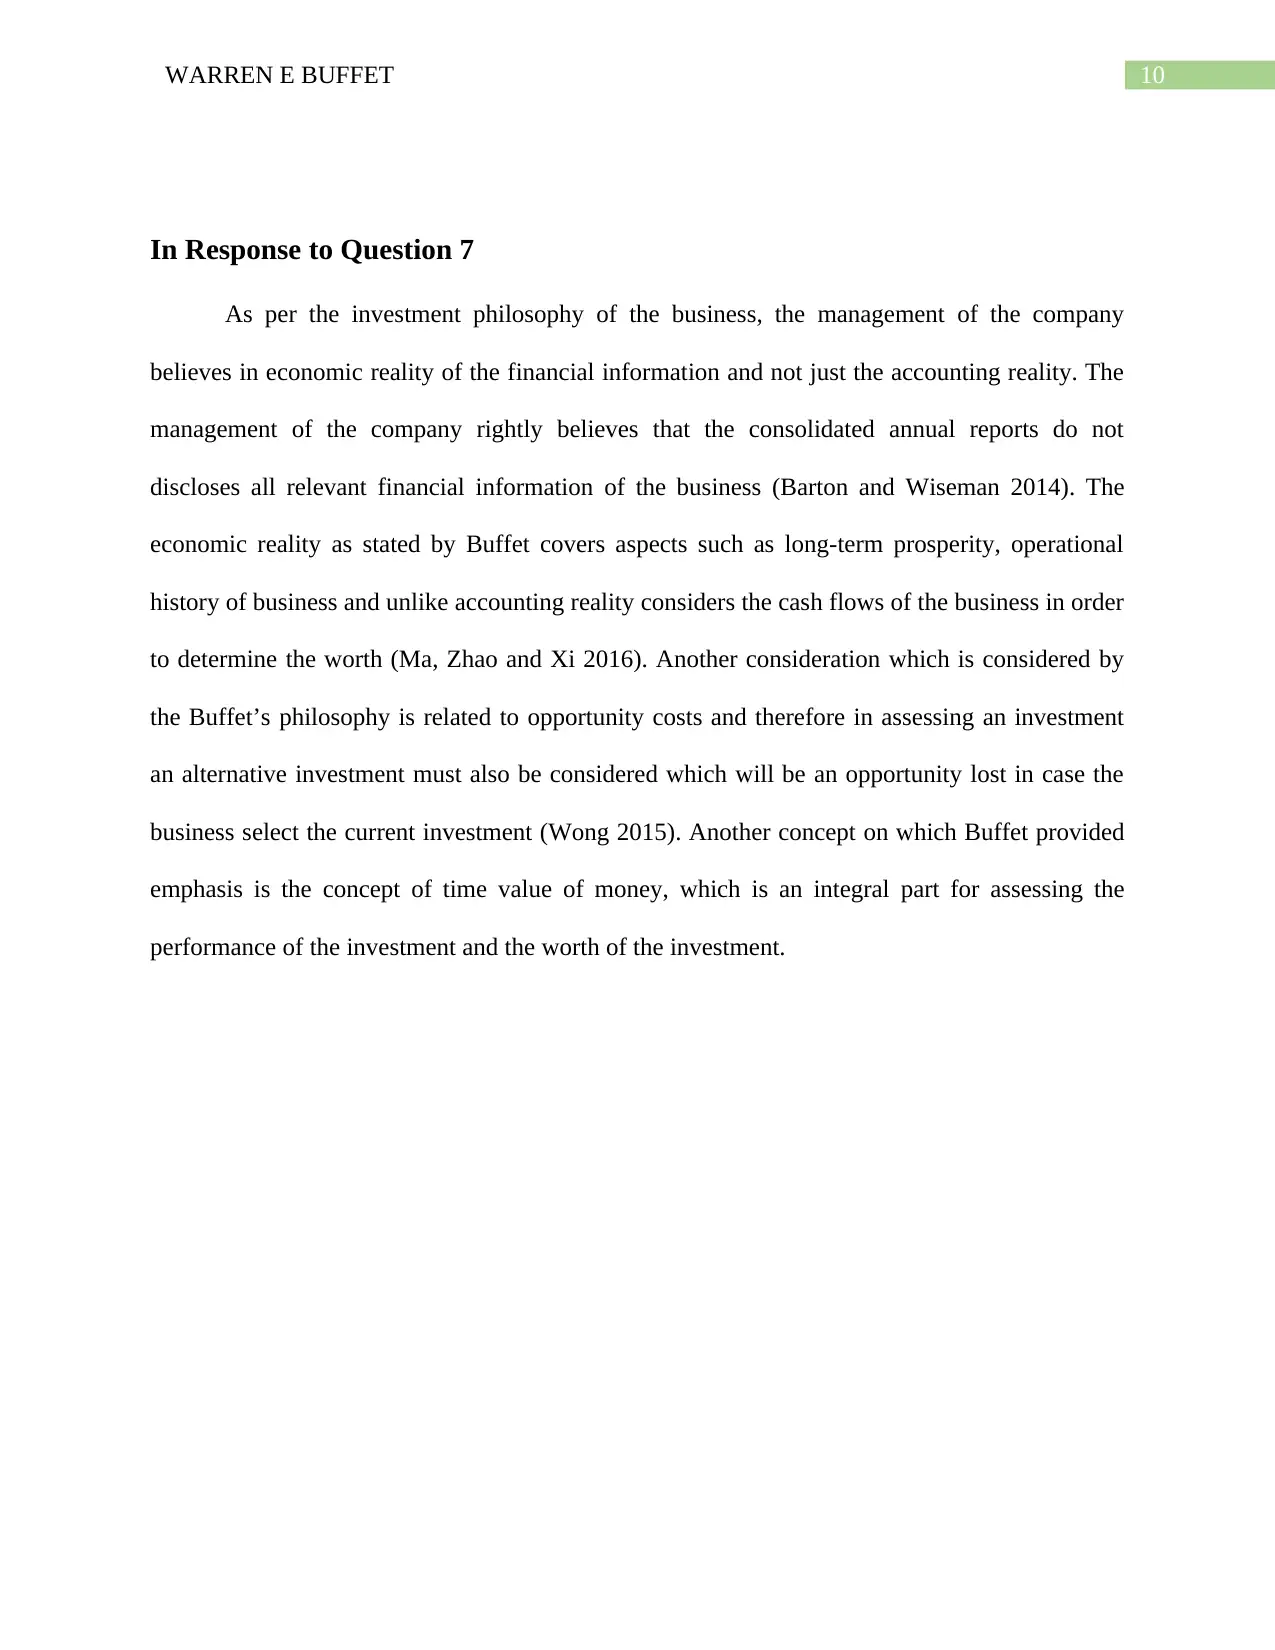
The Investment Analysis was done on the past performance of the Berkshire Hathaway
Company the return generated in the period 2004-2008 was around 10.77% annual returns. The
period generated in the period 1965-2004 was around 27.62% (Janda 2018).
Annualized Return from the Period
Analysis Period (2004-2008) Analysis Period (1964-2003)
Return Month Annual Return Month Annual
0.90% 12 10.77% 2.30% 12 27.62%
Annual Annual
0
0.05
0.1
0.15
0.2
0.25
0.3
10.77%
27.62%
Berkshire Investment Analysis
11/1/2014
1/1/2015
3/1/2015
5/1/2015
7/1/2015
9/1/2015
11/1/2015
1/1/2016
3/1/2016
5/1/2016
7/1/2016
9/1/2016
11/1/2016
1/1/2017
3/1/2017
5/1/2017
7/1/2017
9/1/2017
11/1/2017
1/1/2018
3/1/2018
5/1/2018
7/1/2018
9/1/2018
0
50000
100000
150000
200000
250000
300000
350000
Analysis Period (2004-2008)
In Response to Question 5
The Investment Analysis was done on the past performance of the Berkshire Hathaway
Company the return generated in the period 2004-2008 was around 10.77% annual returns. The
period generated in the period 1965-2004 was around 27.62% (Janda 2018).
Annualized Return from the Period
Analysis Period (2004-2008) Analysis Period (1964-2003)
Return Month Annual Return Month Annual
0.90% 12 10.77% 2.30% 12 27.62%
Annual Annual
0
0.05
0.1
0.15
0.2
0.25
0.3
10.77%
27.62%
Berkshire Investment Analysis
11/1/2014
1/1/2015
3/1/2015
5/1/2015
7/1/2015
9/1/2015
11/1/2015
1/1/2016
3/1/2016
5/1/2016
7/1/2016
9/1/2016
11/1/2016
1/1/2017
3/1/2017
5/1/2017
7/1/2017
9/1/2017
11/1/2017
1/1/2018
3/1/2018
5/1/2018
7/1/2018
9/1/2018
0
50000
100000
150000
200000
250000
300000
350000
Analysis Period (2004-2008)
⊘ This is a preview!⊘
Do you want full access?
Subscribe today to unlock all pages.
Trusted by 1+ million students worldwide
9WARREN E BUFFET
In Response to Question 6
As per the case study, which is provided Berkshire’s investment in shares of four product
stocks, which are American Express, Coca-Cola, Gillette and Wells Fargo. Berkshire has
invested in shares of American Express, the same is shown to be 151,610,700 shares, and the
company holds around 12.1% holdings of American Express. The investment in American
Express for the year yields a return of 17%. The maximum investment is made by the company
in the shares of Coca-Cola ltd, which is showing 200,000,000 shares (Agrawal, Catalini and
Goldfarb 2015). However, it is to be noted that the maximum return is generated by the
investment in American Express followed by the share investments, which is made in Coca-Cola
for the period. Berkshire has also made investment in the shares of Gillette and Well Fargo and
Company and the holdings of shares of the company is shown to be 96,00,000 and 56,448,380
respectively. Therefore, it can be concluded that the business earns maximum returns from the
shares of American Express and also fairly good amount of return from the shares of Coca-Cola
ltd.
3/1/1980
4/1/1981
5/1/1982
6/1/1983
7/1/1984
8/1/1985
9/1/1986
10/1/1987
11/1/1988
12/1/1989
1/1/1991
2/1/1992
3/1/1993
4/1/1994
5/1/1995
6/1/1996
7/1/1997
8/1/1998
9/1/1999
10/1/2000
11/1/2001
12/1/2002
0
10000
20000
30000
40000
50000
60000
70000
80000
90000
Analysis Period (1964-2003)
Paraphrase This Document
Need a fresh take? Get an instant paraphrase of this document with our AI Paraphraser
10WARREN E BUFFET
In Response to Question 7
As per the investment philosophy of the business, the management of the company
believes in economic reality of the financial information and not just the accounting reality. The
management of the company rightly believes that the consolidated annual reports do not
discloses all relevant financial information of the business (Barton and Wiseman 2014). The
economic reality as stated by Buffet covers aspects such as long-term prosperity, operational
history of business and unlike accounting reality considers the cash flows of the business in order
to determine the worth (Ma, Zhao and Xi 2016). Another consideration which is considered by
the Buffet’s philosophy is related to opportunity costs and therefore in assessing an investment
an alternative investment must also be considered which will be an opportunity lost in case the
business select the current investment (Wong 2015). Another concept on which Buffet provided
emphasis is the concept of time value of money, which is an integral part for assessing the
performance of the investment and the worth of the investment.
11WARREN E BUFFET
Reference
Aggarwal, S. and Burgess, E., 2014. Performance-based models to address utility challenges.
The Electricity Journal, 27(6), pp.48-60.
Agrawal, A., Catalini, C. and Goldfarb, A., 2015. Crowdfunding: Geography, social networks,
and the timing of investment decisions. Journal of Economics & Management Strategy, 24(2),
pp.253-274.
Barton, D. and Wiseman, M., 2014. Focusing capital on the long term. Harvard Business
Review, 92(1/2), pp.44-51.
Fernandez, P., 2015. How to value a seasonal company discounting cash flows.
Janda, K., 2018. Earnings Stability and Peer Selection for Indirect Valuation (No. 2018/14).
Charles University Prague, Faculty of Social Sciences, Institute of Economic Studies.
Lawrence, K., de la Hoz, E., Barker, J. and Waldrip, J., 2017. Principal Aquatic Scientist.
Lenhart, S., Nelson-Marsh, N., Wilson, E.J. and Solan, D., 2016. Electricity governance and the
Western energy imbalance market in the United States: The necessity of interorganizational
collaboration. Energy Research & Social Science, 19, pp.94-107.
Ma, Y., Zhao, Q. and Xi, M., 2016. Decision-makings in safety investment: an opportunity cost
perspective. Safety science, 83, pp.31-39.
Peterson, C.E. and Malko, J.R., 2015. Ring Fencing Rocky Mountain Power in Utah. The
Electricity Journal, 28(6), pp.63-71.
⊘ This is a preview!⊘
Do you want full access?
Subscribe today to unlock all pages.
Trusted by 1+ million students worldwide
1 out of 20


Your All-in-One AI-Powered Toolkit for Academic Success.
+13062052269
info@desklib.com
Available 24*7 on WhatsApp / Email
![[object Object]](/_next/static/media/star-bottom.7253800d.svg)
Unlock your academic potential
Copyright © 2020–2026 A2Z Services. All Rights Reserved. Developed and managed by ZUCOL.