Analysis of Financial Performance for Bertie Plc: A Detailed Report
VerifiedAdded on 2019/12/04
|11
|3431
|131
Report
AI Summary
This report provides a comprehensive financial analysis of Bertie Plc, a food and grocery company. It begins with an interpretation of the profit or loss account, analyzing profitability, efficiency, liquidity, and solvency ratios to assess the company's performance in 2014 and 2015. The analysis highlights declining gross and net margins, and reduced ROCE, indicating operational challenges. The report then examines the statement of cash flows, detailing operating, investing, and financing activities, and explaining the impact of non-cash transactions. Part 2 focuses on investment appraisal, including management forecasts, payback period, accounting rate of return, and net present value to evaluate a potential capital project, specifically the US expansion. The report concludes with a professional assessment of Bertie Plc's financial position and investment prospects, offering insights into its operational and financial strategies.

ACCOUNTING AND
DECISION-MAKING
1
DECISION-MAKING
1
Paraphrase This Document
Need a fresh take? Get an instant paraphrase of this document with our AI Paraphraser
Table of Contents
INTRODUCTION ...............................................................................................................................4
PART 1 BUSINESS PERFORMANCE ANALYSIS ..........................................................................4
Interpretation of profit or loss account............................................................................................4
Statement of cash flows (SOCF).....................................................................................................6
PART 2 Investment appraisal ..............................................................................................................7
Management forecast.......................................................................................................................7
Pay back period................................................................................................................................7
Accounting rate of return.................................................................................................................8
Net present value.............................................................................................................................8
Sources of internal finance..............................................................................................................9
PART 3 Professional report .................................................................................................................9
CONCLUSION .............................................................................................................................10
References...........................................................................................................................................11
2
INTRODUCTION
Financial accounting is the process of recording, classifying, summarizing and interpreting
the financial business information. It mainly aims at identifying business performance in terms of
profitability, liquidity, efficiency, solvency and cash generating capacity. Bertie Plc is a Food and
grocery company established in the year 1945 in United Kingdom. It sale wide range of household,
food and cloth products through its retail stores and online deliveries in Europe, Asia and US.
Present project report will helps to analyse firm's overall financial performance in different
segments. It will make an in-depth evaluation of its operational as well as financial performance.
Moreover, cash flow statement will be analyse to determine the respective changes in cash balance
at two different balance sheet dates. Along with this, capital budgeting tools will be used to assess
the viability of the capital project for Bertie Plc and take effective decision.
PART 1 BUSINESS PERFORMANCE ANALYSIS
Interpretation of profit or loss account
Profitability ratios:
Gross margin: GM has been declined by 2.13% as it has been moved from 8.44% to 6.31%
in 2015. It is a adverse sign of Bertie Plc's operational performance. The reason behind such
decrease is its GP has been reduced from £5397 to £4089 by 31.98% while revenues has been
slightly increased from £63916 to £64826. Lower increase in revenues compare to cost increased is
the reason behind lower GM. It may be because of political instability, economic fluctuations,
weather conditions, perishable products, fierce competition, price volatility and high fuel costs.
Net margin: It has been reduced from 6.75% to 4.08% by 2.67%, is sign of worst
operational performance. High administrative overheads and lower sales increase are the most
significant reasons behind this lower profitability.
ROCE: It has been reduced from 14.81% to 7.06% almost half of the previous period. High
operating expense, finance costs and lower revenues growth are the reasons for this adverse ROCE.
Efficiency ratios:
Net assets turnover ratios: In the accounting year 2014, net asset turnover ratio of Bertie
Plc is 2.19:1. In comparison to this year, net asset turnover ratio of the firm decreased in 2015 in
which it is 1.73:1. On the basis of this ratio it has been assessed that company fails to make proper
utilization of current assets in 2015. Thus, business organization needs to encourage their workforce
to make effective use of assets in order to generate high level of sales revenue. For this
Payable payment period: On the basis of this ratio payable payment period of the firm
3
⊘ This is a preview!⊘
Do you want full access?
Subscribe today to unlock all pages.
Trusted by 1+ million students worldwide
increased which means that creditors take more time to make payment to the company. This is not
positive for the company because it negatively affects the working capital of the firm. Thus,
company needs to make modification in their credit policy (Hoskin, Fizzell and Cherry, 2014).
Liquidity ratios:
Current ratios: This ratio of Bertie Plc reflects that firm does not enough amount of current
assets to meet the financial obligations. In 2014, current ratio of the firm is .46:1 whereas it is .39:1
in the year of 2015. This aspect clearly shows decreasing trend which is not good sign for the
business organization. Thus, company needs to make control over the expenses and need to make
focus on the maintenance of cash. Current ratio of Bertie Plc is very far from ideal ratio which
is .5:1. Therefore, company needs to make competent strategies and policies which make
contribution in the attainment of organizational goals and objectives (Financial ratio analysis,
2016).
Quick ratios:This ratio represents the current assets which can be easily converted into cash.
Quick ratio of Bertie Plc decreased in the year of 2015 as compared to 2014. Quick ratio of the
firm is .18 in the year of 2015. It reflects that company fails to maintain sufficient amount of quick
current assets which affects the financial capability of the firm. Thus, Bertie Plc needs to make
assessment of the areas of high expenses. Thus, by exerting control over the expenses company is
able to maintain the ideal quick ratio which is .5:1.
On the basis of the above mentioned analysis it has been identifying that liquidity aspect of
Bertie Plc is not sound. Thus, company needs to undertake effectual measures to improve their
liquidity position.
Solvency ratios:
Gearing ratios: This ratio provides deeper insight about the extent to which company has
fulfilled its financial need from debt and equity sources. The given ratios represent that Bertie Plc
had raised its fund by issuing equity rather than debt instrument. In 2015, gearing ratio of the firm is
47.80%, whereas it is 37.11%. This ratio shows that company is highly solvent because it has
fulfilled its financial needs from debt sources rather than equity.
Interest cover: Company's ability in relation to making interest payment decreased in 2015
with the very high pace as compared to 2014. In 2014 interest cover ratio of Bertie Plc is 15.47. On
the contrary to this, it is 3.85 in the year of 2015. Due to the less profitability and liquidity company
is unable to make payment of interest on time. Thus, company needs to enhance its financial
capability which helps them in meeting the interest expenses on time.
Market segment Analysis
4
Paraphrase This Document
Need a fresh take? Get an instant paraphrase of this document with our AI Paraphraser
The financial performance of the US segment is not impressive as compared to other segments. It is
because of the reason that it is a newly opened market. On the other side UK is quite a matured
market for the retail products It is to be noted that its costs has enhanced by 110.83% which is very
higher than the overall costs. The gross margin got improved by 98.02% while the overall expense
for the company got increased by 33.51% only. It is mainly due to hiring staff, payment of rent,
advertising costs and increasing marketing expenditure. US segment is incurring net loss from its
operating activities. This indicates the sign of bad performance. Along with that operating loss got
reduced by 82.40% while the overall operating profits has reduced by 38.68%. T
` his shows that US segment has not been able to perform well. The expenses for property,
plant and equipment have increased by 455.99%. On the other side total expenses had increased by
29.06% only. This shows that huge investment in the fixed assets do not contribute towards
increasing the revenue. Difference between total assets and current liabilities got increased by
426.77%. It happened because of the expansion. In relation to the competition in the US market,
Walmart is the leading supermarket chain that generates more than 50% of the revenue. On constant
basis the company is decreasing the prices on food products for the purpose of gaining high market
share (Innocent, Mary and Matthew, 2013). It has raised the level of competition for the Bertie Plc
US segment. There are mainly three reasons behind why the US segment performance might be
inferior to the other segments. These can be discussed as follows:
· High costs – US is a market with fresh and new in nature. The consumers in the
country are of different taste and preferences. The economy is having different conditions as
compared to the other economies (Marr, 2012). That is the reason the operating costs is very high
for the business. Bertie Plc is required to maintain a high operating costs.
· Poor management - The US market segment is also incurring operating loss due to
ineffective and unskilled management. The experts are required to show their skills and intelligence
so that sales and profitability can be enhanced (Xia, Fei and Liu, 2015).
· High competition- Another reason identified is the high competition from the
Wallmart which is a retail giant. There are many competitive edges possessed by the company.
Statement of cash flows (SOCF)
SOCF combines the cash flow from operating, investing and financing activities with the
5
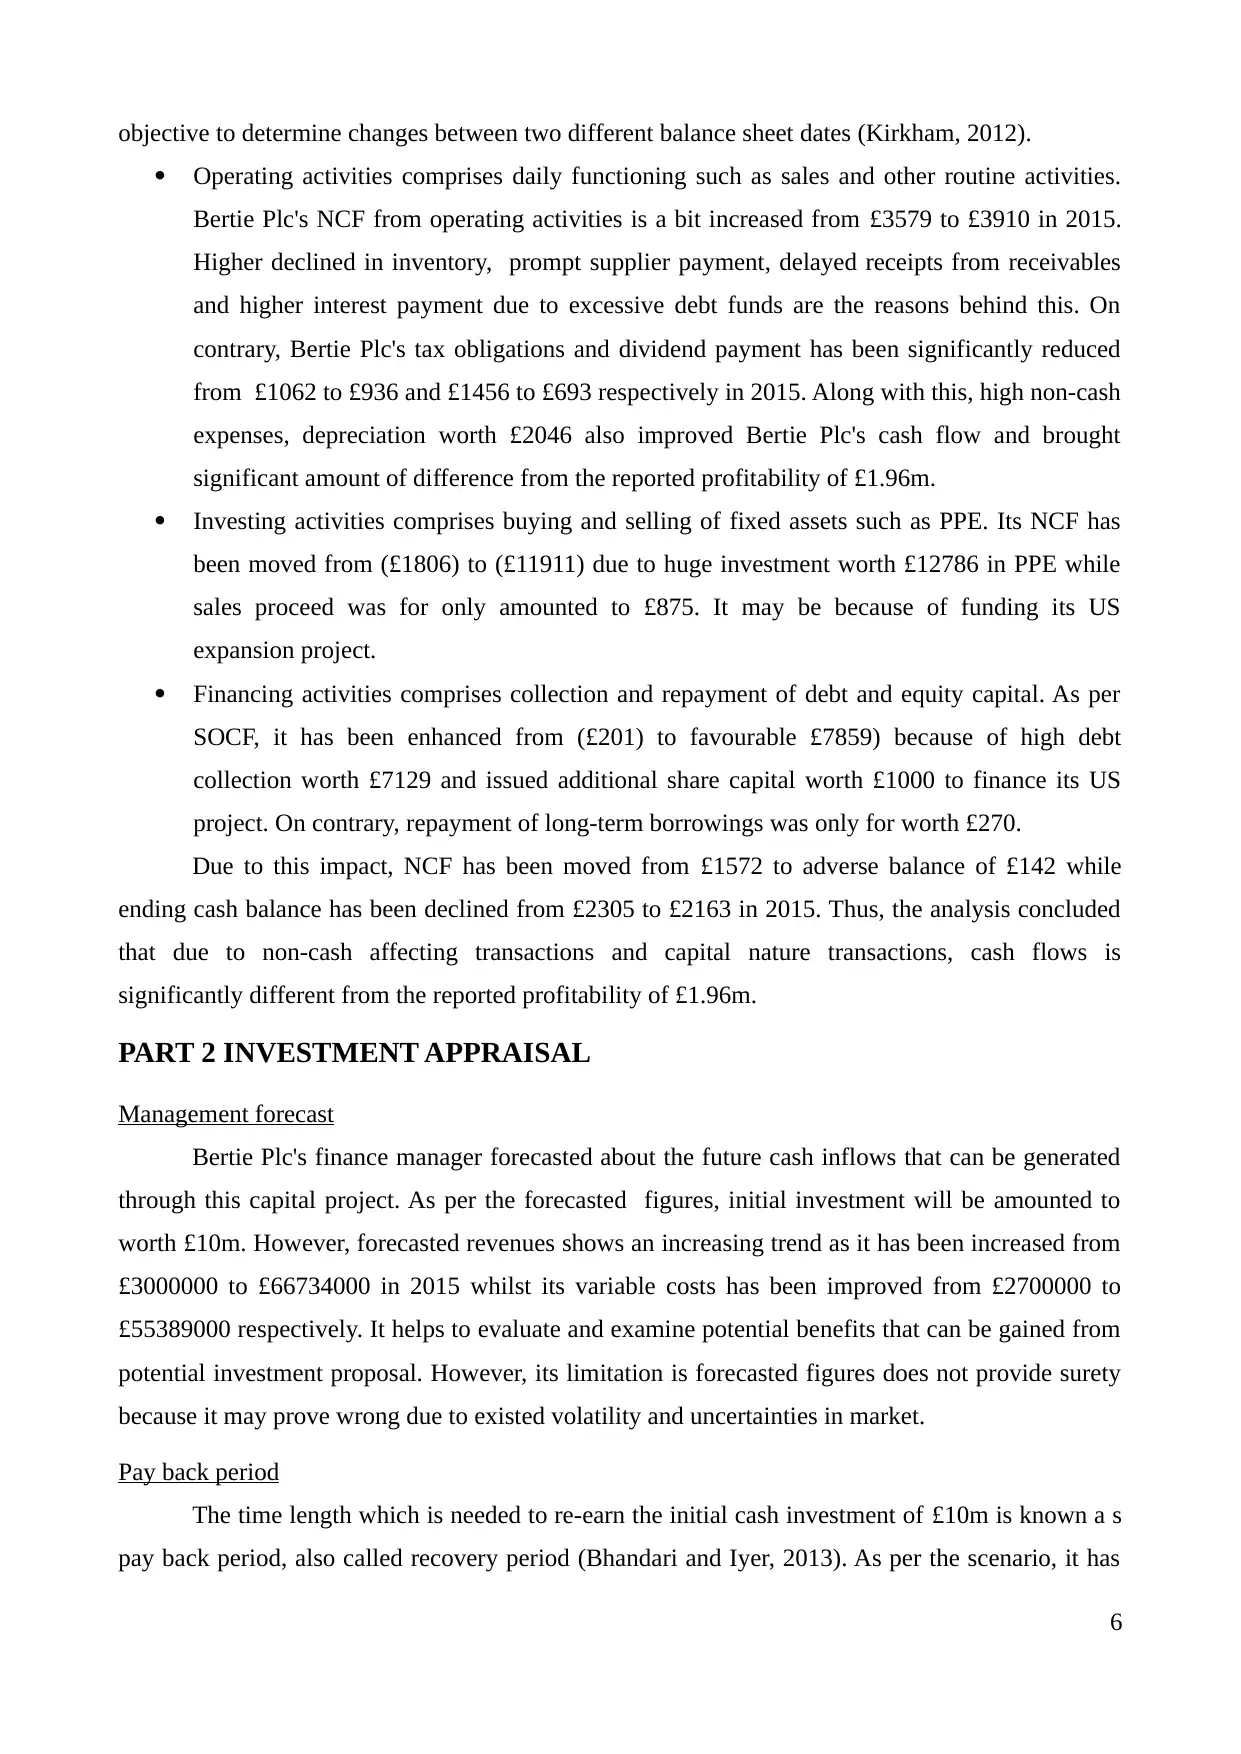
objective to determine changes between two different balance sheet dates (Kirkham, 2012).
· Operating activities comprises daily functioning such as sales and other routine activities.
Bertie Plc's NCF from operating activities is a bit increased from £3579 to £3910 in 2015.
Higher declined in inventory, prompt supplier payment, delayed receipts from receivables
and higher interest payment due to excessive debt funds are the reasons behind this. On
contrary, Bertie Plc's tax obligations and dividend payment has been significantly reduced
from £1062 to £936 and £1456 to £693 respectively in 2015. Along with this, high non-cash
expenses, depreciation worth £2046 also improved Bertie Plc's cash flow and brought
significant amount of difference from the reported profitability of £1.96m.
· Investing activities comprises buying and selling of fixed assets such as PPE. Its NCF has
been moved from (£1806) to (£11911) due to huge investment worth £12786 in PPE while
sales proceed was for only amounted to £875. It may be because of funding its US
expansion project.
· Financing activities comprises collection and repayment of debt and equity capital. As per
SOCF, it has been enhanced from (£201) to favourable £7859) because of high debt
collection worth £7129 and issued additional share capital worth £1000 to finance its US
project. On contrary, repayment of long-term borrowings was only for worth £270.
Due to this impact, NCF has been moved from £1572 to adverse balance of £142 while
ending cash balance has been declined from £2305 to £2163 in 2015. Thus, the analysis concluded
that due to non-cash affecting transactions and capital nature transactions, cash flows is
significantly different from the reported profitability of £1.96m.
PART 2 INVESTMENT APPRAISAL
Management forecast
Bertie Plc's finance manager forecasted about the future cash inflows that can be generated
through this capital project. As per the forecasted figures, initial investment will be amounted to
worth £10m. However, forecasted revenues shows an increasing trend as it has been increased from
£3000000 to £66734000 in 2015 whilst its variable costs has been improved from £2700000 to
£55389000 respectively. It helps to evaluate and examine potential benefits that can be gained from
potential investment proposal. However, its limitation is forecasted figures does not provide surety
because it may prove wrong due to existed volatility and uncertainties in market.
Pay back period
The time length which is needed to re-earn the initial cash investment of £10m is known a s
pay back period, also called recovery period (Bhandari and Iyer, 2013). As per the scenario, it has
6
⊘ This is a preview!⊘
Do you want full access?
Subscribe today to unlock all pages.
Trusted by 1+ million students worldwide
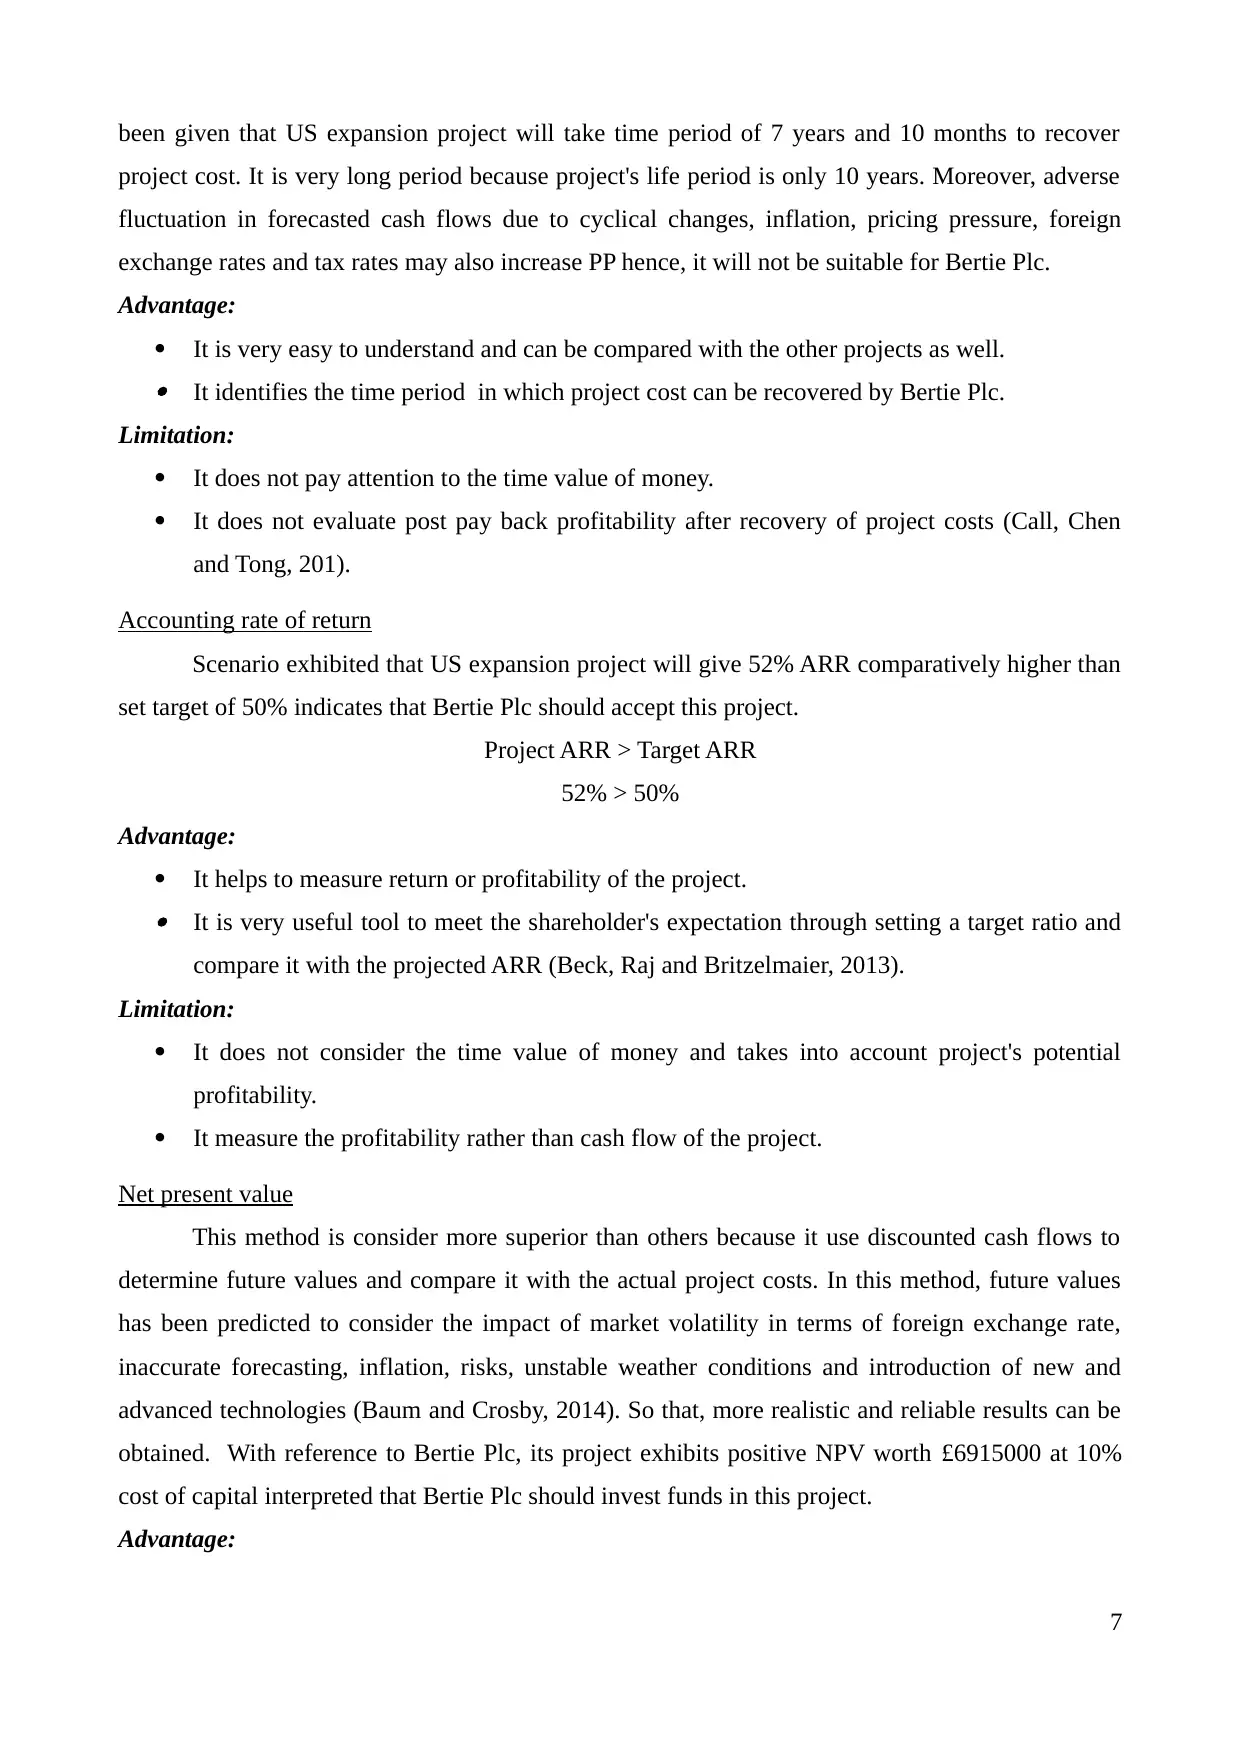
been given that US expansion project will take time period of 7 years and 10 months to recover
project cost. It is very long period because project's life period is only 10 years. Moreover, adverse
fluctuation in forecasted cash flows due to cyclical changes, inflation, pricing pressure, foreign
exchange rates and tax rates may also increase PP hence, it will not be suitable for Bertie Plc.
Advantage:
· It is very easy to understand and can be compared with the other projects as well.· It identifies the time period in which project cost can be recovered by Bertie Plc.
Limitation:
· It does not pay attention to the time value of money.
· It does not evaluate post pay back profitability after recovery of project costs (Call, Chen
and Tong, 201).
Accounting rate of return
Scenario exhibited that US expansion project will give 52% ARR comparatively higher than
set target of 50% indicates that Bertie Plc should accept this project.
Project ARR > Target ARR
52% > 50%
Advantage:
· It helps to measure return or profitability of the project.· It is very useful tool to meet the shareholder's expectation through setting a target ratio and
compare it with the projected ARR (Beck, Raj and Britzelmaier, 2013).
Limitation:
· It does not consider the time value of money and takes into account project's potential
profitability.
· It measure the profitability rather than cash flow of the project.
Net present value
This method is consider more superior than others because it use discounted cash flows to
determine future values and compare it with the actual project costs. In this method, future values
has been predicted to consider the impact of market volatility in terms of foreign exchange rate,
inaccurate forecasting, inflation, risks, unstable weather conditions and introduction of new and
advanced technologies (Baum and Crosby, 2014). So that, more realistic and reliable results can be
obtained. With reference to Bertie Plc, its project exhibits positive NPV worth £6915000 at 10%
cost of capital interpreted that Bertie Plc should invest funds in this project.
Advantage:
7
Paraphrase This Document
Need a fresh take? Get an instant paraphrase of this document with our AI Paraphraser
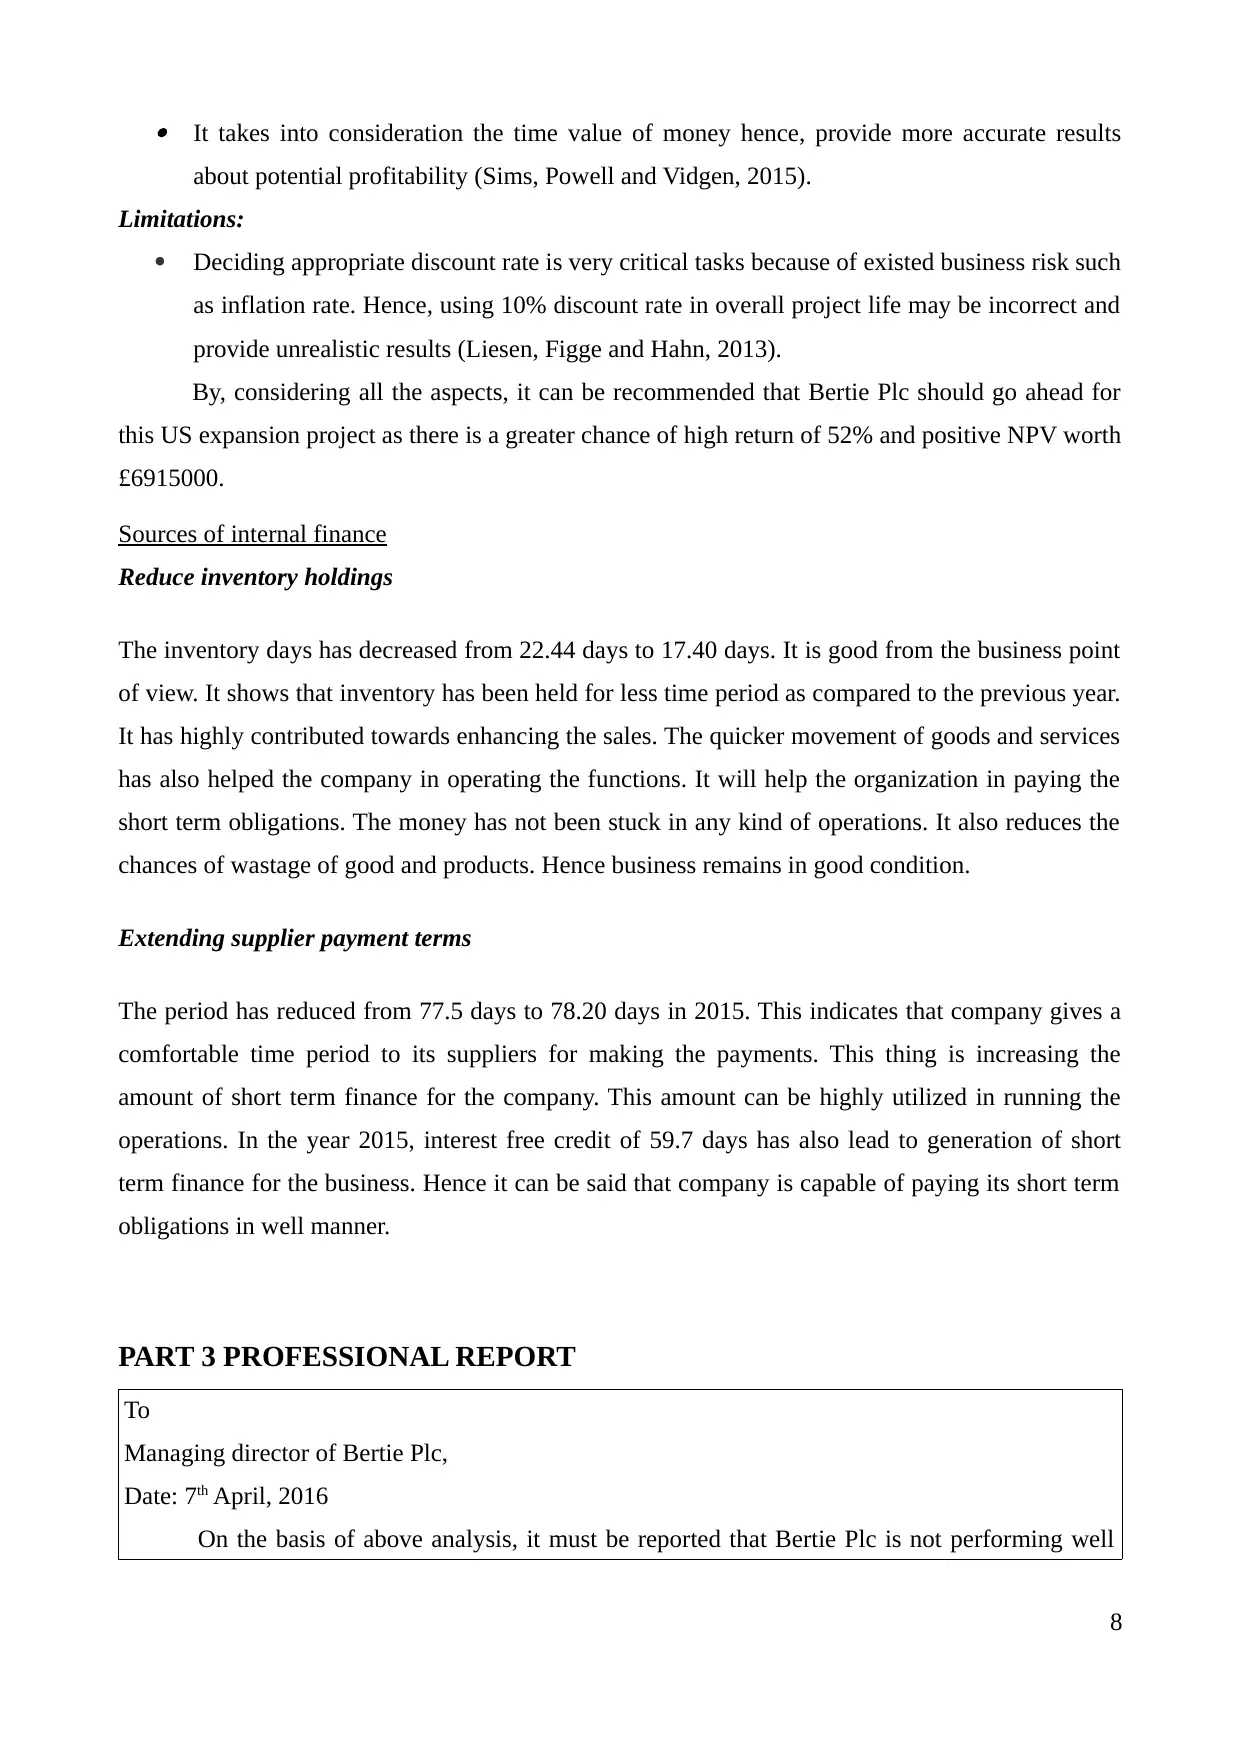
· It takes into consideration the time value of money hence, provide more accurate results
about potential profitability (Sims, Powell and Vidgen, 2015).
Limitations:
· Deciding appropriate discount rate is very critical tasks because of existed business risk such
as inflation rate. Hence, using 10% discount rate in overall project life may be incorrect and
provide unrealistic results (Liesen, Figge and Hahn, 2013).
By, considering all the aspects, it can be recommended that Bertie Plc should go ahead for
this US expansion project as there is a greater chance of high return of 52% and positive NPV worth
£6915000.
Sources of internal finance
Reduce inventory holdings
The inventory days has decreased from 22.44 days to 17.40 days. It is good from the business point
of view. It shows that inventory has been held for less time period as compared to the previous year.
It has highly contributed towards enhancing the sales. The quicker movement of goods and services
has also helped the company in operating the functions. It will help the organization in paying the
short term obligations. The money has not been stuck in any kind of operations. It also reduces the
chances of wastage of good and products. Hence business remains in good condition.
Extending supplier payment terms
The period has reduced from 77.5 days to 78.20 days in 2015. This indicates that company gives a
comfortable time period to its suppliers for making the payments. This thing is increasing the
amount of short term finance for the company. This amount can be highly utilized in running the
operations. In the year 2015, interest free credit of 59.7 days has also lead to generation of short
term finance for the business. Hence it can be said that company is capable of paying its short term
obligations in well manner.
PART 3 PROFESSIONAL REPORT
To
Managing director of Bertie Plc,
Date: 7th April, 2016
On the basis of above analysis, it must be reported that Bertie Plc is not performing well
8
because of declined revenues, profitability, liquidity, cash generating capacity and debt bearing
capacity. Thus, it should pay focus on this key issues and take decisions to enhance its revenues
and profits as well. Moreover, excessive borrowings also results in high financial risk while debt
bearing capacity has been significantly reduced due to lower profitability. On the other hand,
declined liquidity ratios concluded that Bertie Plc is not able to pay off their short term business
liabilities effectively and efficiently. Henceforth, it must be reported that management should
frame competent policies and strategic decisions to enhance its future performance and run
business successfully.
CONCLUSION
Present project report concluded that Bertie Plc not performed well in 2015 because of
declined profitability, liquidity, cash generating capacity and debt bearing capacity. It concluded that
Bertie Plc management should take decisions and make strategic policies to improve their future
performance. It will lead to bring high success and growth in the forthcoming period. However,
investment appraisal tools concluded that bertie Plc should accept its US expansion project because
it will provide greater profitability return and NPV helps to fulfil investor's expectation effectively.
Through this, firm will be able to enlarge its potential revenues and profitability helps to enhance
financial business performance.
9
⊘ This is a preview!⊘
Do you want full access?
Subscribe today to unlock all pages.
Trusted by 1+ million students worldwide
REFERENCES
Books and Journals
Baum, A.E. and Crosby, N., 2014. Property investment appraisal. John Wiley & Sons.
Beck, V., Raj, R. and Britzelmaier, B., 2013. The effects of capital investment appraisal methods in
automotive companies. International Journal of Sales, Retailing and Marketing. 2. pp. 3-12.
Bhandari, S.B. and Iyer, R., 2013. Predicting business failure using cash flow statement based
measures. Managerial Finance. 39(7). pp. 667-676.
Call, A.C., Chen, S. and Tong, Y.H., 2013. Are analysts' cash flow forecasts naïve extensions of
their own earnings forecasts?. Contemporary Accounting Research. 30(2). pp. 438-465.
Hoskin, R.E., Fizzell, M.R. and Cherry, D.C., 2014. Financial accounting: a user perspective.
Wiley Global Education.
Innocent, E.C., Mary, O.I. and Matthew, O.M., 2013. Financial ratio analysis as a determinant of
profitability in Nigerian pharmaceutical industry. International journal of business and
management. 8(8). p. 107.
Kirkham, R., 2012. Liquidity analysis using cash flow ratios and traditional ratios: the
telecommunications sector in Australia. The Journal of New Business Ideas & Trends. 10(1).
p. 1.
Liesen, A., Figge, F. and Hahn, T., 2013. Net present sustainable value: a new approach to
sustainable investment appraisal. Strategic Change. 22(3‐4). pp. 175-189.
Marr, B., 2012. Key performance indicators: The 75 measures every manager needs to know.
Pearson Financial Times Pub..
Sims, J., Powell, P. and Vidgen, R., 2015. Investment appraisal and evaluation: preserving tacit
knowledge and competitive advantage. International Journal of Business and Systems
Research. 9(1). pp. 86-103.
Xia, D.F., Fei, W.Y. and Liu, H.J., 2015. Estimating the shareholder’s terminal payoff based on
insurer’s solvency ratio in mixed fractional Brownian market. Applied Mathematics-A
Journal of Chinese Universities. 30(3). pp. 317-324.
Online
Financial ratio analysis, 2016. [Pdf]. Available through:
<http://educ.jmu.edu/~drakepp/principles/module2/fin_rat.pdf>. [Accessed on 7th April, 2016].
10
Paraphrase This Document
Need a fresh take? Get an instant paraphrase of this document with our AI Paraphraser

11
1 out of 11
Related Documents


Your All-in-One AI-Powered Toolkit for Academic Success.
+13062052269
info@desklib.com
Available 24*7 on WhatsApp / Email
![[object Object]](/_next/static/media/star-bottom.7253800d.svg)
Unlock your academic potential
Copyright © 2020–2026 A2Z Services. All Rights Reserved. Developed and managed by ZUCOL.