Accounting and Decision Making Report: Bertie Plc Performance Analysis
VerifiedAdded on 2019/12/03
|11
|3061
|140
Report
AI Summary
This report presents a comprehensive financial analysis of Bertie Plc, a UK-based food and grocery company. It begins with an introduction to accounting's role in business decision-making and provides an overview of Bertie Plc's operations. Part 1 focuses on business performance analysis, including the interpretation of profit and loss statements, market segment analysis (specifically comparing the UK and US markets), cash flow statements, and an assessment of liquidity and solvency. Part 2 delves into investment appraisal techniques, examining payback period, accounting rate of return (ARR), and net present value (NPV). The report evaluates the feasibility of a project based on these metrics. Part 3 presents a formal business report structure, and the conclusion summarizes the key findings, highlighting the company's financial performance and investment decisions. The report uses financial ratios to evaluate the company's performance. Finally, the report provides recommendations for improving Bertie Plc's profitability and financial health.
ACCOUNTING AND
DECISIOSN MAIKNG
DECISIOSN MAIKNG
Paraphrase This Document
Need a fresh take? Get an instant paraphrase of this document with our AI Paraphraser
TABLE OF CONTENTS
Introduction......................................................................................................................................3
Part 1................................................................................................................................................3
Business performance analysis...............................................................................................3
Interpretation of profit and loss statements............................................................................3
Market Segment Analysis.......................................................................................................4
Cash flow statements..............................................................................................................5
Liquidity and Working Capital...............................................................................................5
Solvency.................................................................................................................................6
Part 2: Investment appraisal.............................................................................................................6
Sources of internal finance.....................................................................................................8
Part 3: Formal business report.........................................................................................................8
Conclusion.....................................................................................................................................10
References......................................................................................................................................11
INDEX OF TABLES
Table 1: Analysis of firm cash flow.................................................................................................4
Introduction
Accounting of all the business transactions plays a very important role in identifying the
business results. Moreover, it helps the managers to take effective business decisions. Bertie Plc
is UK food and Grocery Company that established in the year 1945 that operates in distinct part
over the world. It mainly operates in Europe, Asia and US through selling food, clothes and other
household products. The present report will helps in analyzing the business performance through
its financial statements. Further, distinct types of investment appraisal techniques that help to
taking effective investment decisions will also discuss in this report.
Part 1
Business performance analysis
Different types of statements can be analyzed for assessing the business performance that
is explained here as under:
Interpretation of profit and loss statements
Income statement is prepared to determine business operational result in terms of profit
or loss. It includes the business trading transactions and other direct as well as indirect expenses.
Profitability ratio helps to interpreting the profits or loss of Bertie plc Company.
Gross profit ratio: It is concerned with calculating the percentage of gross profit on total
business sales (Gross profit ratio. 2015). In the year 2014, the gross profit ratio was
8.44% decreased to 6.31% in the following year. The reason behind such decreases is that
Bertie plc sales declined by 1.4% from 63916£ to 64826£. Moreover, the company cost
of sales gets increased by 3.79% higher than percentage decrease in sales. Therefore, it
should be advised that business has to improve its profitability through increasing the
revenue and decrease in cost.
Net profit ratio: In the year 2014, Bertie Plc net margin was 6.75% get declined to
4.08% in next year. The reason behind such decreases is the administration cost and gross
profit of the company gets inclined. Further, finance cost of the company also gets
increased to 687£. Therefore, it can be said that operational performance of the business
gets declined over the period. Thus, Bertie Plc Company should incline the sales and
reduce its expenditures so as to get better operational results. It can be done through
providing better quality of services at reasonable rates.
⊘ This is a preview!⊘
Do you want full access?
Subscribe today to unlock all pages.
Trusted by 1+ million students worldwide
Return on capital employed: In the year 2014 ROCE was 14.81% get declined to 7.06%
in the year 2015. It is because of decreased net profits of the company. Further, the
capital employed in the business get inclined from 29148£ to 37505£. It gets increased by
28.67% in the year 2015.
On the basis of above information it can be said that Bertie Plc business performance gets
declined in the year 2015. Therefore, company should increase its revenues and reduce its
expenditures so as to improve its profitability.
Market Segment Analysis
Along with the UK market, Bertie Plc Company operates in US market also. The
performance of the US segment can be analyzed with the other segments through different
factors. The US Segments operational results are not very good then compare to the other
business segments. The three important reasons for such analysis are explained here as under:
Fierce competition: The level of competition impacts the business performance to a
great extent (Brealey, 2012). In US market various opportunities are available to the retail
sector companies. Thus, it attract new entrants into the market create higher level of
competition. The company is facing competition from other strong companies such as
Walmart. It is a US leading company in food and retail sectors. Therefore it is important
for the company to compete from its competitors very effectively. They compete for
grab larger the market share through increasing its revenues.
Decreasing the net margin: The US segments sales increased from 1392£ to 2946£ and
cost of sales get inclined to 1348£ to 2842£. The business sales and cost of sales get
inclined by 110.83% and 111.638%. Therefore, the profitability of the company shows a
little increase from 3.16% to 3.53%. However, the company is having negative net profits
because of higher the expenses from 152£ to 301£. However, the rest of the world gross
profit and net profits are 9.09% and 6.12% in the year 2015. Thus, it is also a reason for
lowering the business performance.
Assets and Liabilities: The excess of US commercial property for sales results in falling
the prices (Petersen, 2009). For instance, Bertie plc property worth £10.25m disposed
only at £4.5m.Further, the excess of current liabilities to the current assets also is a reason
for worst business performance. Therefore, it should be recommended that Bertie Plc has
to improve its current assets through making effective business planning.
Paraphrase This Document
Need a fresh take? Get an instant paraphrase of this document with our AI Paraphraser
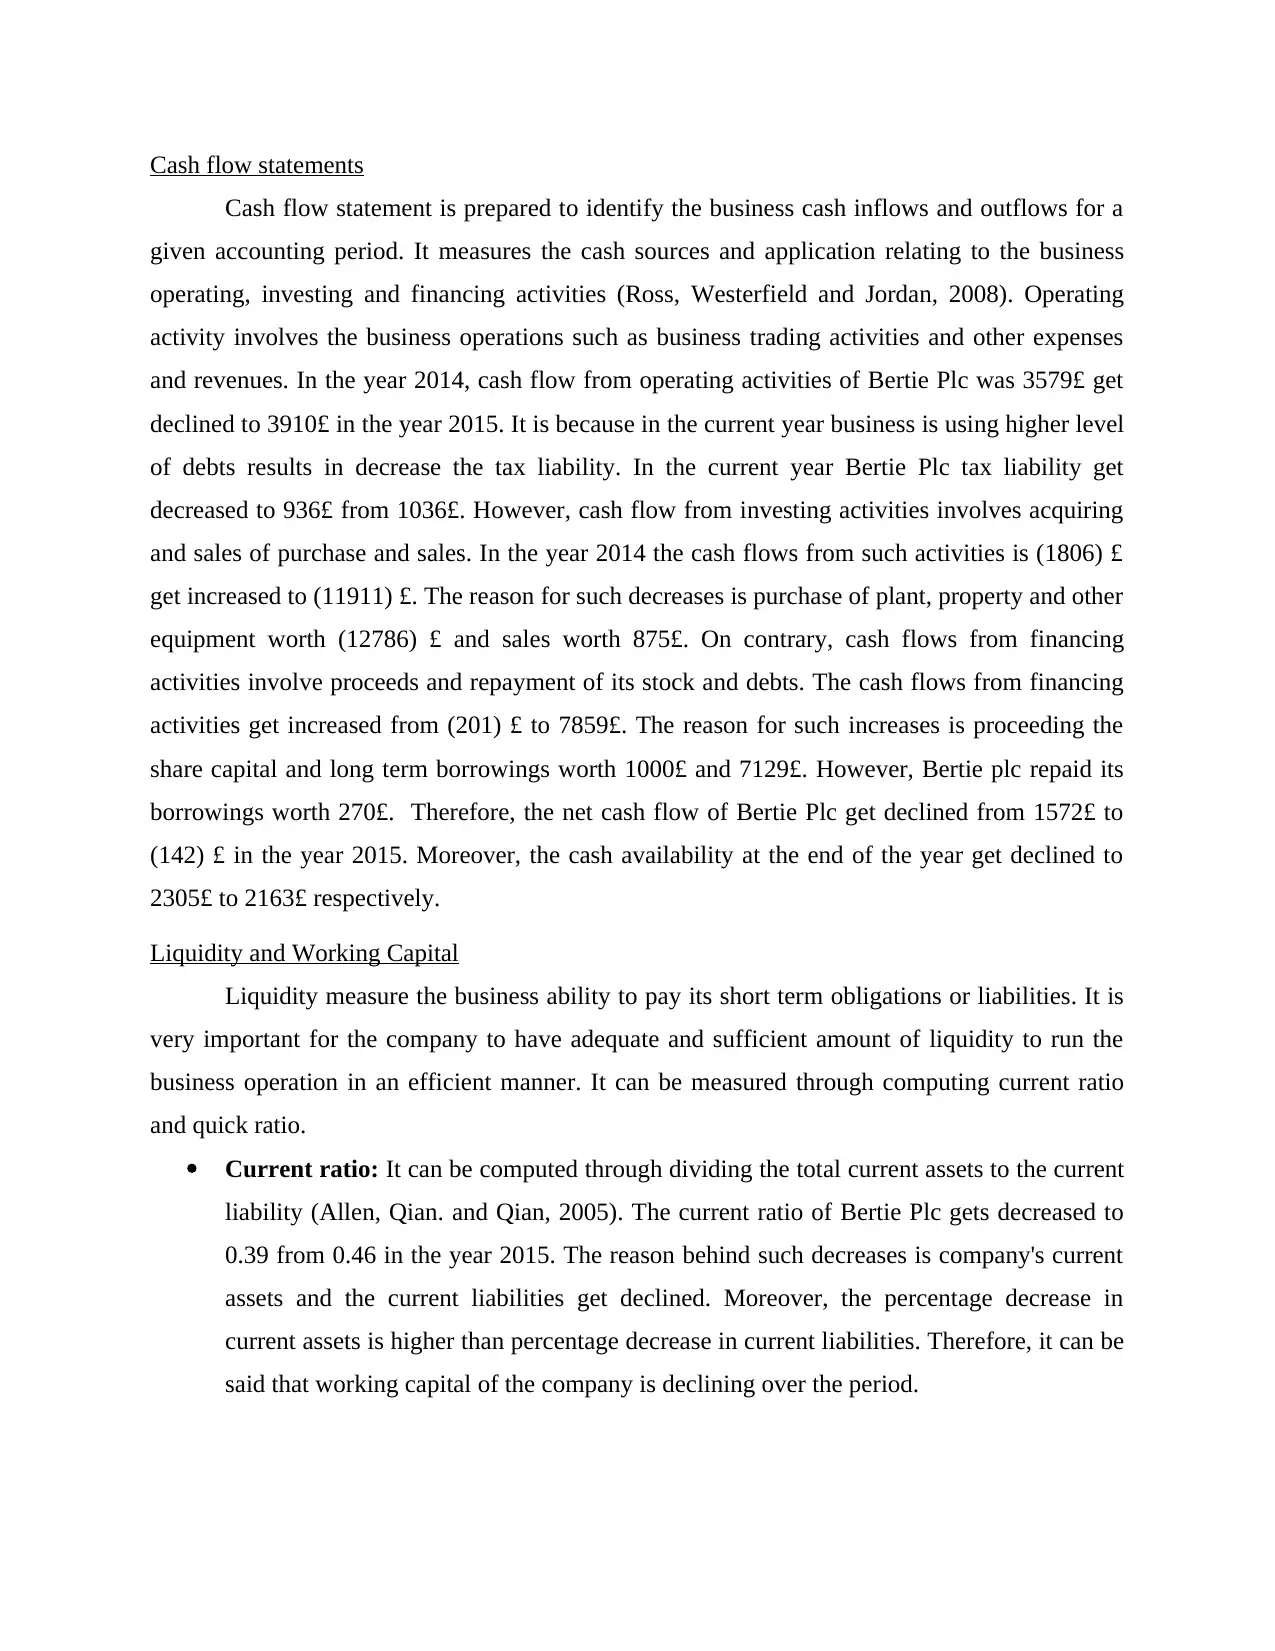
Cash flow statements
Cash flow statement is prepared to identify the business cash inflows and outflows for a
given accounting period. It measures the cash sources and application relating to the business
operating, investing and financing activities (Ross, Westerfield and Jordan, 2008). Operating
activity involves the business operations such as business trading activities and other expenses
and revenues. In the year 2014, cash flow from operating activities of Bertie Plc was 3579£ get
declined to 3910£ in the year 2015. It is because in the current year business is using higher level
of debts results in decrease the tax liability. In the current year Bertie Plc tax liability get
decreased to 936£ from 1036£. However, cash flow from investing activities involves acquiring
and sales of purchase and sales. In the year 2014 the cash flows from such activities is (1806) £
get increased to (11911) £. The reason for such decreases is purchase of plant, property and other
equipment worth (12786) £ and sales worth 875£. On contrary, cash flows from financing
activities involve proceeds and repayment of its stock and debts. The cash flows from financing
activities get increased from (201) £ to 7859£. The reason for such increases is proceeding the
share capital and long term borrowings worth 1000£ and 7129£. However, Bertie plc repaid its
borrowings worth 270£. Therefore, the net cash flow of Bertie Plc get declined from 1572£ to
(142) £ in the year 2015. Moreover, the cash availability at the end of the year get declined to
2305£ to 2163£ respectively.
Liquidity and Working Capital
Liquidity measure the business ability to pay its short term obligations or liabilities. It is
very important for the company to have adequate and sufficient amount of liquidity to run the
business operation in an efficient manner. It can be measured through computing current ratio
and quick ratio.
Current ratio: It can be computed through dividing the total current assets to the current
liability (Allen, Qian. and Qian, 2005). The current ratio of Bertie Plc gets decreased to
0.39 from 0.46 in the year 2015. The reason behind such decreases is company's current
assets and the current liabilities get declined. Moreover, the percentage decrease in
current assets is higher than percentage decrease in current liabilities. Therefore, it can be
said that working capital of the company is declining over the period.
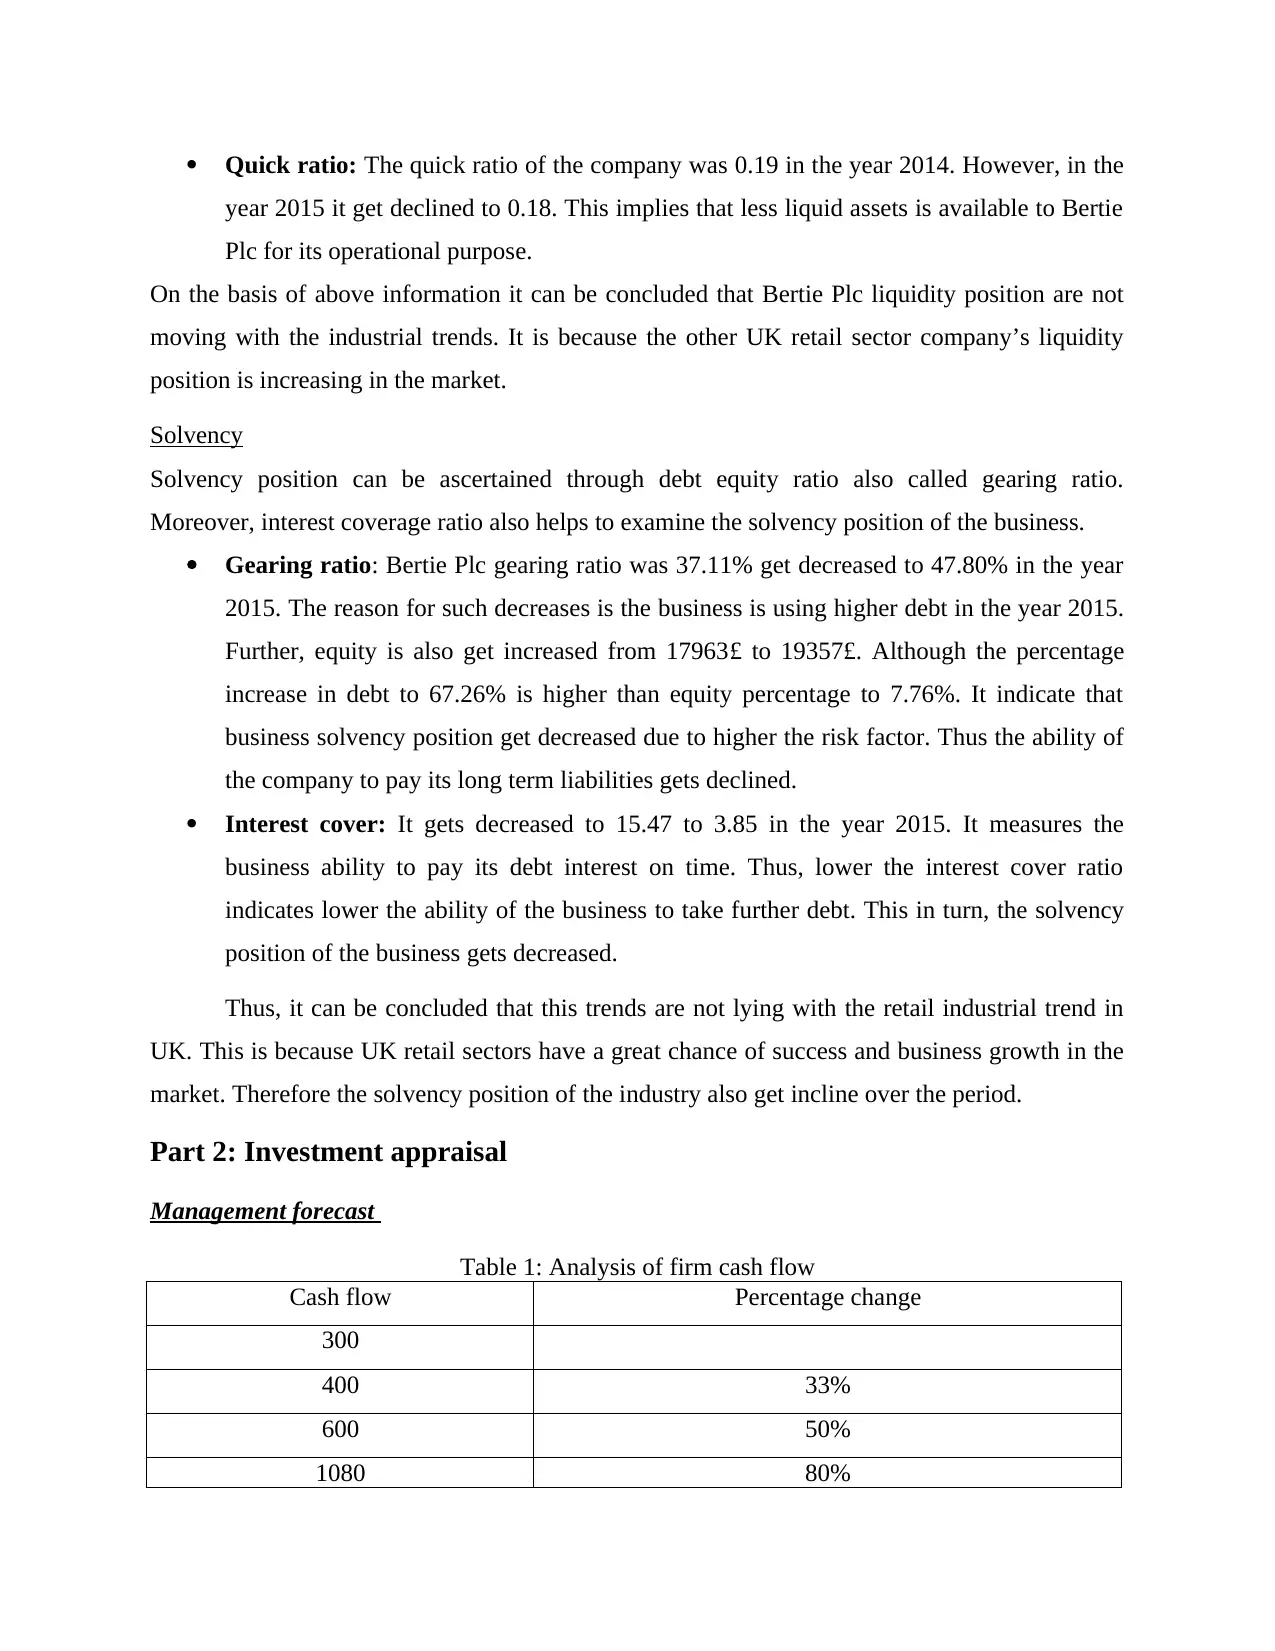
Quick ratio: The quick ratio of the company was 0.19 in the year 2014. However, in the
year 2015 it get declined to 0.18. This implies that less liquid assets is available to Bertie
Plc for its operational purpose.
On the basis of above information it can be concluded that Bertie Plc liquidity position are not
moving with the industrial trends. It is because the other UK retail sector company’s liquidity
position is increasing in the market.
Solvency
Solvency position can be ascertained through debt equity ratio also called gearing ratio.
Moreover, interest coverage ratio also helps to examine the solvency position of the business.
Gearing ratio: Bertie Plc gearing ratio was 37.11% get decreased to 47.80% in the year
2015. The reason for such decreases is the business is using higher debt in the year 2015.
Further, equity is also get increased from 17963£ to 19357£. Although the percentage
increase in debt to 67.26% is higher than equity percentage to 7.76%. It indicate that
business solvency position get decreased due to higher the risk factor. Thus the ability of
the company to pay its long term liabilities gets declined.
Interest cover: It gets decreased to 15.47 to 3.85 in the year 2015. It measures the
business ability to pay its debt interest on time. Thus, lower the interest cover ratio
indicates lower the ability of the business to take further debt. This in turn, the solvency
position of the business gets decreased.
Thus, it can be concluded that this trends are not lying with the retail industrial trend in
UK. This is because UK retail sectors have a great chance of success and business growth in the
market. Therefore the solvency position of the industry also get incline over the period.
Part 2: Investment appraisal
Management forecast
Table 1: Analysis of firm cash flow
Cash flow Percentage change
300
400 33%
600 50%
1080 80%
⊘ This is a preview!⊘
Do you want full access?
Subscribe today to unlock all pages.
Trusted by 1+ million students worldwide
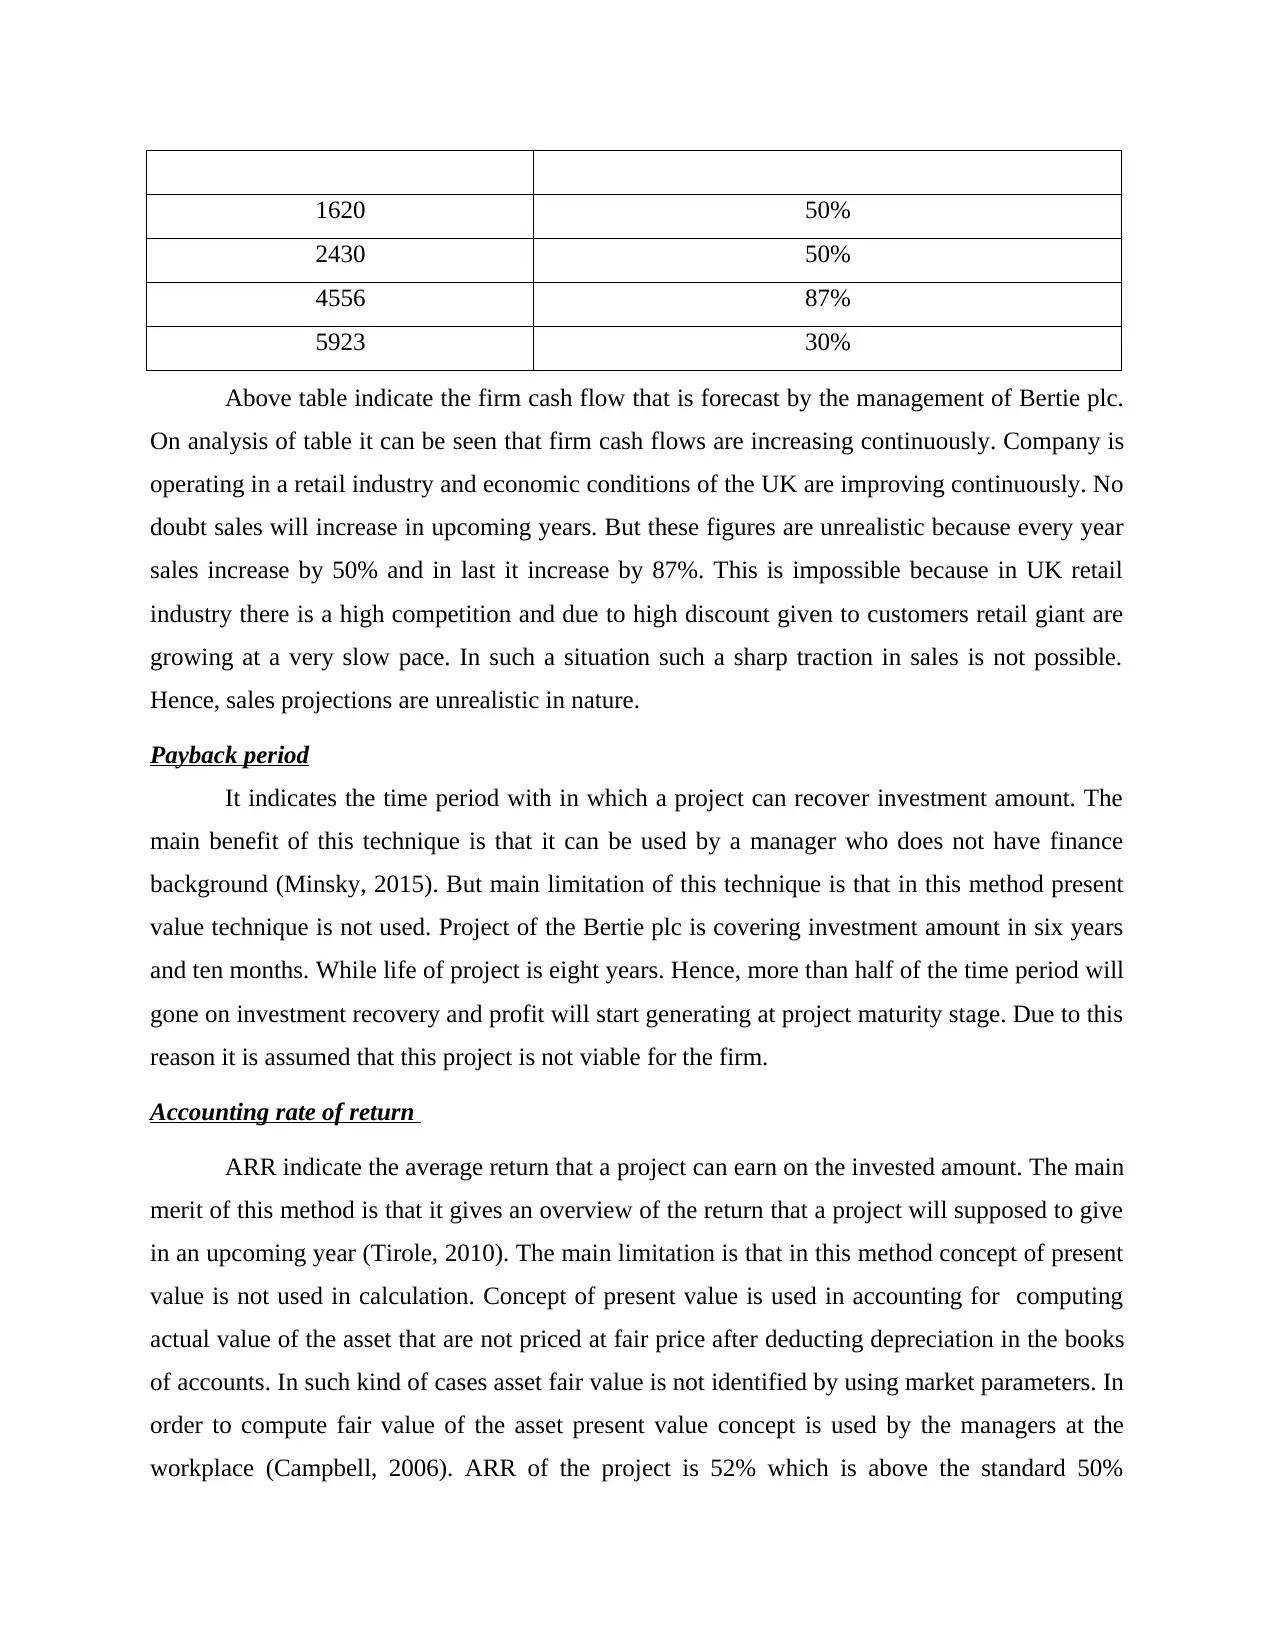
1620 50%
2430 50%
4556 87%
5923 30%
Above table indicate the firm cash flow that is forecast by the management of Bertie plc.
On analysis of table it can be seen that firm cash flows are increasing continuously. Company is
operating in a retail industry and economic conditions of the UK are improving continuously. No
doubt sales will increase in upcoming years. But these figures are unrealistic because every year
sales increase by 50% and in last it increase by 87%. This is impossible because in UK retail
industry there is a high competition and due to high discount given to customers retail giant are
growing at a very slow pace. In such a situation such a sharp traction in sales is not possible.
Hence, sales projections are unrealistic in nature.
Payback period
It indicates the time period with in which a project can recover investment amount. The
main benefit of this technique is that it can be used by a manager who does not have finance
background (Minsky, 2015). But main limitation of this technique is that in this method present
value technique is not used. Project of the Bertie plc is covering investment amount in six years
and ten months. While life of project is eight years. Hence, more than half of the time period will
gone on investment recovery and profit will start generating at project maturity stage. Due to this
reason it is assumed that this project is not viable for the firm.
Accounting rate of return
ARR indicate the average return that a project can earn on the invested amount. The main
merit of this method is that it gives an overview of the return that a project will supposed to give
in an upcoming year (Tirole, 2010). The main limitation is that in this method concept of present
value is not used in calculation. Concept of present value is used in accounting for computing
actual value of the asset that are not priced at fair price after deducting depreciation in the books
of accounts. In such kind of cases asset fair value is not identified by using market parameters. In
order to compute fair value of the asset present value concept is used by the managers at the
workplace (Campbell, 2006). ARR of the project is 52% which is above the standard 50%
Paraphrase This Document
Need a fresh take? Get an instant paraphrase of this document with our AI Paraphraser
determined by the project manager of the mentioned firm. Hence, actual figure beat a standard
and due to this reason it can be said that project is viable for the firm individually on the basis of
this parameter.
Net present value
Net present value indicates the present value of the project that is computed by deducting
initial investment amount from present value of the cash flows. The main benefit of this
technique is that in this method concept of present value is used by the project manager for
accessing viability of the project (Mandelbrot, 2013). But main limitation of this technique is that
in this method discount rate is used and it is difficult to determine exact discount rate for
calculation. Selection of wrong discount rate may lead to selection of wrong project. Hence firm
may face loss on specific project. NPV of the firm is positive and due to this reason this project
is assumed viable for the firm on the basis of this parameter.
On the basis of evaluation of project on the basis of these techniques it is concluded that
project is not viable for the firm because it is covering long time period in covering investment
amount. ARR is above standard which is good but there is no alternative project by comparing
with we can say that on the NPV project is profitable for the firm. Hence, vagueness on results of
NPV and poor performance on Payback period this project is considered nonviable for the firm.
Sources of internal finance Reduce inventory holding- This is a very good option of internal source of finance. By
reducing inventory holding day firm can do saving on its inventory holding cost. This
saved amount can be used to finance company operations. Thus, it is a good source of
short term finance. This is a viable option and firm must follow this method of short term
financing.
Extending supplier payment terms- This is also viable option for the firm by extending
supplier payment terms firm can finance its internal operations. But it must not make
long delay in making payment to suppliers. If this will be done it make relationship with
suppliers bitter.
Part 3: Formal business report
To
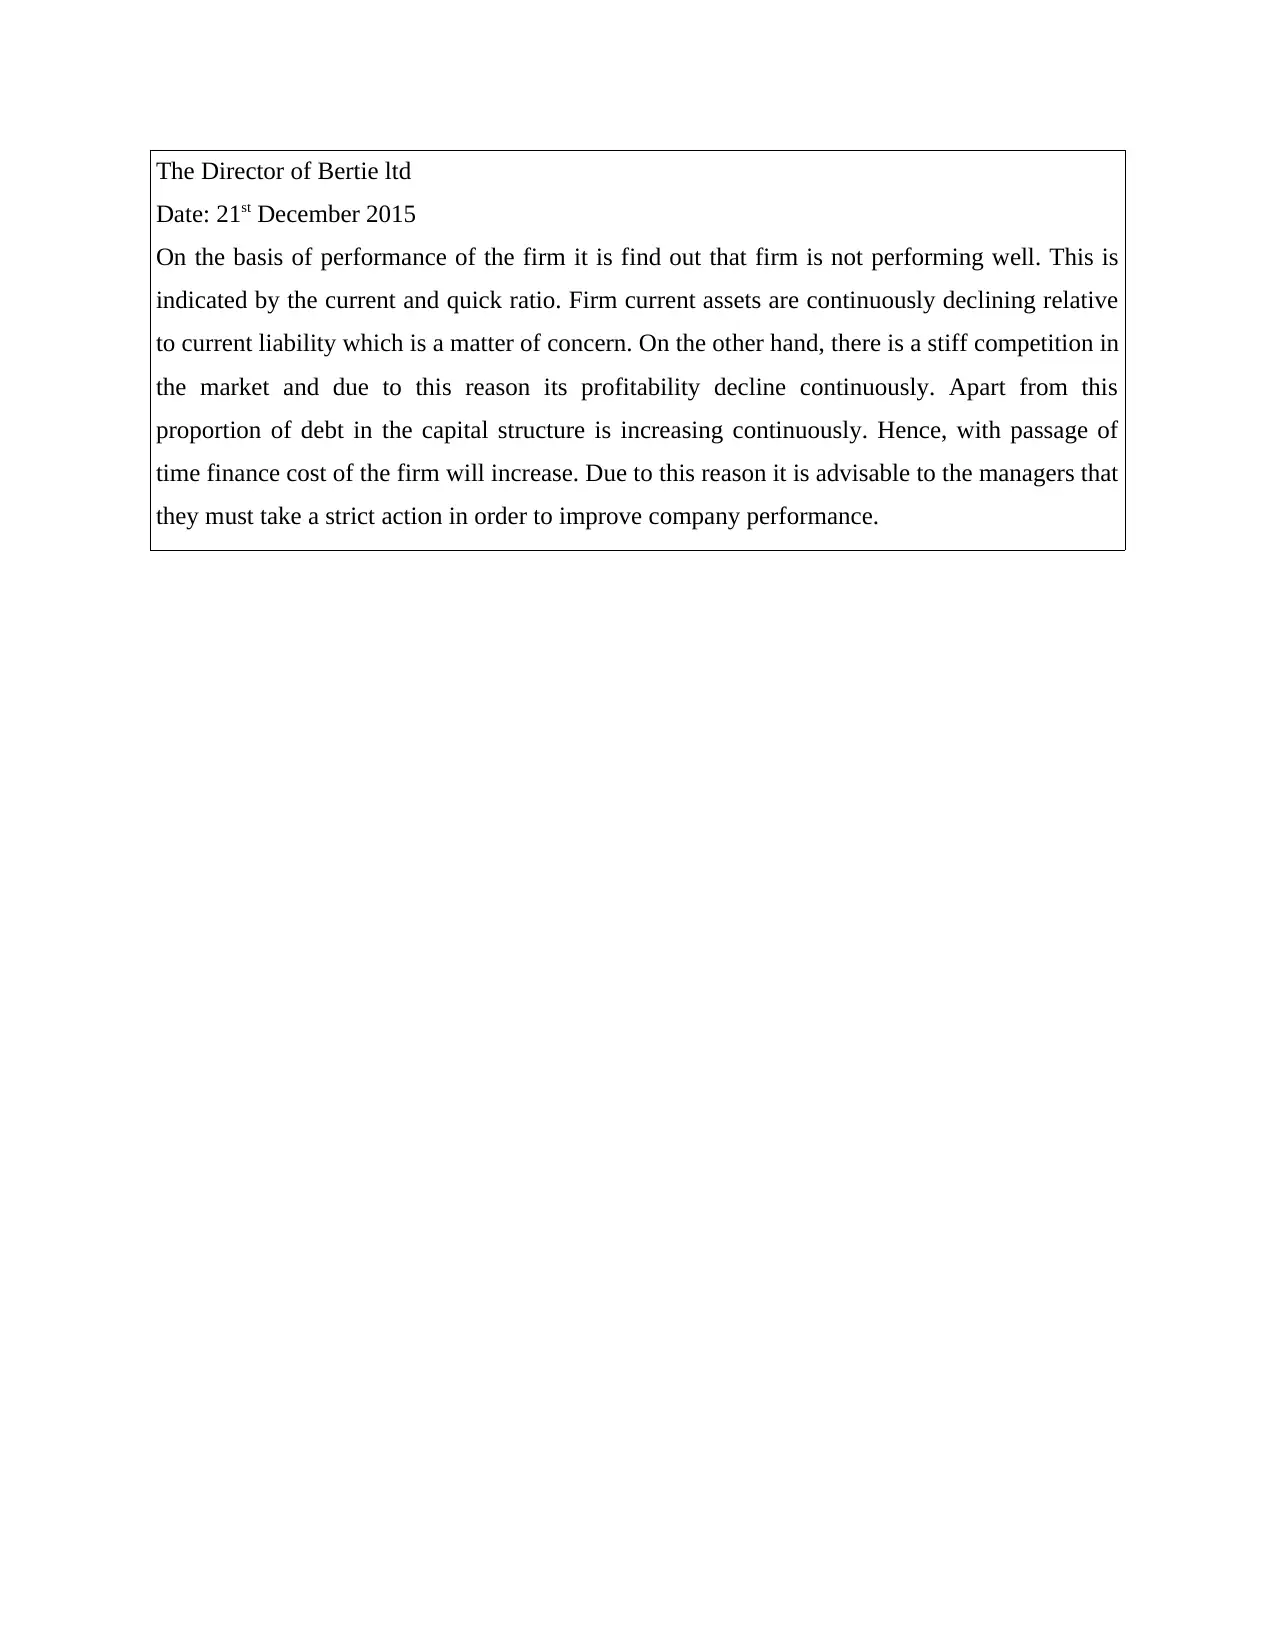
The Director of Bertie ltd
Date: 21st December 2015
On the basis of performance of the firm it is find out that firm is not performing well. This is
indicated by the current and quick ratio. Firm current assets are continuously declining relative
to current liability which is a matter of concern. On the other hand, there is a stiff competition in
the market and due to this reason its profitability decline continuously. Apart from this
proportion of debt in the capital structure is increasing continuously. Hence, with passage of
time finance cost of the firm will increase. Due to this reason it is advisable to the managers that
they must take a strict action in order to improve company performance.
⊘ This is a preview!⊘
Do you want full access?
Subscribe today to unlock all pages.
Trusted by 1+ million students worldwide
Conclusion
The presented report concludes that financial statements help the organization to assess
and interpret the operational as well as financial status of the company. It helps to identify the
business performance and the financial position of the business. Along with this, cash flow
statements also are of great importance for assessing the business cash sources and its application
in different functions. Further, the report described that distinct investment appraisal techniques
helps to take correct investment decisions so as to get higher the yields. The techniques help
businesses to enhance its profits and ensure business development and business growth for the
long term period.
Paraphrase This Document
Need a fresh take? Get an instant paraphrase of this document with our AI Paraphraser
References
Books & journals
Allen, F., Qian, J. and Qian, M., 2005. Law, finance, and economic growth in China. Journal of
financial economics. 77(1). pp.57-116.
Brealey, R.A., 2012. Principles of corporate finance. Tata McGraw-Hill Education.
Campbell, J.Y., 2006. Household finance. The Journal of Finance. 61(4). pp.1553-1604.
Mandelbrot, B.B., 2013. Fractals and Scaling in Finance: Discontinuity, Concentration, Risk.
Selecta Volume E. Springer Science & Business Media.
Minsky, H.P., 2015. Can" it" happen again?: essays on instability and finance. Routledge.
Petersen, M.A., 2009. Estimating standard errors in finance panel data sets: Comparing
approaches. Review of financial studies. 22(1). pp.435-480.
Ross, S.A., Westerfield, R. and Jordan, B.D., 2008. Fundamentals of corporate finance. Tata
McGraw-Hill Education.
Tirole, J., 2010. The theory of corporate finance. Princeton University Press.
Online
Gross profit ratio. 2015. [Online]. Available through: < http://www.accountingtools.com/gross-
profit-ratio>. [Accessed on 21st December 2015].
1 out of 11
Related Documents


Your All-in-One AI-Powered Toolkit for Academic Success.
+13062052269
info@desklib.com
Available 24*7 on WhatsApp / Email
![[object Object]](/_next/static/media/star-bottom.7253800d.svg)
Unlock your academic potential
Copyright © 2020–2026 A2Z Services. All Rights Reserved. Developed and managed by ZUCOL.