Cell and Molecular Biology Report: Beta Agonists and Antagonists
VerifiedAdded on 2022/09/13
|11
|2879
|8
Report
AI Summary
This laboratory report investigates the effects of two unknown drugs, B1 and D4, on the proliferation of mouse fibroblast cells (LTK-). The study aims to understand the signaling pathways involved, specifically focusing on the role of beta-adrenergic receptors (GPCRs) and the impact of agonists and antagonists on cell proliferation. The experiment involves preparing a cell suspension, counting viable cells using a hemocytometer, and treating the cells with the drugs. Cell confluency is measured before and after crystal violet staining to determine the percentage of viable cells. The results indicate that drug B1 acts as a beta-adrenergic receptor agonist, stimulating cell proliferation, while drug D4 functions as an antagonist, inhibiting cell growth. The report analyzes the experimental data, discusses the signaling pathways, and concludes that B1 activates the Raf/MEK/ERK pathway, leading to cell proliferation, while D4 inhibits the pathway. The report also includes tables of cell counts, confluency values, graphs, and photographs of the cell cultures.
Cell and Molecular Biology: Beta agonists and Antagonists 1
CELL AND MOLECULAR BIOLOGY
Class:
Professor:
City and State:
Date: 06/04/20
CELL AND MOLECULAR BIOLOGY
Class:
Professor:
City and State:
Date: 06/04/20
Paraphrase This Document
Need a fresh take? Get an instant paraphrase of this document with our AI Paraphraser
Cell and Molecular Biology: Beta agonists and Antagonists 2
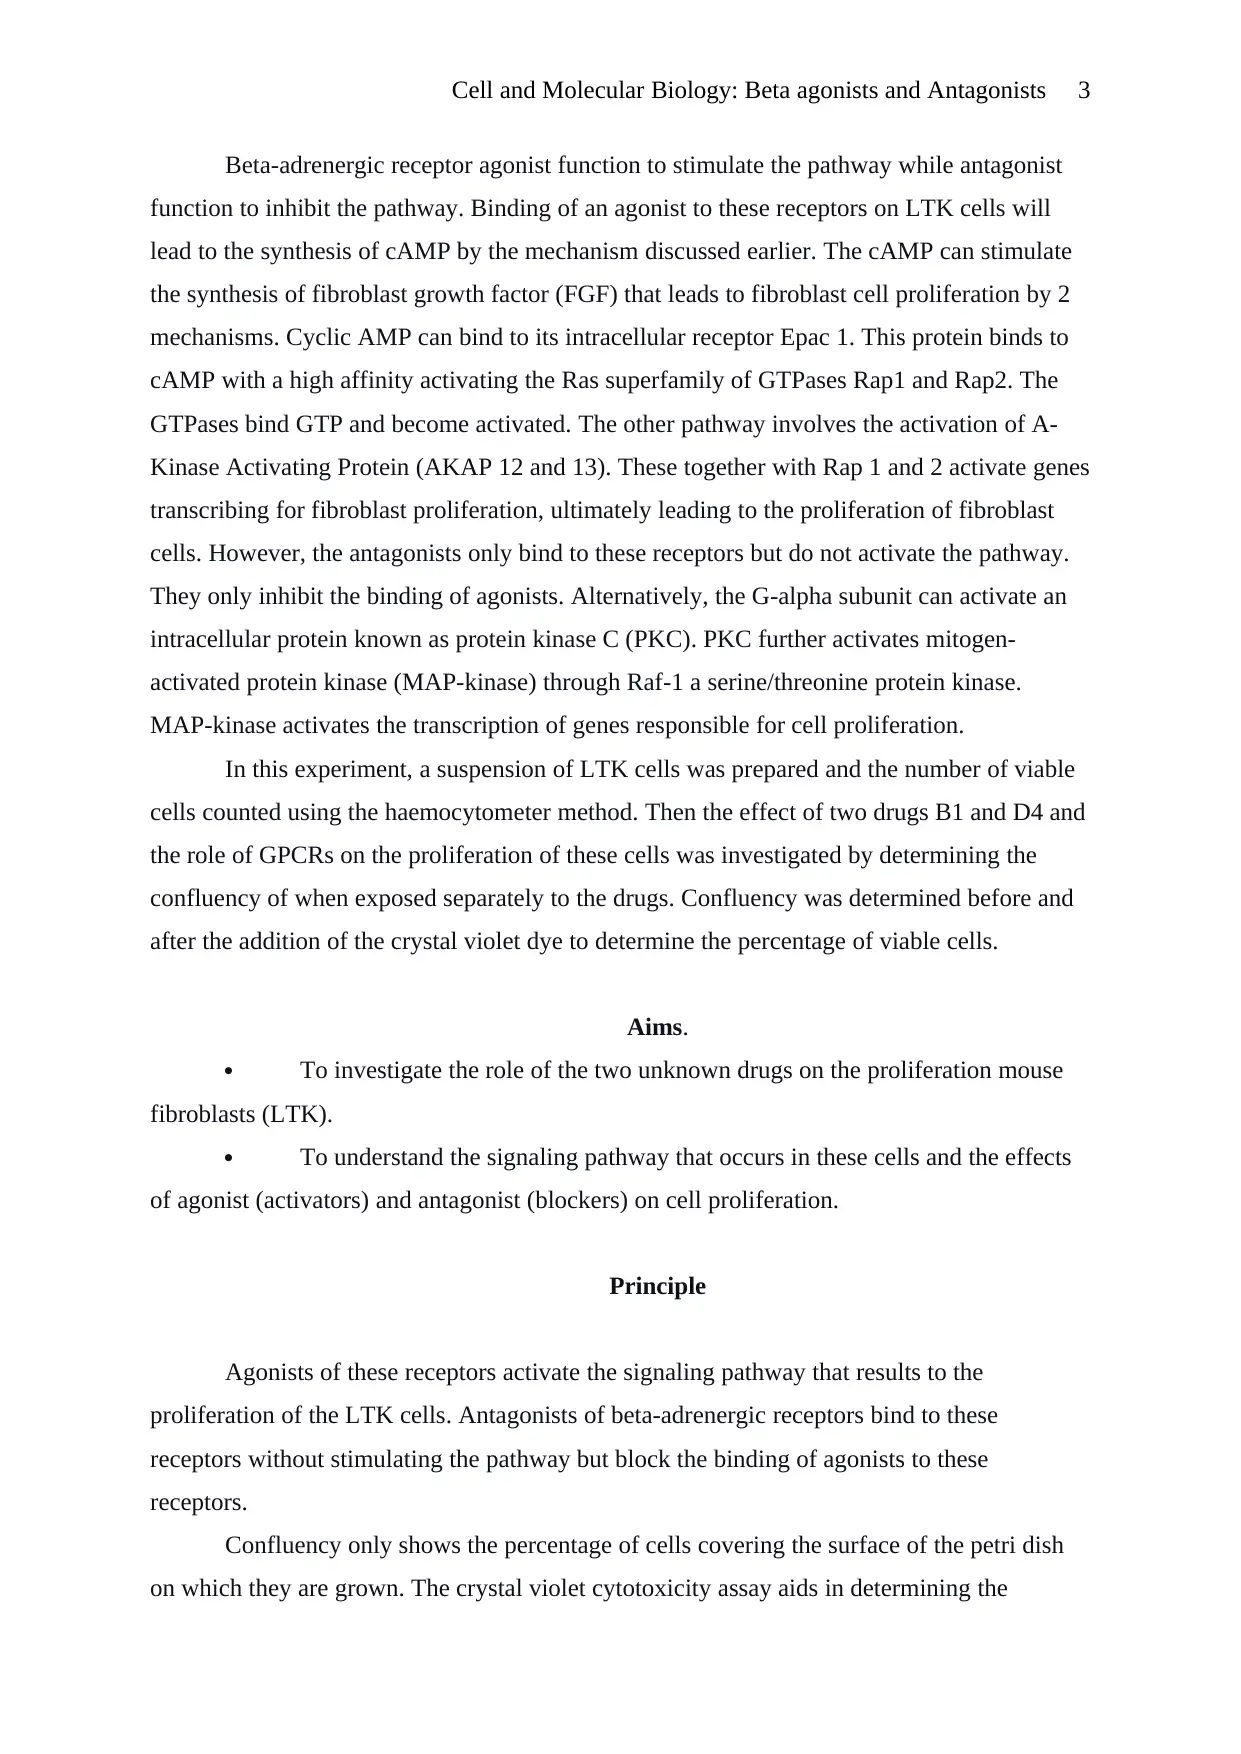
A laboratory report on: Determination of beta-adrenergic antagonist and agonist
by evaluating the impact of compounds B1 and D1 on mouse fibroblast cells (LTK)
Introduction
The growth of cells in all living organisms is controlled by signaling pathways that
run from the cell membrane downstream to the nucleus. Several molecular and cellular
factors govern these pathways. These signaling pathways follow a general pattern that
involves ligand binding to a specific receptor at the cell membrane surface for extracellular
receptors and inside the cell for intracellular receptors. Following binding, downstream
pathways are activated, where signaling molecules such as cAMP are involved to relay the
signal ultimately to the nucleus to regulate gene transcription. The signaling pathway
followed depends entirely on the class of receptor (each receptor has a different signaling
pathway). G-protein coupled receptors (GPCRs) are one of the main extracellular, others
being tyrosine kinase receptors and ion channel receptors. GPCRs are physiologically
important to cells since they regulate cell to cell communication by recognizing a wide array
of ligands including amines, bioactive peptides, lipids, and nucleosides. He et al., (2017)
revealed that isoproterenol, a beta-adrenergic receptor agonist promoted cell growth in brain
tumors, highlighting an important role possessed by these receptors in cell growth. They also
showed that beta-adrenergic antagonists inhibited cell growth.
The signaling pathway of beta-adrenergic receptors entails a specific ligand binding to
the receptor at the cell membrane (it is a trans-membrane protein). The receptor has 3
subunits, labeled in Greek letters as alpha, beta and gamma subunits of the G-protein.
Binding of a stimulatory ligand causes the G-alpha subunit to dissociate and activate adenylyl
cyclase an intracellular enzyme to convert ATP to cAMP. This acts as a second messenger to
relay the signal downstream and eventually to the nucleus to regulate gene expression.
Fibroblasts are a type of cell that functions to synthesize extracellular matrix and
connective tissue collagen. They are involved in the synthesis structural molecules for animal
tissues and consequently play a role in healing of wounds. The cells well suited for this study
are mouse fibroblast cells without the enzyme thymidine kinase (hence the abbreviation
LTK) which express beta-adrenergic receptors, a class of GPCRs, and can safely be used on
the bench. These cells can be used to study the impact of various ligands on these receptors
and hence the proliferation of cells. Proliferation of cells is one of the functions that this
receptor mediates.
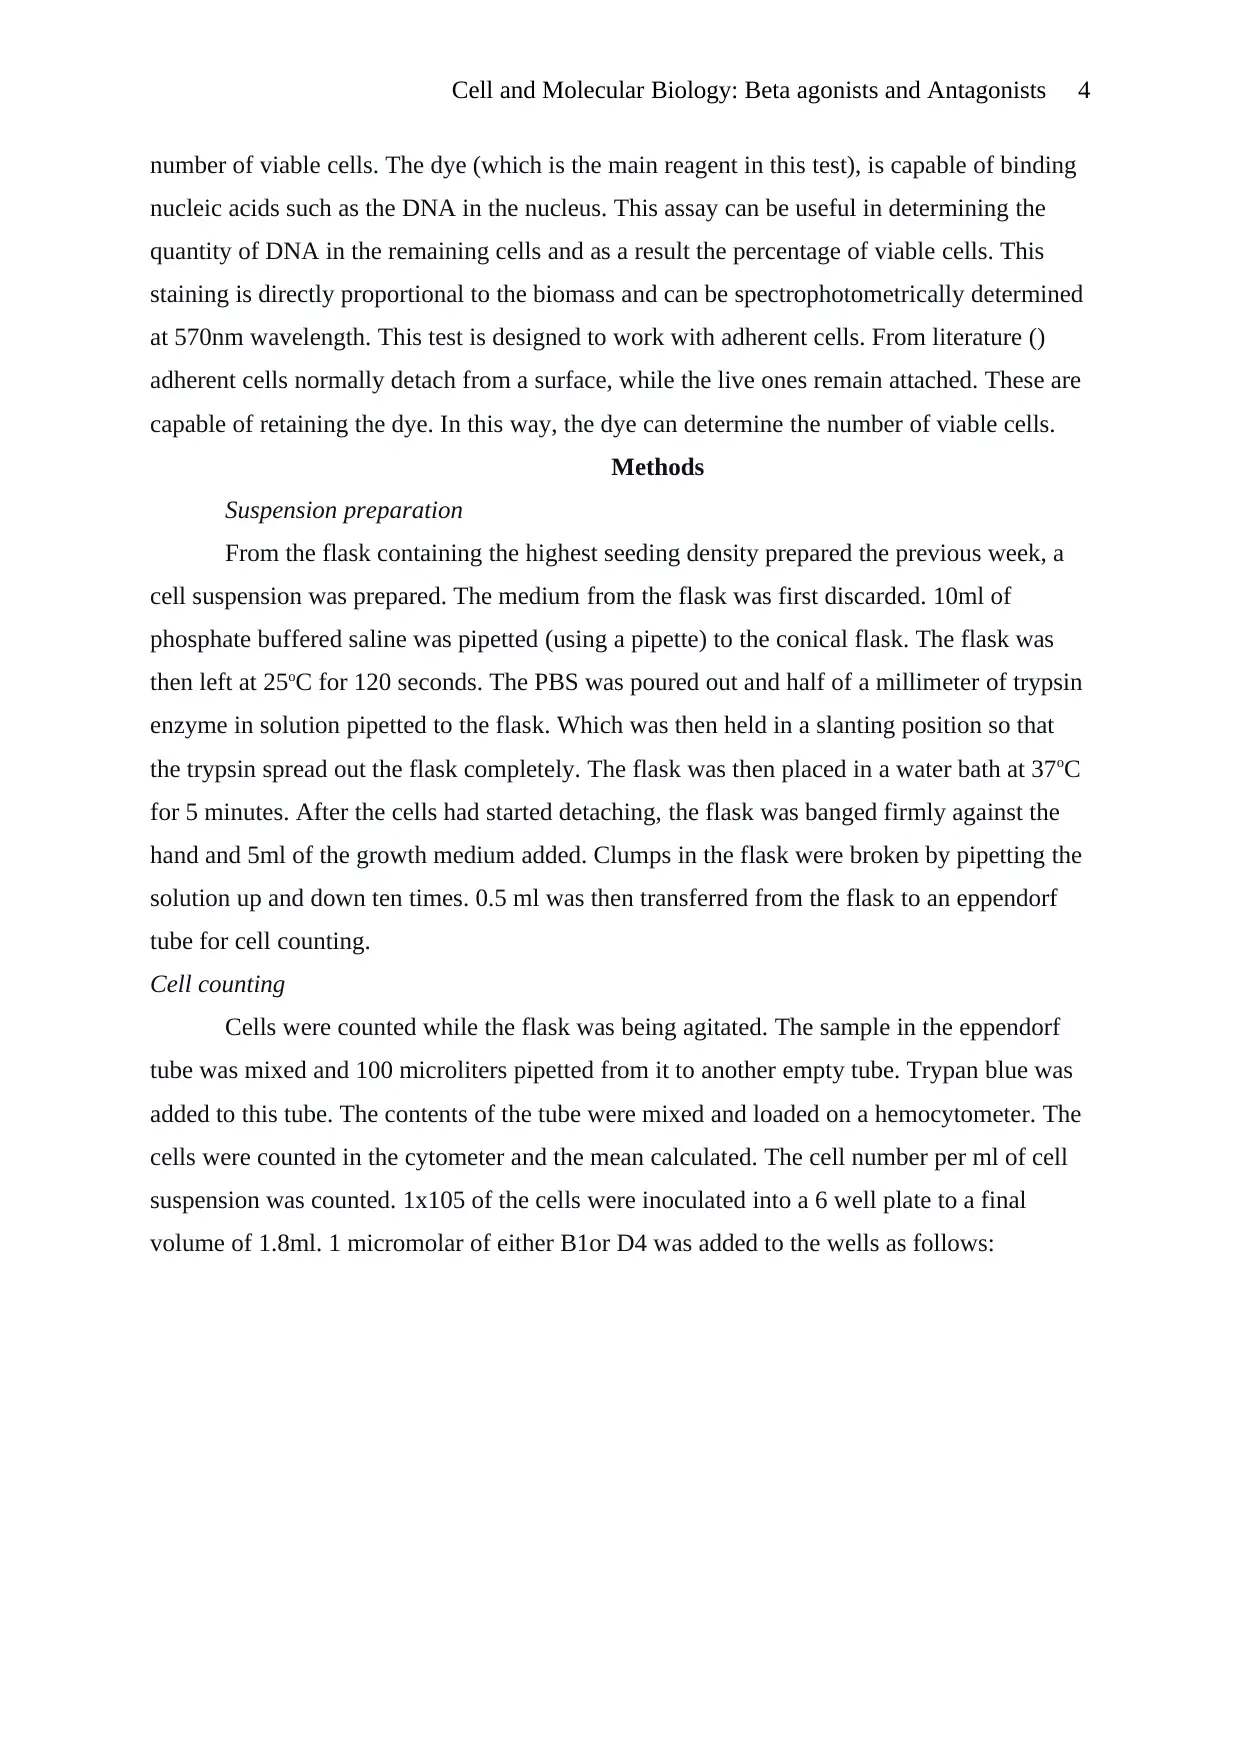
Cell and Molecular Biology: Beta agonists and Antagonists 3
Beta-adrenergic receptor agonist function to stimulate the pathway while antagonist
function to inhibit the pathway. Binding of an agonist to these receptors on LTK cells will
lead to the synthesis of cAMP by the mechanism discussed earlier. The cAMP can stimulate
the synthesis of fibroblast growth factor (FGF) that leads to fibroblast cell proliferation by 2
mechanisms. Cyclic AMP can bind to its intracellular receptor Epac 1. This protein binds to
cAMP with a high affinity activating the Ras superfamily of GTPases Rap1 and Rap2. The
GTPases bind GTP and become activated. The other pathway involves the activation of A-
Kinase Activating Protein (AKAP 12 and 13). These together with Rap 1 and 2 activate genes
transcribing for fibroblast proliferation, ultimately leading to the proliferation of fibroblast
cells. However, the antagonists only bind to these receptors but do not activate the pathway.
They only inhibit the binding of agonists. Alternatively, the G-alpha subunit can activate an
intracellular protein known as protein kinase C (PKC). PKC further activates mitogen-
activated protein kinase (MAP-kinase) through Raf-1 a serine/threonine protein kinase.
MAP-kinase activates the transcription of genes responsible for cell proliferation.
In this experiment, a suspension of LTK cells was prepared and the number of viable
cells counted using the haemocytometer method. Then the effect of two drugs B1 and D4 and
the role of GPCRs on the proliferation of these cells was investigated by determining the
confluency of when exposed separately to the drugs. Confluency was determined before and
after the addition of the crystal violet dye to determine the percentage of viable cells.
Aims.
To investigate the role of the two unknown drugs on the proliferation mouse
fibroblasts (LTK).
To understand the signaling pathway that occurs in these cells and the effects
of agonist (activators) and antagonist (blockers) on cell proliferation.
Principle
Agonists of these receptors activate the signaling pathway that results to the
proliferation of the LTK cells. Antagonists of beta-adrenergic receptors bind to these
receptors without stimulating the pathway but block the binding of agonists to these
receptors.
Confluency only shows the percentage of cells covering the surface of the petri dish
on which they are grown. The crystal violet cytotoxicity assay aids in determining the
⊘ This is a preview!⊘
Do you want full access?
Subscribe today to unlock all pages.
Trusted by 1+ million students worldwide
Cell and Molecular Biology: Beta agonists and Antagonists 4
number of viable cells. The dye (which is the main reagent in this test), is capable of binding
nucleic acids such as the DNA in the nucleus. This assay can be useful in determining the
quantity of DNA in the remaining cells and as a result the percentage of viable cells. This
staining is directly proportional to the biomass and can be spectrophotometrically determined
at 570nm wavelength. This test is designed to work with adherent cells. From literature ()
adherent cells normally detach from a surface, while the live ones remain attached. These are
capable of retaining the dye. In this way, the dye can determine the number of viable cells.
Methods
Suspension preparation
From the flask containing the highest seeding density prepared the previous week, a
cell suspension was prepared. The medium from the flask was first discarded. 10ml of
phosphate buffered saline was pipetted (using a pipette) to the conical flask. The flask was
then left at 25oC for 120 seconds. The PBS was poured out and half of a millimeter of trypsin
enzyme in solution pipetted to the flask. Which was then held in a slanting position so that
the trypsin spread out the flask completely. The flask was then placed in a water bath at 37oC
for 5 minutes. After the cells had started detaching, the flask was banged firmly against the
hand and 5ml of the growth medium added. Clumps in the flask were broken by pipetting the
solution up and down ten times. 0.5 ml was then transferred from the flask to an eppendorf
tube for cell counting.
Cell counting
Cells were counted while the flask was being agitated. The sample in the eppendorf
tube was mixed and 100 microliters pipetted from it to another empty tube. Trypan blue was
added to this tube. The contents of the tube were mixed and loaded on a hemocytometer. The
cells were counted in the cytometer and the mean calculated. The cell number per ml of cell
suspension was counted. 1x10⁵ of the cells were inoculated into a 6 well plate to a final
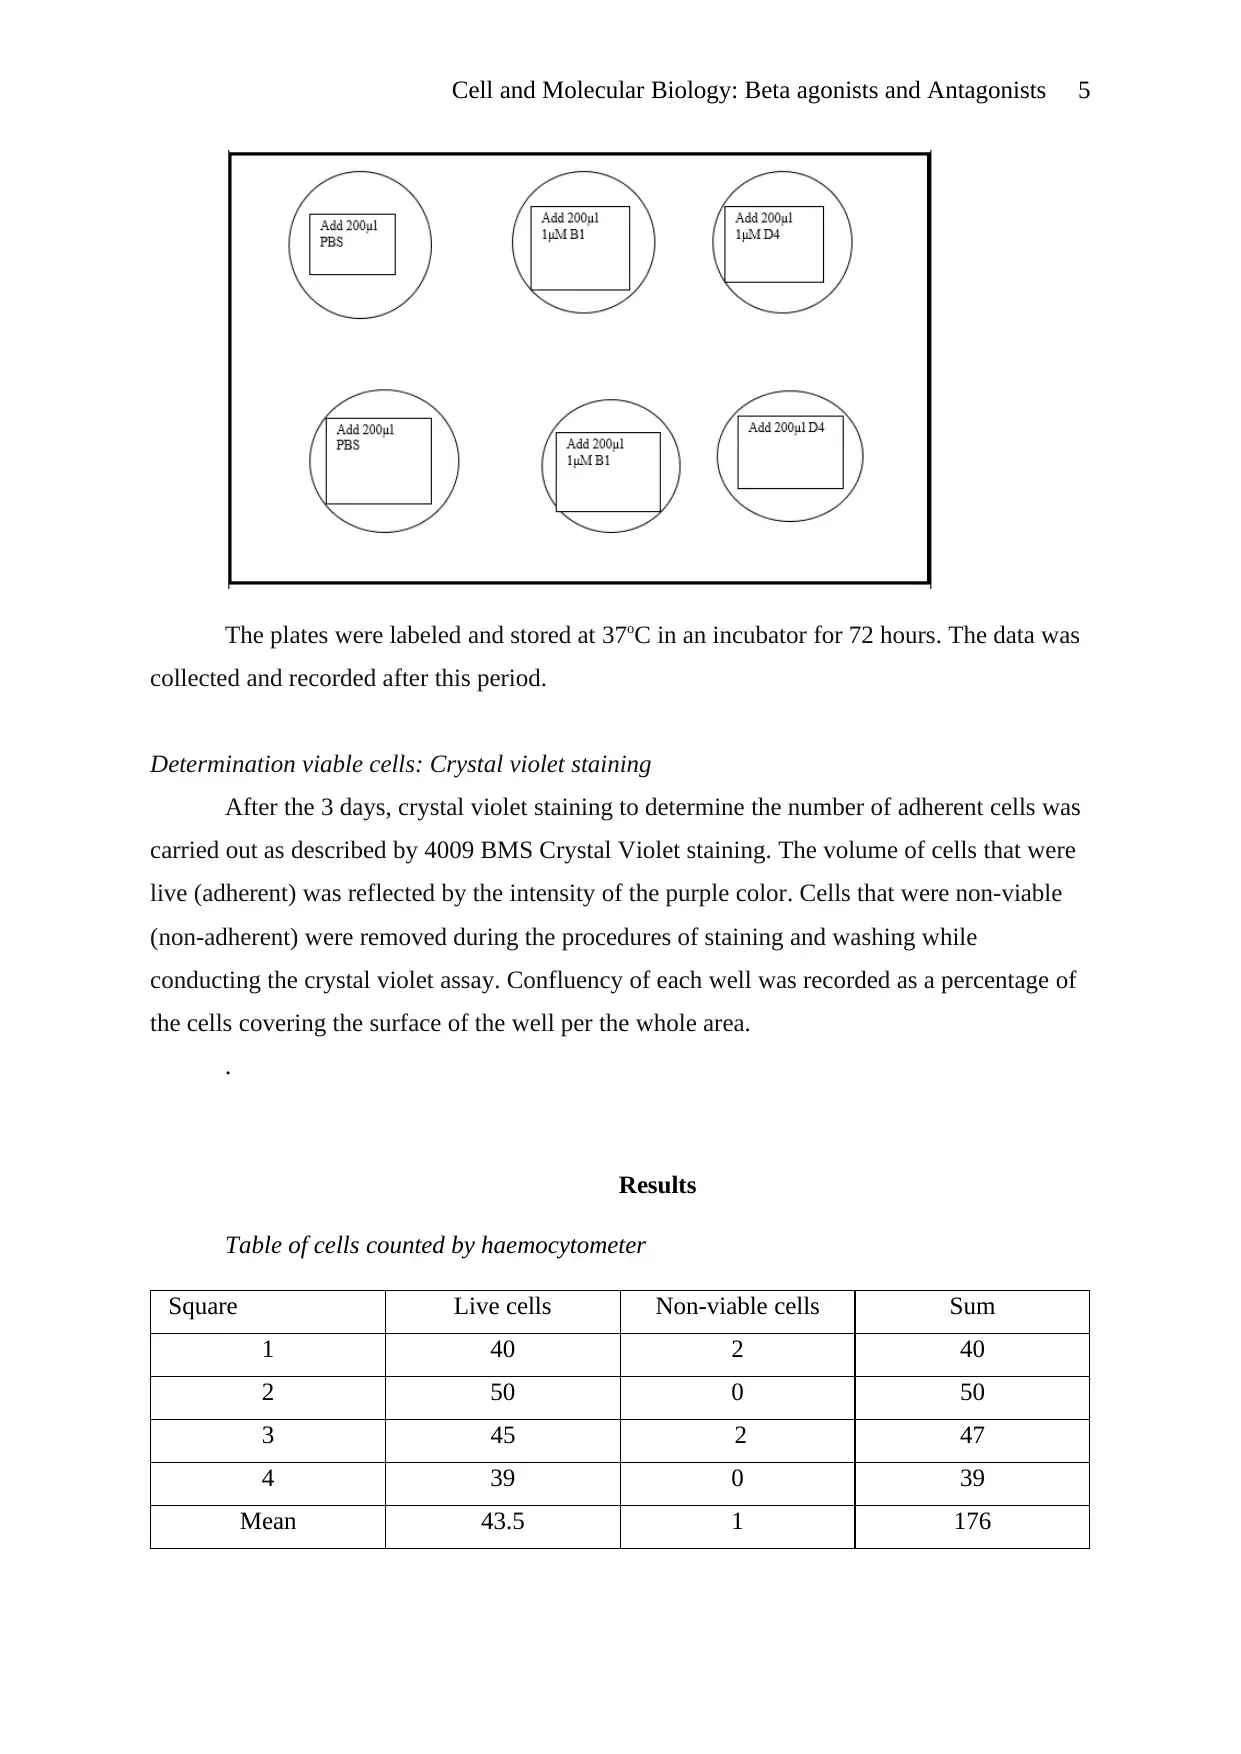
volume of 1.8ml. 1 micromolar of either B1or D4 was added to the wells as follows:
number of viable cells. The dye (which is the main reagent in this test), is capable of binding
nucleic acids such as the DNA in the nucleus. This assay can be useful in determining the
quantity of DNA in the remaining cells and as a result the percentage of viable cells. This
staining is directly proportional to the biomass and can be spectrophotometrically determined
at 570nm wavelength. This test is designed to work with adherent cells. From literature ()
adherent cells normally detach from a surface, while the live ones remain attached. These are
capable of retaining the dye. In this way, the dye can determine the number of viable cells.
Methods
Suspension preparation
From the flask containing the highest seeding density prepared the previous week, a
cell suspension was prepared. The medium from the flask was first discarded. 10ml of
phosphate buffered saline was pipetted (using a pipette) to the conical flask. The flask was
then left at 25oC for 120 seconds. The PBS was poured out and half of a millimeter of trypsin
enzyme in solution pipetted to the flask. Which was then held in a slanting position so that
the trypsin spread out the flask completely. The flask was then placed in a water bath at 37oC
for 5 minutes. After the cells had started detaching, the flask was banged firmly against the
hand and 5ml of the growth medium added. Clumps in the flask were broken by pipetting the
solution up and down ten times. 0.5 ml was then transferred from the flask to an eppendorf
tube for cell counting.
Cell counting
Cells were counted while the flask was being agitated. The sample in the eppendorf
tube was mixed and 100 microliters pipetted from it to another empty tube. Trypan blue was
added to this tube. The contents of the tube were mixed and loaded on a hemocytometer. The
cells were counted in the cytometer and the mean calculated. The cell number per ml of cell
suspension was counted. 1x10⁵ of the cells were inoculated into a 6 well plate to a final
volume of 1.8ml. 1 micromolar of either B1or D4 was added to the wells as follows:
Paraphrase This Document
Need a fresh take? Get an instant paraphrase of this document with our AI Paraphraser
Cell and Molecular Biology: Beta agonists and Antagonists 5
The plates were labeled and stored at 37oC in an incubator for 72 hours. The data was
collected and recorded after this period.
Determination viable cells: Crystal violet staining
After the 3 days, crystal violet staining to determine the number of adherent cells was
carried out as described by 4009 BMS Crystal Violet staining. The volume of cells that were
live (adherent) was reflected by the intensity of the purple color. Cells that were non-viable
(non-adherent) were removed during the procedures of staining and washing while
conducting the crystal violet assay. Confluency of each well was recorded as a percentage of
the cells covering the surface of the well per the whole area.
.
Results
Table of cells counted by haemocytometer
Square Live cells Non-viable cells Sum
1 40 2 40
2 50 0 50
3 45 2 47
4 39 0 39
Mean 43.5 1 176
Cell and Molecular Biology: Beta agonists and Antagonists 6
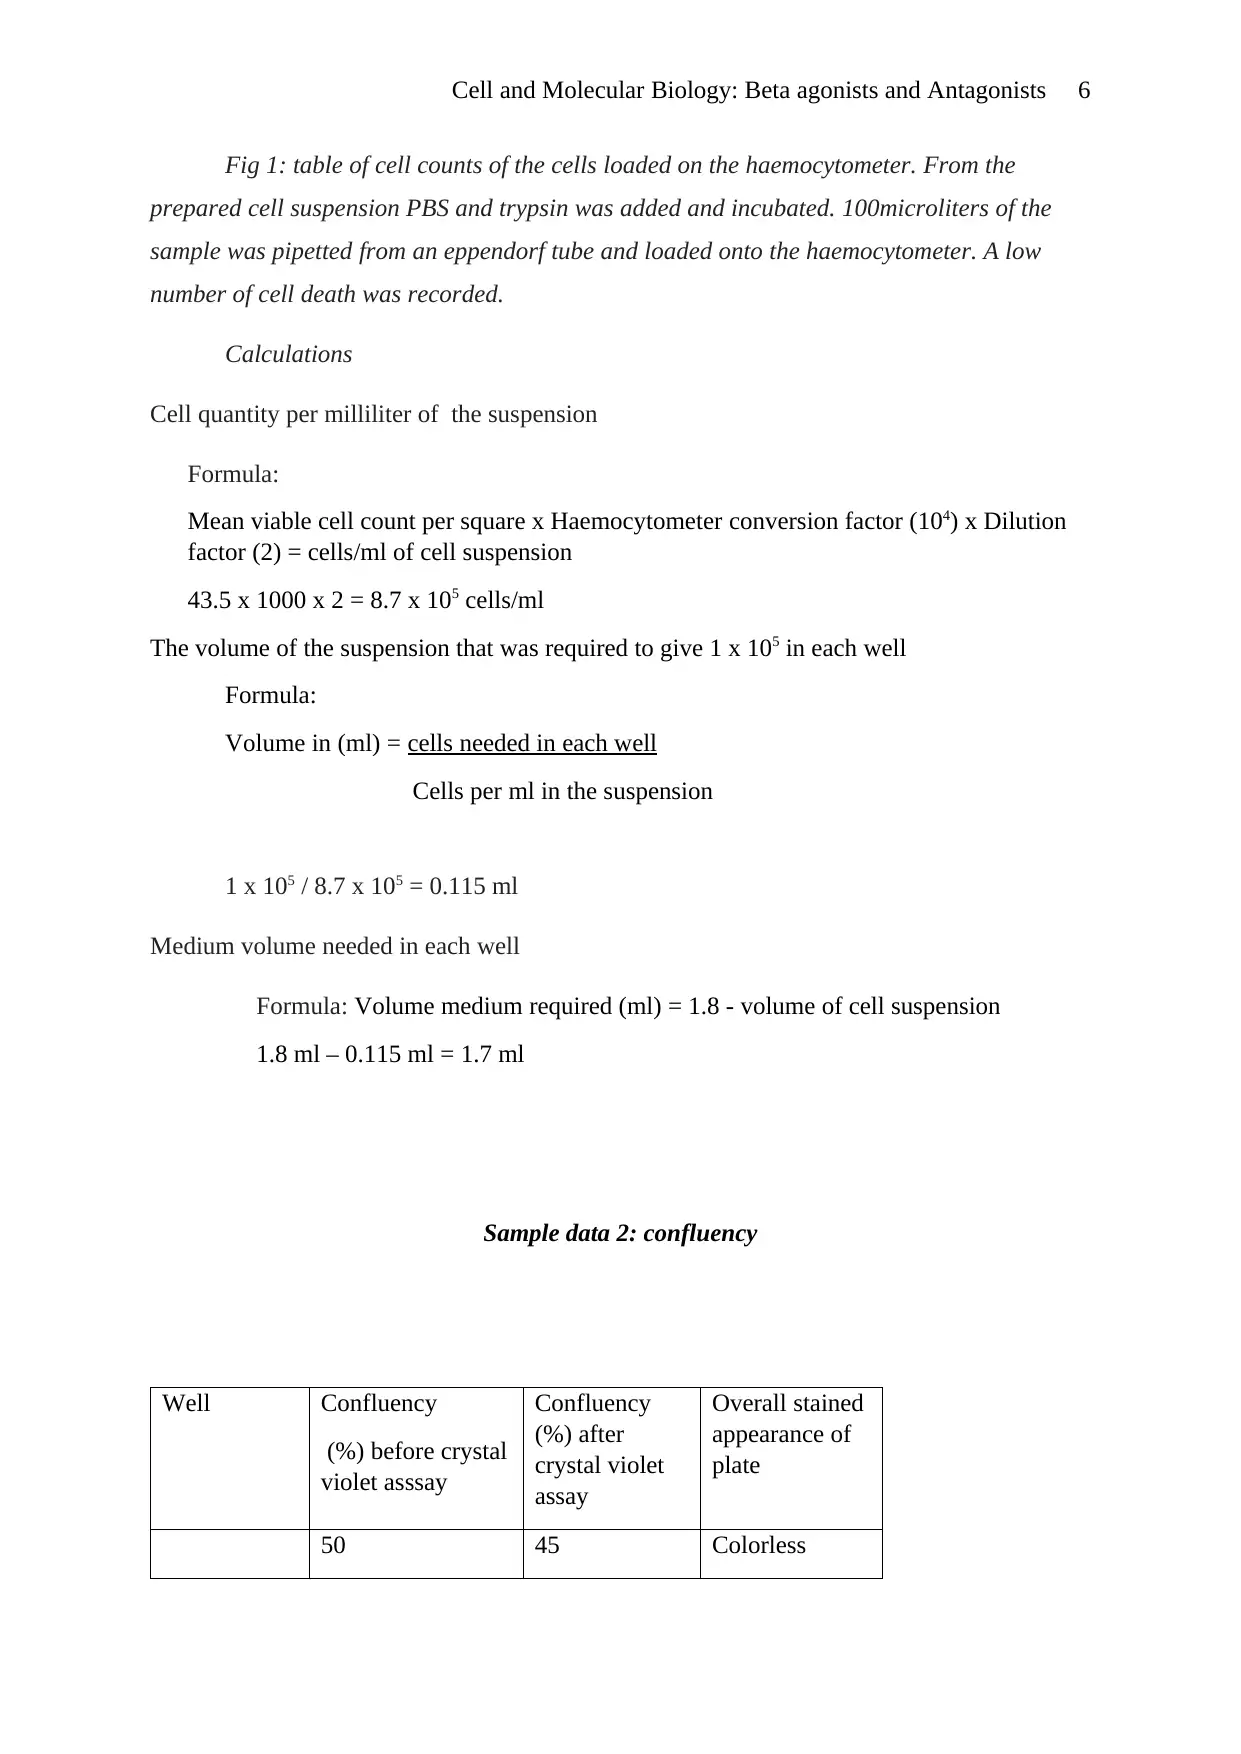
Fig 1: table of cell counts of the cells loaded on the haemocytometer. From the
prepared cell suspension PBS and trypsin was added and incubated. 100microliters of the
sample was pipetted from an eppendorf tube and loaded onto the haemocytometer. A low
number of cell death was recorded.
Calculations
Cell quantity per milliliter of the suspension
Formula:
Mean viable cell count per square x Haemocytometer conversion factor (104) x Dilution
factor (2) = cells/ml of cell suspension
43.5 x 1000 x 2 = 8.7 x 10⁵ cells/ml
The volume of the suspension that was required to give 1 x 10⁵ in each well
Formula:
Volume in (ml) = cells needed in each well
Cells per ml in the suspension
1 x 10⁵ / 8.7 x 105 = 0.115 ml
Medium volume needed in each well
Formula: Volume medium required (ml) = 1.8 - volume of cell suspension
1.8 ml – 0.115 ml = 1.7 ml
Sample data 2: confluency
Well Confluency
(%) before crystal
violet asssay
Confluency
(%) after
crystal violet
assay
Overall stained
appearance of
plate
50 45 Colorless
⊘ This is a preview!⊘
Do you want full access?
Subscribe today to unlock all pages.
Trusted by 1+ million students worldwide
Cell and Molecular Biology: Beta agonists and Antagonists 7
Control 1
Control 2
45 40 Colorless
B1
(a)
90 70 Purple
B1
(b)
95 75 Purple
D4(a) 10 5 Colorless
D4
(b)
5 5 Colorless
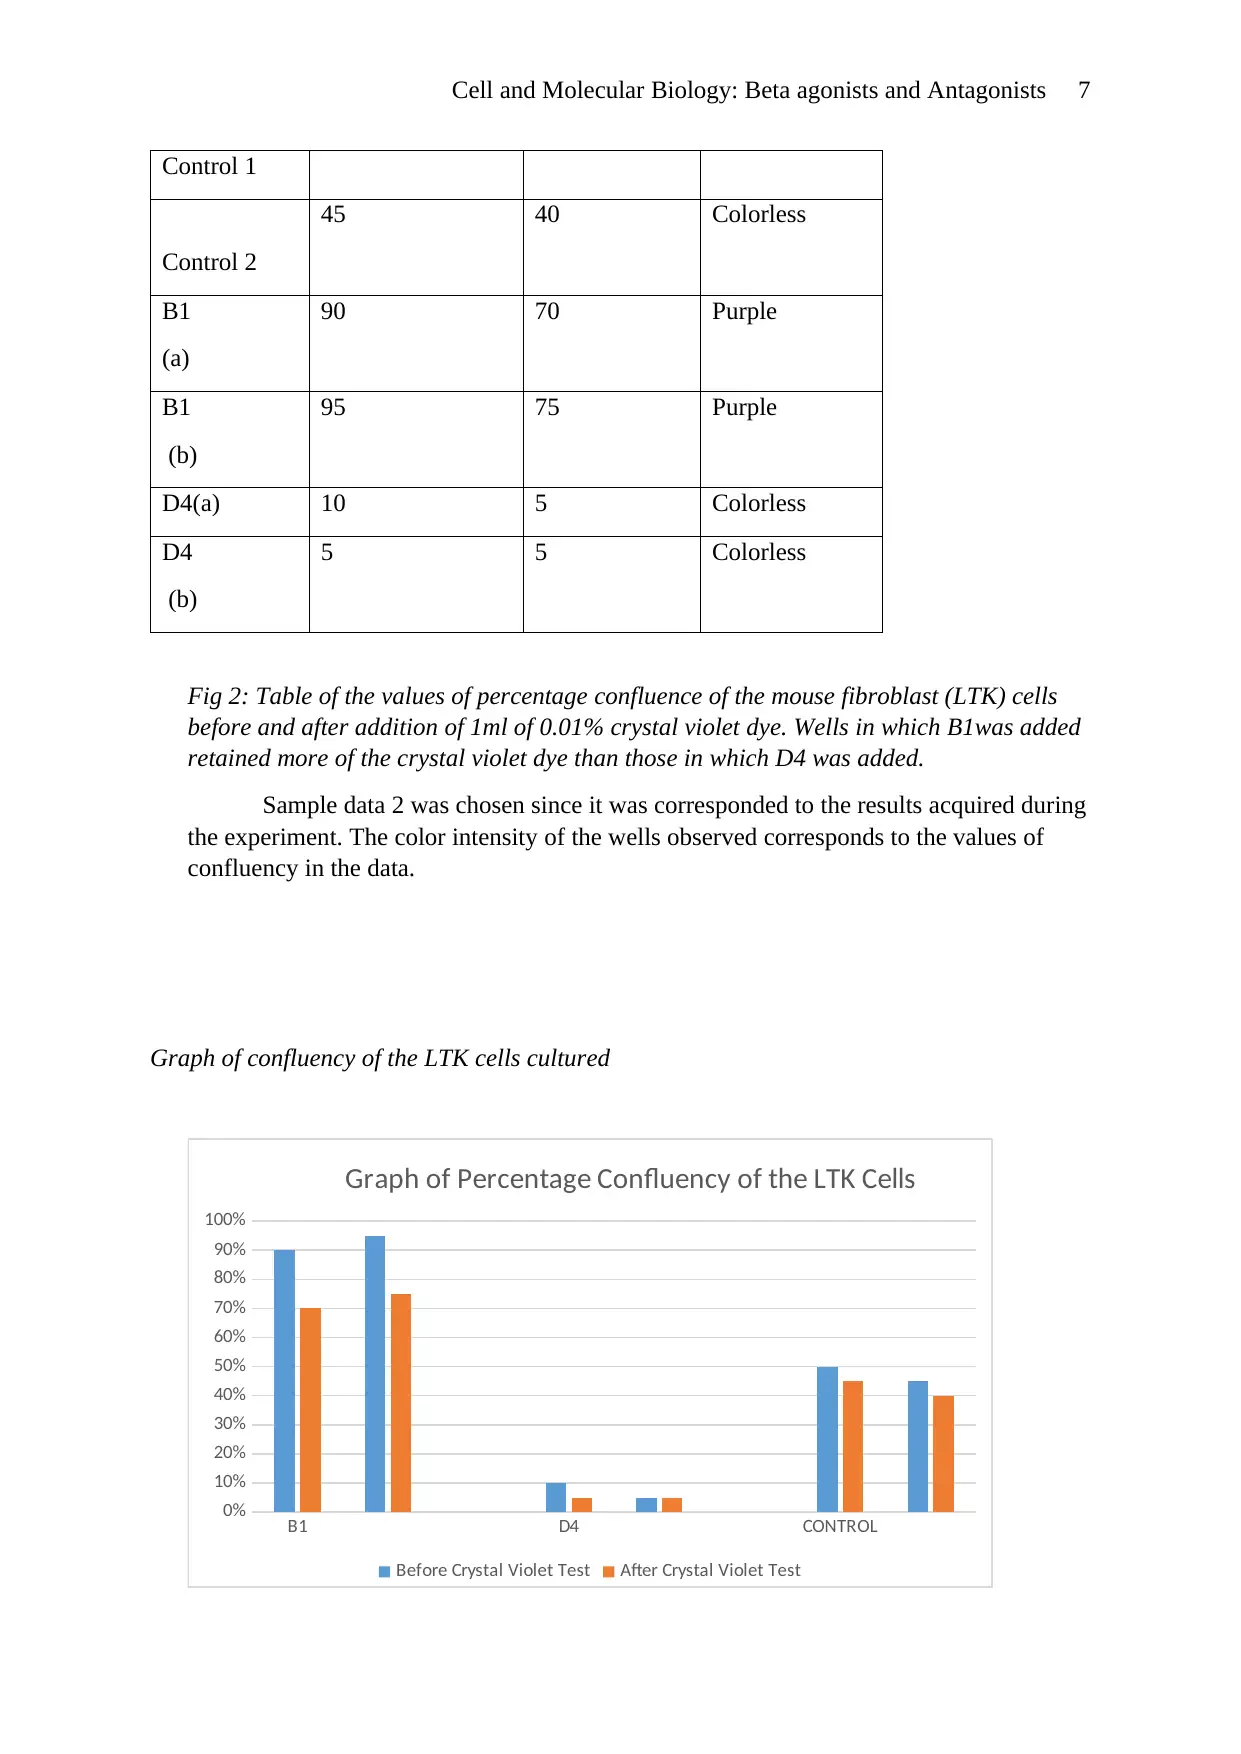
Fig 2: Table of the values of percentage confluence of the mouse fibroblast (LTK) cells
before and after addition of 1ml of 0.01% crystal violet dye. Wells in which B1was added
retained more of the crystal violet dye than those in which D4 was added.
Sample data 2 was chosen since it was corresponded to the results acquired during
the experiment. The color intensity of the wells observed corresponds to the values of
confluency in the data.
Graph of confluency of the LTK cells cultured
B1 D4 CONTROL
0%
10%
20%
30%
40%
50%
60%
70%
80%
90%
100%
Graph of Percentage Confluency of the LTK Cells
Before Crystal Violet Test After Crystal Violet Test
Control 1
Control 2
45 40 Colorless
B1
(a)
90 70 Purple
B1
(b)
95 75 Purple
D4(a) 10 5 Colorless
D4
(b)
5 5 Colorless
Fig 2: Table of the values of percentage confluence of the mouse fibroblast (LTK) cells
before and after addition of 1ml of 0.01% crystal violet dye. Wells in which B1was added
retained more of the crystal violet dye than those in which D4 was added.
Sample data 2 was chosen since it was corresponded to the results acquired during
the experiment. The color intensity of the wells observed corresponds to the values of
confluency in the data.
Graph of confluency of the LTK cells cultured
B1 D4 CONTROL
0%
10%
20%
30%
40%
50%
60%
70%
80%
90%
100%
Graph of Percentage Confluency of the LTK Cells
Before Crystal Violet Test After Crystal Violet Test
Paraphrase This Document
Need a fresh take? Get an instant paraphrase of this document with our AI Paraphraser
Cell and Molecular Biology: Beta agonists and Antagonists 8
Fig 3: Graph of confluency of the mouse fibroblast (LTK) cells exposed to drug B1, drug
D4 and the control which was exposed to phosphate buffered saline (PBS). The
percentage confluence before the tests was higher than that after the tests were
performed for all three.
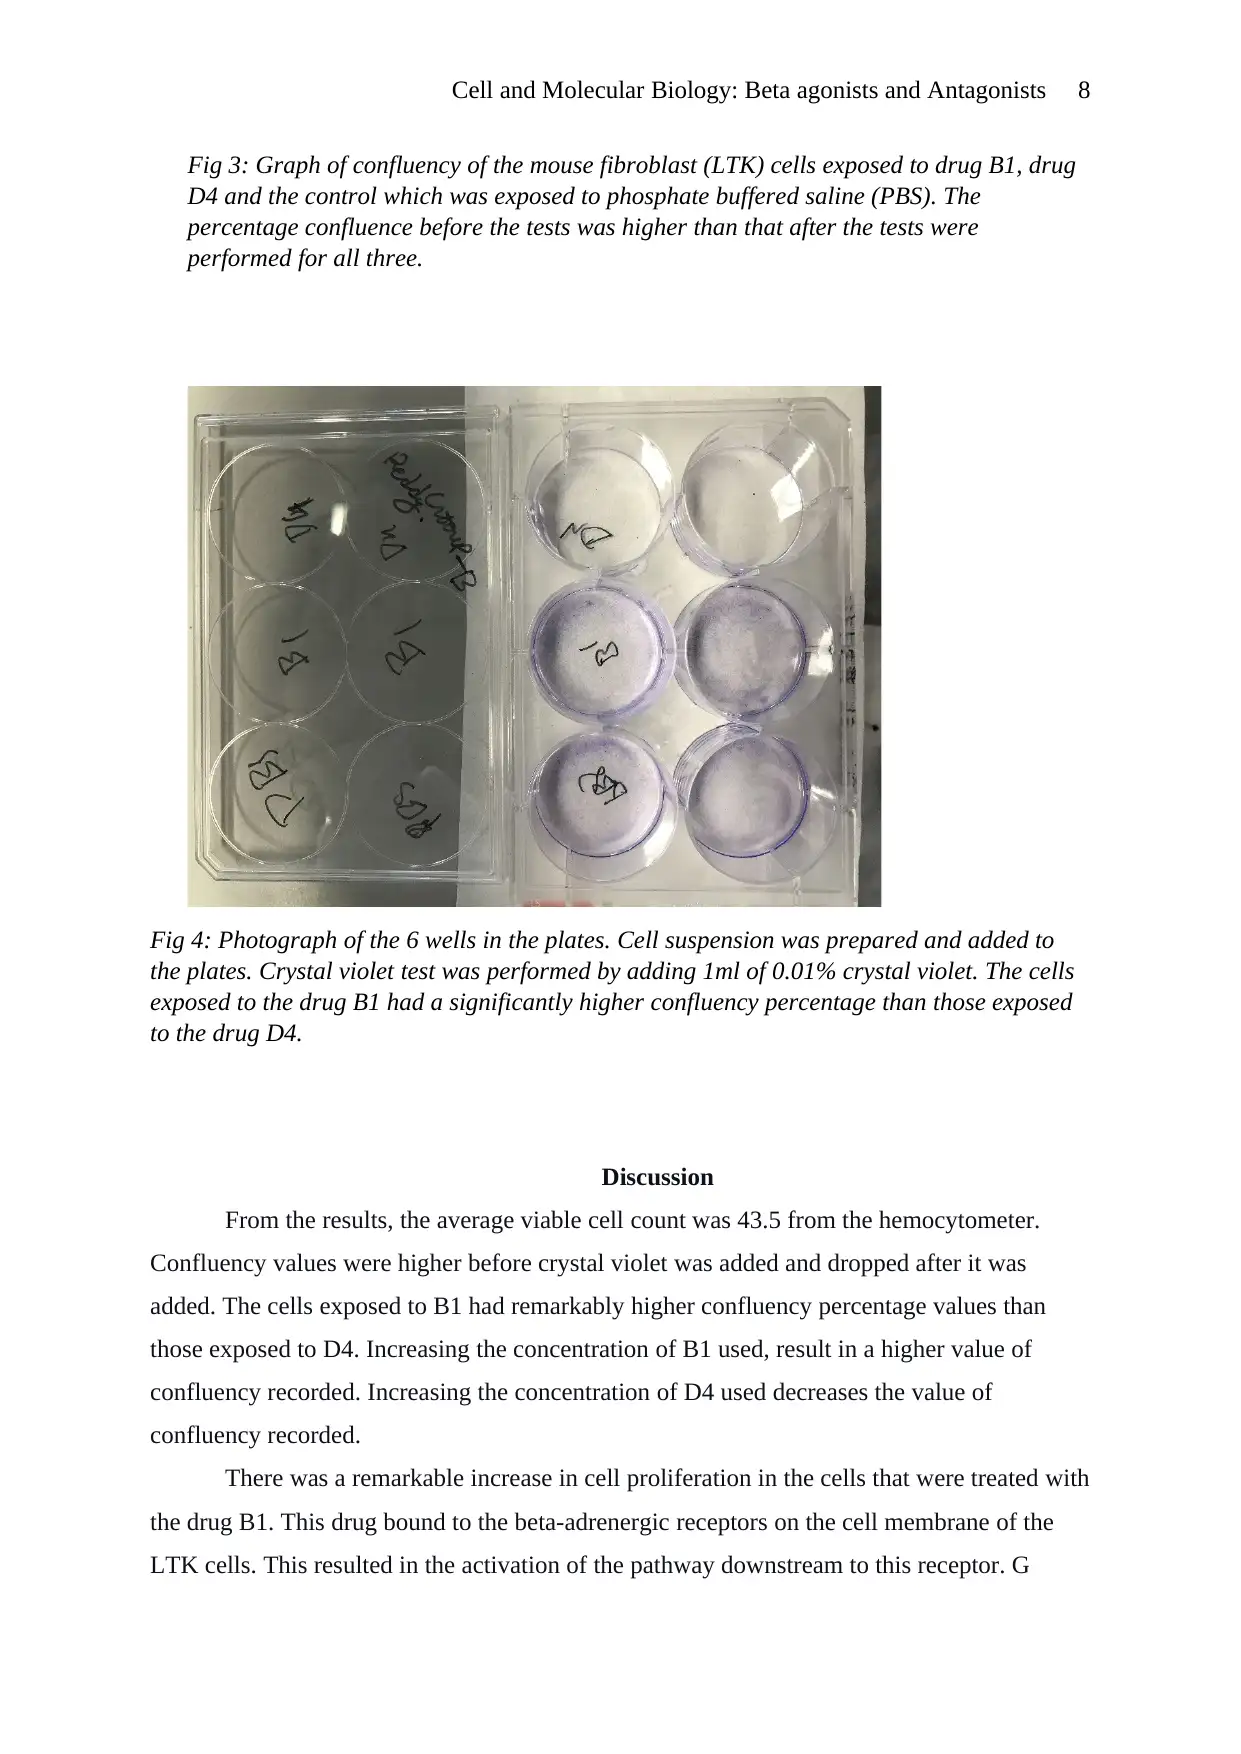
Fig 4: Photograph of the 6 wells in the plates. Cell suspension was prepared and added to
the plates. Crystal violet test was performed by adding 1ml of 0.01% crystal violet. The cells
exposed to the drug B1 had a significantly higher confluency percentage than those exposed
to the drug D4.
Discussion
From the results, the average viable cell count was 43.5 from the hemocytometer.
Confluency values were higher before crystal violet was added and dropped after it was
added. The cells exposed to B1 had remarkably higher confluency percentage values than
those exposed to D4. Increasing the concentration of B1 used, result in a higher value of
confluency recorded. Increasing the concentration of D4 used decreases the value of
confluency recorded.
There was a remarkable increase in cell proliferation in the cells that were treated with
the drug B1. This drug bound to the beta-adrenergic receptors on the cell membrane of the
LTK cells. This resulted in the activation of the pathway downstream to this receptor. G
Fig 3: Graph of confluency of the mouse fibroblast (LTK) cells exposed to drug B1, drug
D4 and the control which was exposed to phosphate buffered saline (PBS). The
percentage confluence before the tests was higher than that after the tests were
performed for all three.
Fig 4: Photograph of the 6 wells in the plates. Cell suspension was prepared and added to
the plates. Crystal violet test was performed by adding 1ml of 0.01% crystal violet. The cells
exposed to the drug B1 had a significantly higher confluency percentage than those exposed
to the drug D4.
Discussion
From the results, the average viable cell count was 43.5 from the hemocytometer.
Confluency values were higher before crystal violet was added and dropped after it was
added. The cells exposed to B1 had remarkably higher confluency percentage values than
those exposed to D4. Increasing the concentration of B1 used, result in a higher value of
confluency recorded. Increasing the concentration of D4 used decreases the value of
confluency recorded.
There was a remarkable increase in cell proliferation in the cells that were treated with
the drug B1. This drug bound to the beta-adrenergic receptors on the cell membrane of the
LTK cells. This resulted in the activation of the pathway downstream to this receptor. G
Cell and Molecular Biology: Beta agonists and Antagonists 9
protein was activated resulting in an exchange of GDP with GTP. This causes the G-alpha
portion to detach from the other subunits (beta and gamma). This subunit activated the
Raf/MEK/ERK pathway by activating the serine/threonine kinase Raf 1. Raf 1 activates
MAP-kinase which in turn activates ERK through phosphorylation. Activated ERK is a
transcription factor that stimulates the transcription of genes necessary for cell proliferation.
Hence the cells exposed to this drug proliferated exponentially, as indicated by the
confluency values. Due to this, we can comfortably label drug B1 as a beta-adrenergic
receptor agonist.
A decline in the quantity of LTK cells exposed to the drug D4 was recorded. D4 can
be labeled as a beta-adrenergic receptor antagonist since no LTK cell growth was observed in
the plates in which this drug was added. This was indicated by the significantly low value
recorded for confluency in these plates. The drug could have acted by the two mechanisms:
competitive and uncompetitive. Competitively it would have bound to the same site as the
stimulatory ligand, preventing its binding and hence stimulation of downstream signaling
pathways that lead to activation of transcription of genes required for cell proliferation.
Uncompetitively, it would have blocked the downstream signaling pathway for activation of
transcription of genes responsible for cell proliferation. The overall outcome of exposing
LTK cells to this drug is a blockage of cell proliferation indicated by the low values of
percentage confluency recorded.
Percentage confluence of the LTK cells declined after performing the crystal violet
test. Since confluency is a percentage of cells covering the surface on which they were
grown, before the test, this confluency may be as a result of both adherent and non-adherent
cells (live and dead cells). During the washing and staining steps, when the procedure is
carried out, the non-adherent cells are washed off. Only adherent cells are left to bind the
crystal violet color through nucleic acid molecules (such as DNA) in the nucleus.
Consequently, the plates with a high number of viable cells will show a characteristic purple
color appearance.
The utilization of the hemocytometer to determine total cell count is a very error-
prone method. Multiple cell counts have to be performed to achieve accurate results. This
presented a limitation on the method used. An alternative method known as the
Luminescence-based assay can be applied to curb this. This method is faster and easier to
perform and the viability of the cells is determined based on their metabolic activity.
Beta-adrenergic receptors blockers have been utilized therapeutically to treat patients
with conditions such as irregular heartbeats, glaucoma, anxiety, angina, high blood pressure,
⊘ This is a preview!⊘
Do you want full access?
Subscribe today to unlock all pages.
Trusted by 1+ million students worldwide
Cell and Molecular Biology: Beta agonists and Antagonists 10
and an overactive thyroid. For most of these medical conditions, these blockers have been
used to inhibit the effects of hormones such as epinephrine and norepinephrine. All of these
conditions have one thing in common, which is that the heart rate needs to be slowed down.
Research is also being conducted for the utilization of these blockers in the treatment of
malignant tumors and cancer.
Conclusion
The agonist of beta-adrenergic receptors was identified as the B1 drug and the
antagonist as the D4 drug.
References
Paraphrase This Document
Need a fresh take? Get an instant paraphrase of this document with our AI Paraphraser
Cell and Molecular Biology: Beta agonists and Antagonists 11
He, J.J., Zhang, W.H., Liu, S.L., Chen, Y.F., Liao, C.X., Shen, Q.Q. and Hu, P., 2017.
Activation of β-adrenergic receptor promotes cellular proliferation in human
glioblastoma. Oncology letters, 14(3), pp.3846-3852.
Wiysonge, C.S., Bradley, H.A., Volmink, J., Mayosi, B.M. and Opie, L.H., 2017. Beta‐
blockers for hypertension. Cochrane database of systematic reviews, (1).
Joassard, O.R., Durieux, A.C. and Freyssenet, D.G., 2013. β2-Adrenergic agonists and the
treatment of skeletal muscle wasting disorders. The international journal of
biochemistry & cell biology, 45(10), pp.2309-2321.
Ring, K.L., Tong, L.M., Balestra, M.E., Javier, R., Andrews-Zwilling, Y., Li, G., Walker, D.,
Zhang, W.R., Kreitzer, A.C. and Huang, Y., 2012. Direct reprogramming of mouse
and human fibroblasts into multipotent neural stem cells with a single factor. Cell
stem cell, 11(1), pp.100-109.
Chen, C., Du, J., Feng, W., Song, Y., Lu, Z., Xu, M., Li, Z. and Zhang, Y., 2012. β‐
Adrenergic receptors stimulate interleukin‐6 production through Epac‐dependent
activation of PKCδ/p38 MAPK signalling in neonatal mouse cardiac
fibroblasts. British journal of pharmacology, 166(2), pp.676-688.
Chruscinski, A.J., Singh, H., Chan, S.M. and Utz, P.J., 2013. Broad-scale phosphoprotein
profiling of beta adrenergic receptor (β-AR) signaling reveals novel phosphorylation
and dephosphorylation events. PloS one, 8(12).
1 out of 11
Related Documents


Your All-in-One AI-Powered Toolkit for Academic Success.
+13062052269
info@desklib.com
Available 24*7 on WhatsApp / Email
![[object Object]](/_next/static/media/star-bottom.7253800d.svg)
Unlock your academic potential
Copyright © 2020–2026 A2Z Services. All Rights Reserved. Developed and managed by ZUCOL.