BFF2401 Commercial Banking & Finance: Australian Banks' Analysis
VerifiedAdded on 2023/06/13
|14
|2989
|364
Report
AI Summary
This report evaluates the performance of the Australian banking industry using DuPont analysis, focusing on four major banks. The study examines the industry's position over the past five years, analyzing trends and predicting future changes in return on equity (ROE). It begins with an explanation of the DuPont model and its application in evaluating net profit margin, financial leverage, and asset turnover. The ROE of each of the four banks is calculated and compared, followed by an analysis of the industry's performance based on key metrics such as leverage multiplier, return on assets, asset utilization, and net profit margin. The report concludes with predictions about future trends in the Australian banking industry's ROE, highlighting the factors driving performance and potential risks.
Running Head: Commercial Banking and Finance
1
Project Report: Commercial Banking and Finance
1
Project Report: Commercial Banking and Finance
Paraphrase This Document
Need a fresh take? Get an instant paraphrase of this document with our AI Paraphraser
Commercial Banking and Finance 2
Contents
Introduction.......................................................................................................................3
DuPont analysis................................................................................................................3
Return on equity...........................................................................................................4
Leverage multiplier.......................................................................................................4
Return on assets............................................................................................................5
Asset utilization............................................................................................................5
Net profit margin..........................................................................................................5
Calculations of DuPont analysis.......................................................................................6
Analysis of bank industry of Australia.............................................................................7
Return on equity...........................................................................................................7
Leverage multiplier.......................................................................................................8
Return on assets............................................................................................................8
Net profit margin..........................................................................................................9
Asset utilization..........................................................................................................10
Prediction about Australian Bank industry’s ROE.........................................................11
Conclusion......................................................................................................................11
References.......................................................................................................................12
Commercial Banking and Finance 3
Introduction:
The report has been prepared t evaluate the current performance of Australian bank
industry. In the report four main banks of Australia has been evaluated and the study has been
conducted on the DuPont analysis. The study explains about the industry position in last 5
years as well as it concentrates on the future trend of the Australian banking industry. In the
report, firstly, DuPont has been studied and it has been evaluated that how this model works
in an organization. Further, the 4 banks of Australia have been evaluated and the return on
equity of all the 4 banks has been calculated. Lastly, the analysis of last 5 years has been done
as well as future changes into the return on equity of the industry have also been measured.
DuPont analysis:
DuPont analysis is a way to calculate the return on equity of an organization. It
evaluates the net profit margin, financial leverage and assets turnover of an organization and
measures the total return in equity of an organization. DuPont method has been used by the
DuPont Corporation firstly; the main motto behind this analysis is to evaluate the reason
behind lower ROE. In this model, the return on equity is evaluated on the basis of total assets,
total equity, sales revenue, net profit etc of the company and it is measured that which factors
is impacting on the return on equity of an organization. The main components of return on
equity are as follows:
Figure 1: DuPont Components
⊘ This is a preview!⊘
Do you want full access?
Subscribe today to unlock all pages.
Trusted by 1+ million students worldwide
Commercial Banking and Finance 4
(Arnold, 2013)
The DuPont components brief about the return on equity which is calculated on the
basis of leverage multiplier and the return on assets of the organization. On the other hand,
the return on assets could be calculated on the basis of asset utilization and net profit margin.
The explanation of each component is as follows:
Return on equity:
Return on equity is an investment ratio which evaluates that how much profits are
generated by the company on the basis of its equity. It explains that how much could be paid
by the company to its shareholders. The return on equity of various companies could be
evaluated by the investors to make a better choice of investment companies. Return on equity
explains that the better the ratios of return on equity is the better the investment position of an
organization would be. Formula of return on equity of the company is as follows:
Return on equity = Net income / Equity (Lord, 2007)
In DuPont analysis, return on equity is the main outcome of the analysis. The model
evaluates the position of the company on various factors. In DuPont analysis, the formula of
return on equity is as follows:
Return on equity = (Total assets / total equity) * (Revenue / total assets) * (Net income / total
revenue)
It explains that the few changes into the above factors would directly make an impact
on the return one equity position of an organization.
Leverage multiplier:
Leverage multiplier is a structure ratio which evaluates that how much assets are hold
by the company on the basis of its equity. It explains that how much assets should be
maintained by the company to lower the risk position and the performance of the company.
The leverage multiplier of an organization could be evaluated on the basis of its industry by
the investors to make a better choice of investment companies. Leverage multiplied explains
that the better the ratios of leverage multiplier is the better the investment position of an
organization would be. Formula of leverage multiplier of the company is as follows:
Leverage multiplier = Total assets / total equity (Madhura, 2011)
Paraphrase This Document
Need a fresh take? Get an instant paraphrase of this document with our AI Paraphraser
Commercial Banking and Finance 5
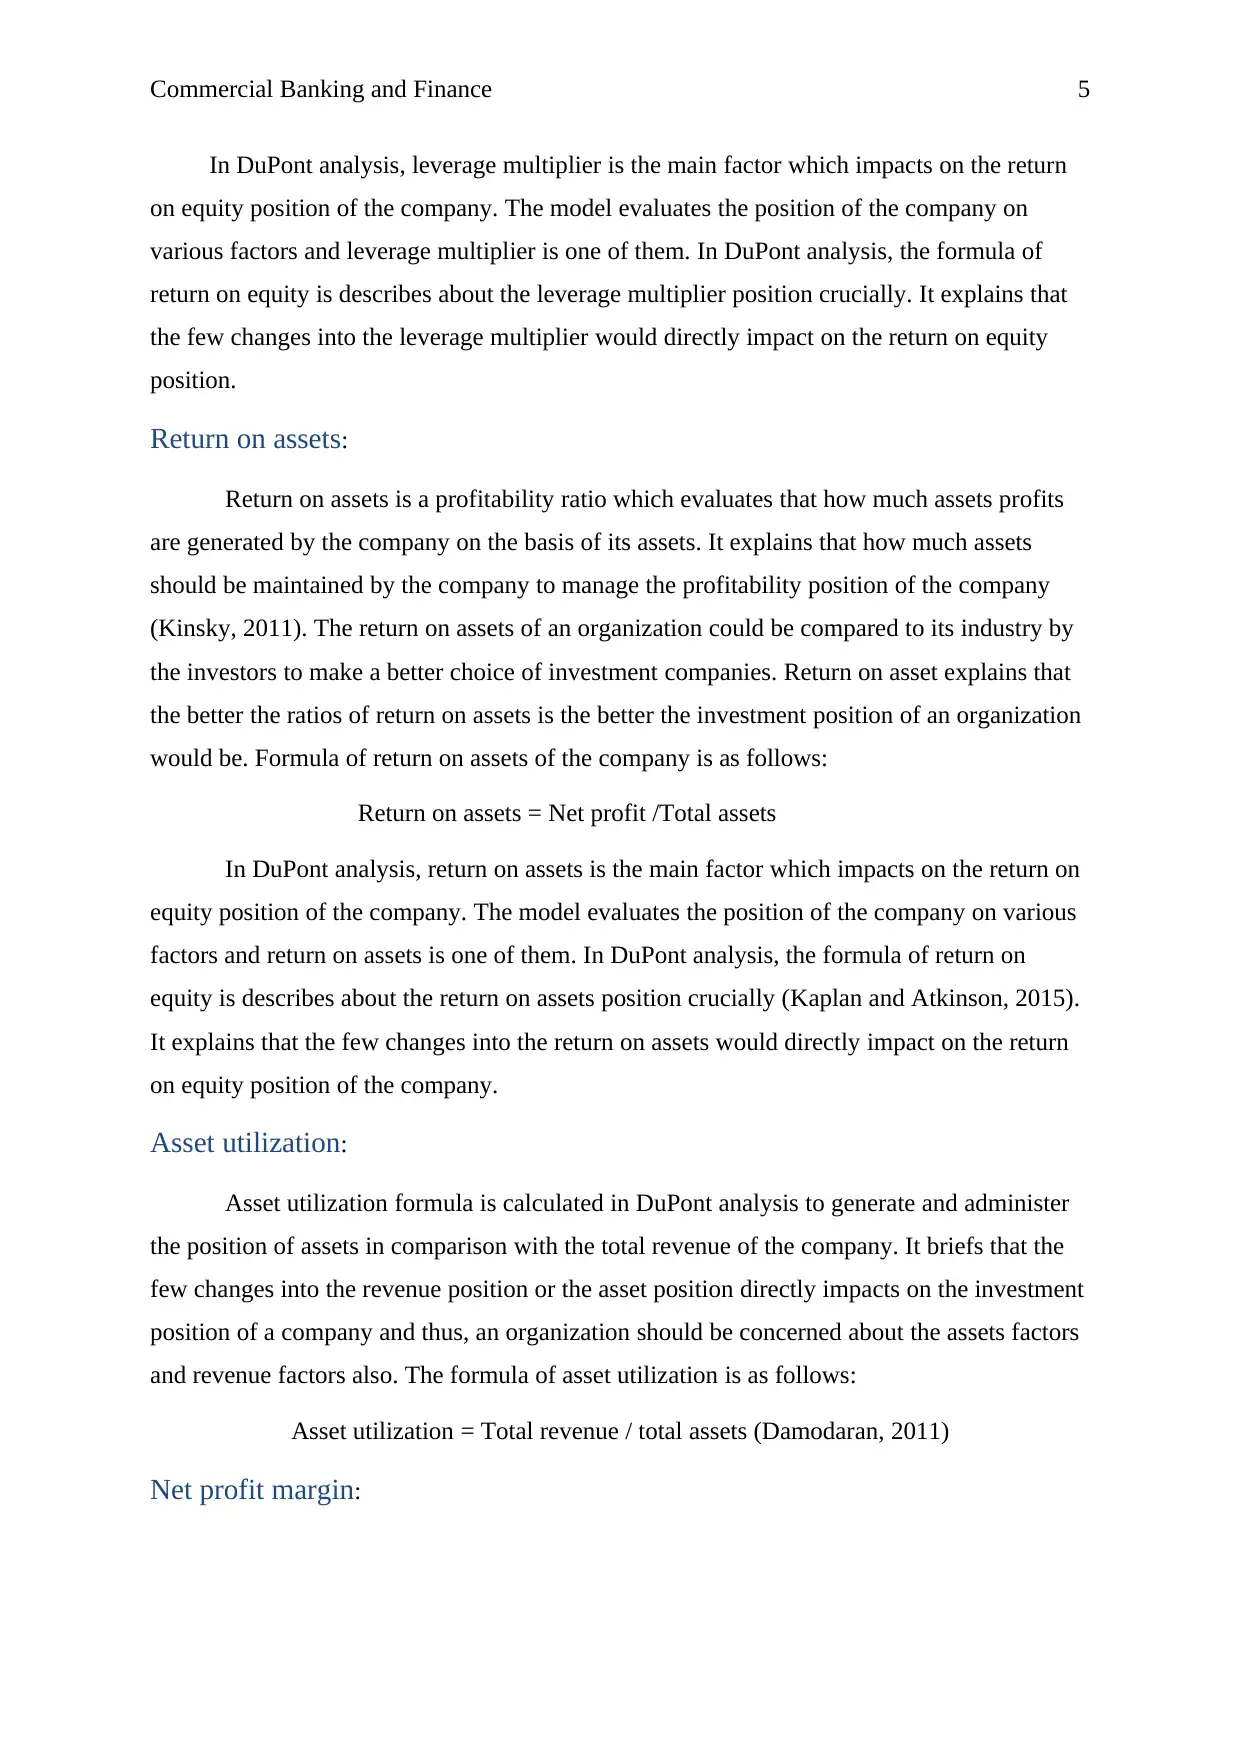
In DuPont analysis, leverage multiplier is the main factor which impacts on the return
on equity position of the company. The model evaluates the position of the company on
various factors and leverage multiplier is one of them. In DuPont analysis, the formula of
return on equity is describes about the leverage multiplier position crucially. It explains that
the few changes into the leverage multiplier would directly impact on the return on equity
position.
Return on assets:
Return on assets is a profitability ratio which evaluates that how much assets profits
are generated by the company on the basis of its assets. It explains that how much assets
should be maintained by the company to manage the profitability position of the company
(Kinsky, 2011). The return on assets of an organization could be compared to its industry by
the investors to make a better choice of investment companies. Return on asset explains that
the better the ratios of return on assets is the better the investment position of an organization
would be. Formula of return on assets of the company is as follows:
Return on assets = Net profit /Total assets
In DuPont analysis, return on assets is the main factor which impacts on the return on
equity position of the company. The model evaluates the position of the company on various
factors and return on assets is one of them. In DuPont analysis, the formula of return on
equity is describes about the return on assets position crucially (Kaplan and Atkinson, 2015).
It explains that the few changes into the return on assets would directly impact on the return
on equity position of the company.
Asset utilization:
Asset utilization formula is calculated in DuPont analysis to generate and administer
the position of assets in comparison with the total revenue of the company. It briefs that the
few changes into the revenue position or the asset position directly impacts on the investment
position of a company and thus, an organization should be concerned about the assets factors
and revenue factors also. The formula of asset utilization is as follows:
Asset utilization = Total revenue / total assets (Damodaran, 2011)
Net profit margin:
Commercial Banking and Finance 6
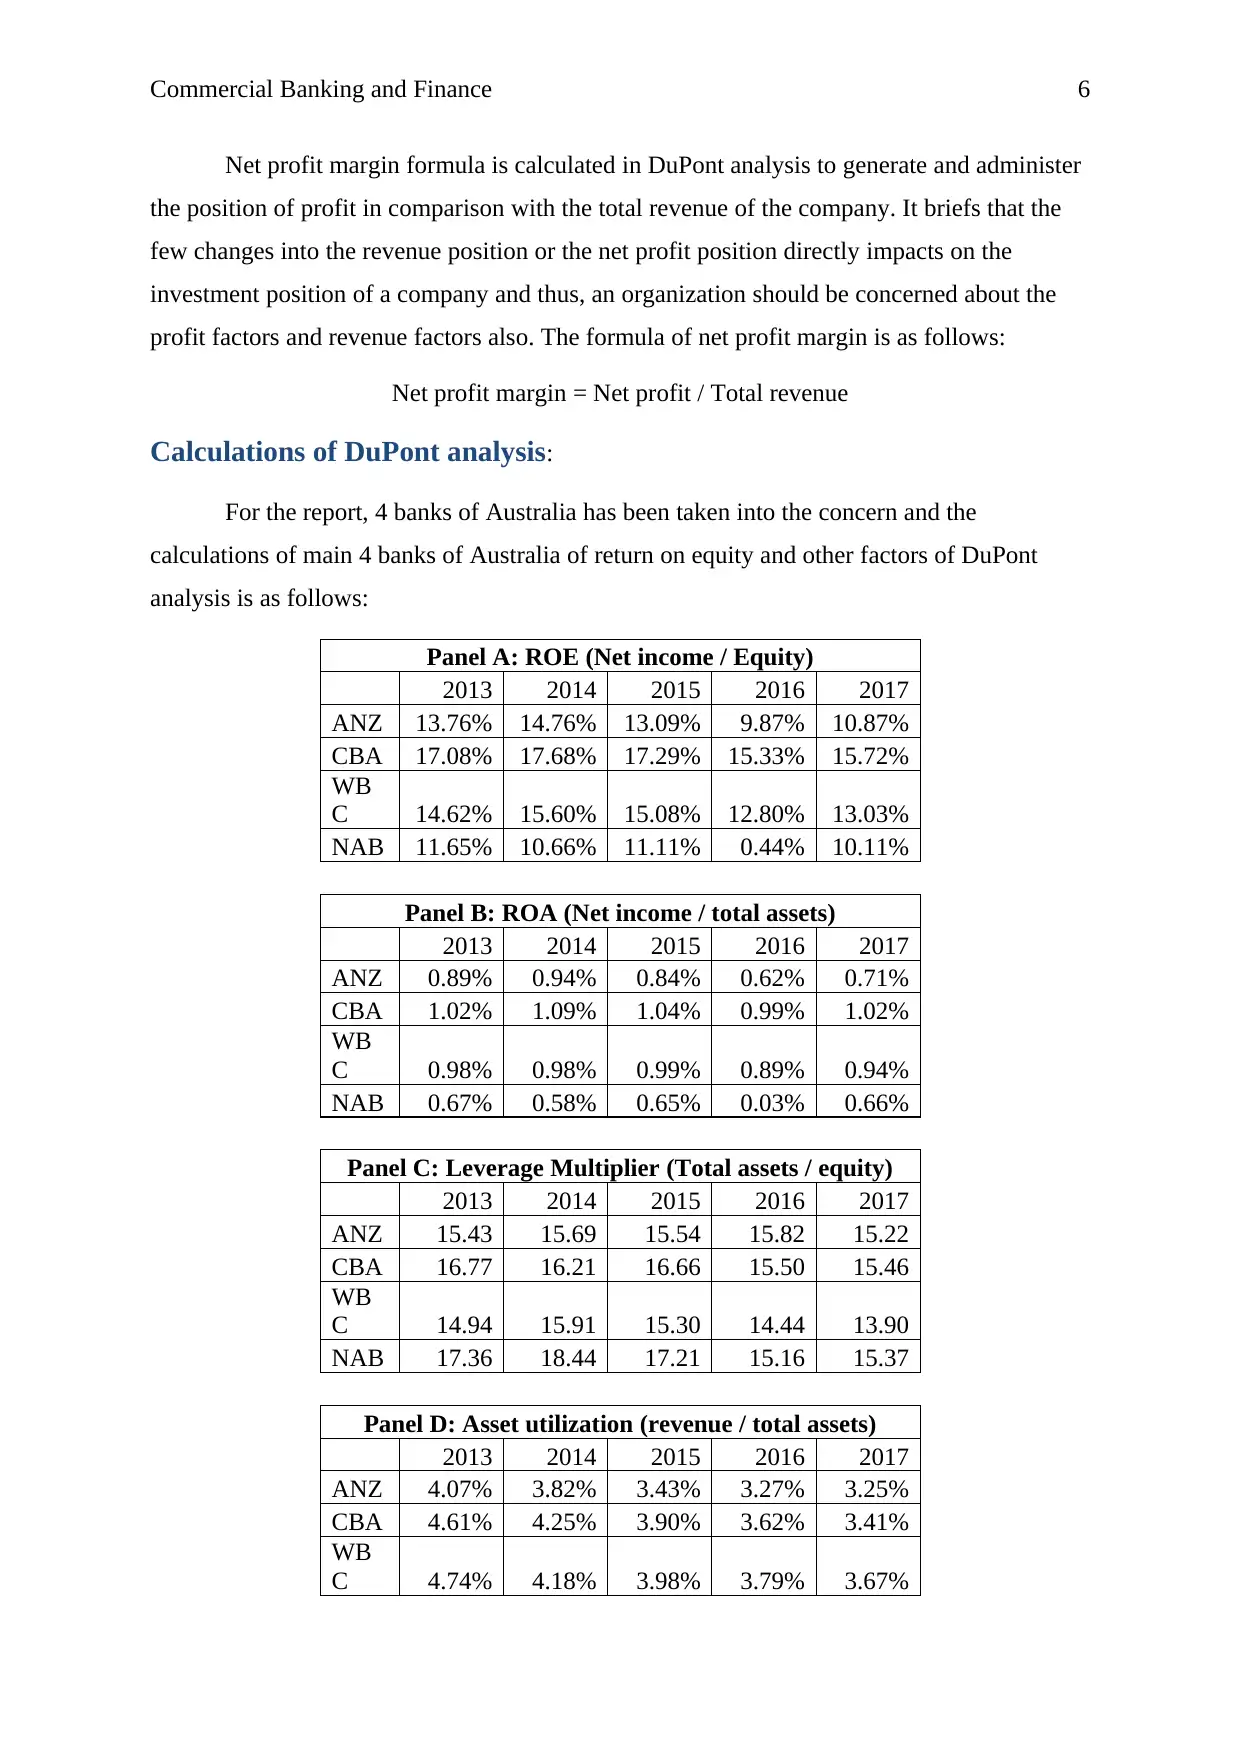
Net profit margin formula is calculated in DuPont analysis to generate and administer
the position of profit in comparison with the total revenue of the company. It briefs that the
few changes into the revenue position or the net profit position directly impacts on the
investment position of a company and thus, an organization should be concerned about the
profit factors and revenue factors also. The formula of net profit margin is as follows:
Net profit margin = Net profit / Total revenue
Calculations of DuPont analysis:
For the report, 4 banks of Australia has been taken into the concern and the
calculations of main 4 banks of Australia of return on equity and other factors of DuPont
analysis is as follows:
Panel A: ROE (Net income / Equity)
2013 2014 2015 2016 2017
ANZ 13.76% 14.76% 13.09% 9.87% 10.87%
CBA 17.08% 17.68% 17.29% 15.33% 15.72%
WB
C 14.62% 15.60% 15.08% 12.80% 13.03%
NAB 11.65% 10.66% 11.11% 0.44% 10.11%
Panel B: ROA (Net income / total assets)
2013 2014 2015 2016 2017
ANZ 0.89% 0.94% 0.84% 0.62% 0.71%
CBA 1.02% 1.09% 1.04% 0.99% 1.02%
WB
C 0.98% 0.98% 0.99% 0.89% 0.94%
NAB 0.67% 0.58% 0.65% 0.03% 0.66%
Panel C: Leverage Multiplier (Total assets / equity)
2013 2014 2015 2016 2017
ANZ 15.43 15.69 15.54 15.82 15.22
CBA 16.77 16.21 16.66 15.50 15.46
WB
C 14.94 15.91 15.30 14.44 13.90
NAB 17.36 18.44 17.21 15.16 15.37
Panel D: Asset utilization (revenue / total assets)
2013 2014 2015 2016 2017
ANZ 4.07% 3.82% 3.43% 3.27% 3.25%
CBA 4.61% 4.25% 3.90% 3.62% 3.41%
WB
C 4.74% 4.18% 3.98% 3.79% 3.67%
⊘ This is a preview!⊘
Do you want full access?
Subscribe today to unlock all pages.
Trusted by 1+ million students worldwide
Commercial Banking and Finance 7
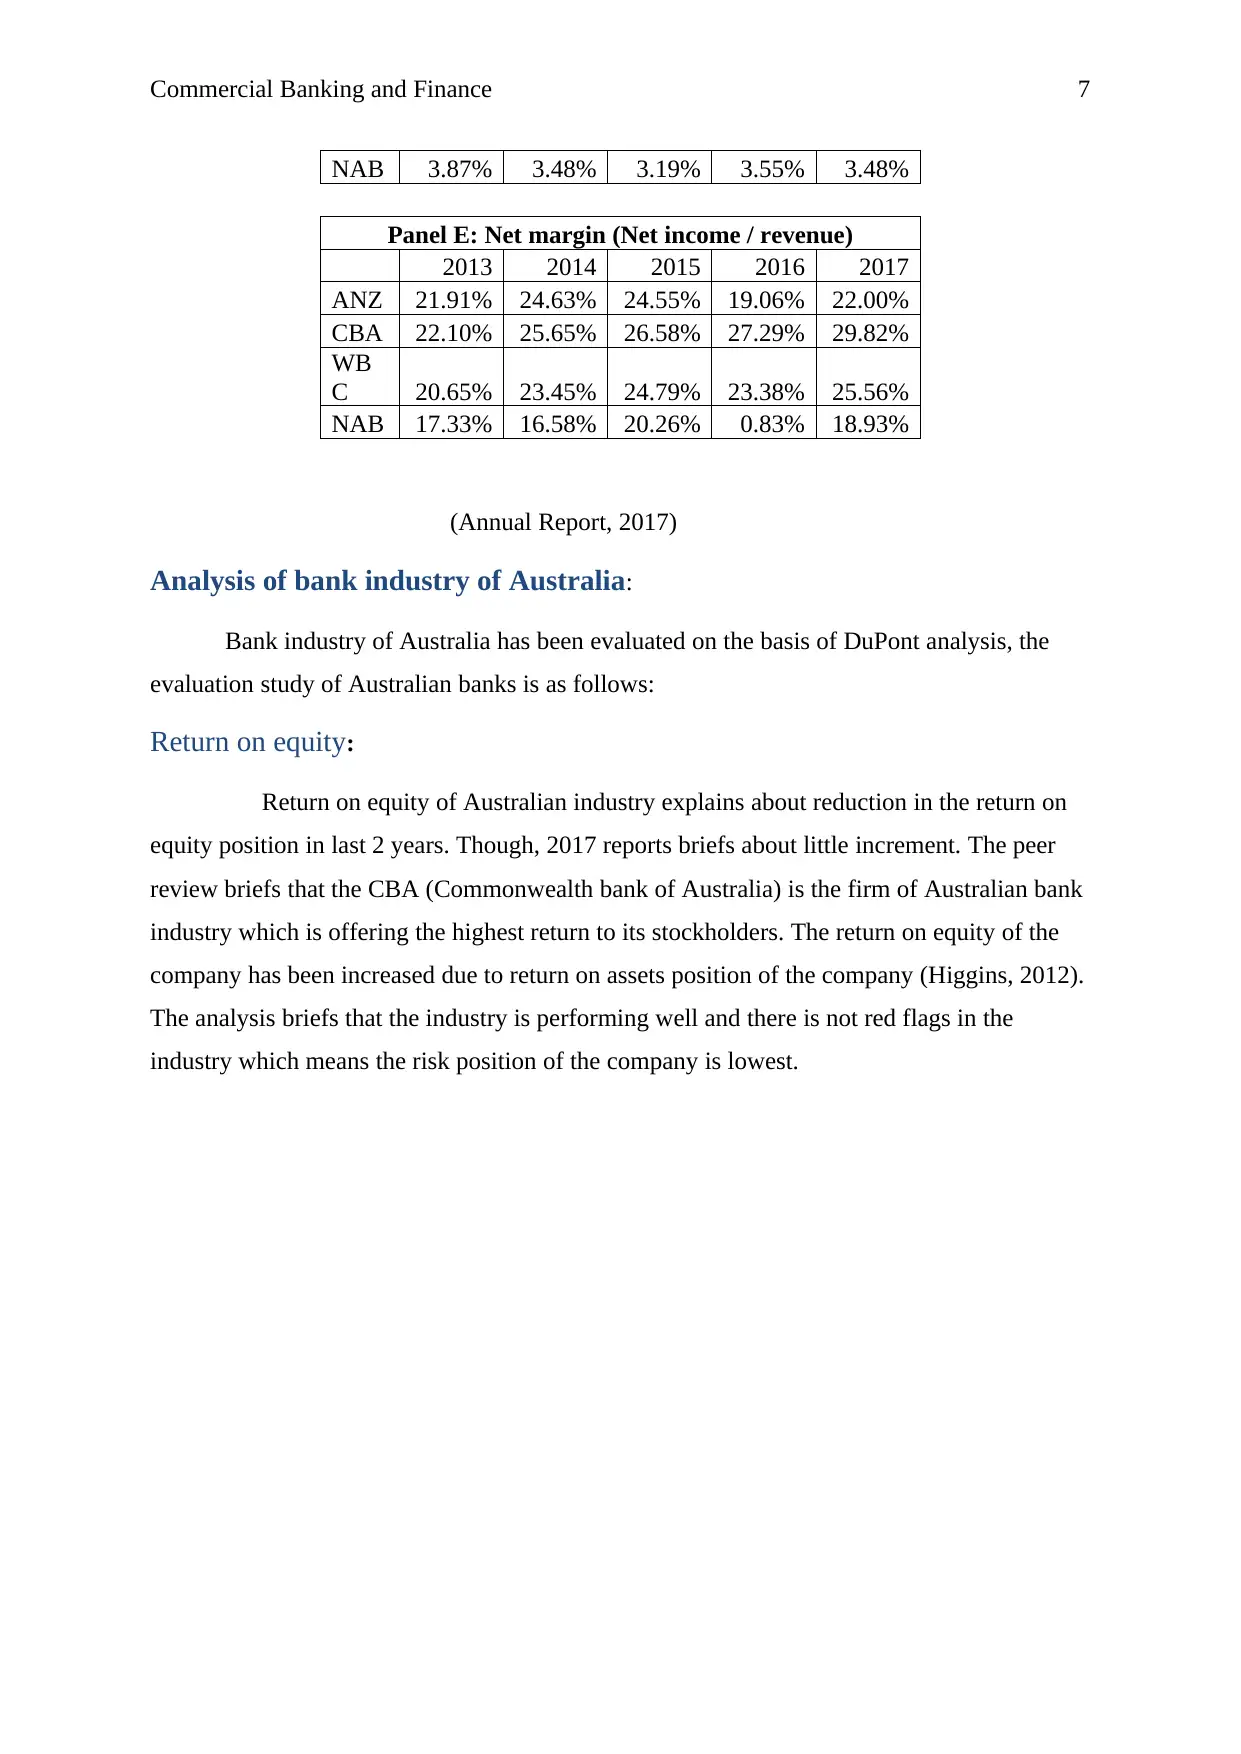
NAB 3.87% 3.48% 3.19% 3.55% 3.48%
Panel E: Net margin (Net income / revenue)
2013 2014 2015 2016 2017
ANZ 21.91% 24.63% 24.55% 19.06% 22.00%
CBA 22.10% 25.65% 26.58% 27.29% 29.82%
WB
C 20.65% 23.45% 24.79% 23.38% 25.56%
NAB 17.33% 16.58% 20.26% 0.83% 18.93%
(Annual Report, 2017)
Analysis of bank industry of Australia:
Bank industry of Australia has been evaluated on the basis of DuPont analysis, the
evaluation study of Australian banks is as follows:
Return on equity:
Return on equity of Australian industry explains about reduction in the return on
equity position in last 2 years. Though, 2017 reports briefs about little increment. The peer
review briefs that the CBA (Commonwealth bank of Australia) is the firm of Australian bank
industry which is offering the highest return to its stockholders. The return on equity of the
company has been increased due to return on assets position of the company (Higgins, 2012).
The analysis briefs that the industry is performing well and there is not red flags in the
industry which means the risk position of the company is lowest.
Paraphrase This Document
Need a fresh take? Get an instant paraphrase of this document with our AI Paraphraser
Commercial Banking and Finance 8
2013 2014 2015 2016 2017
0.00%
2.00%
4.00%
6.00%
8.00%
10.00%
12.00%
14.00%
16.00%
18.00%
20.00%
Return on equity
ANZ
CBA
WBC
NAB
Return
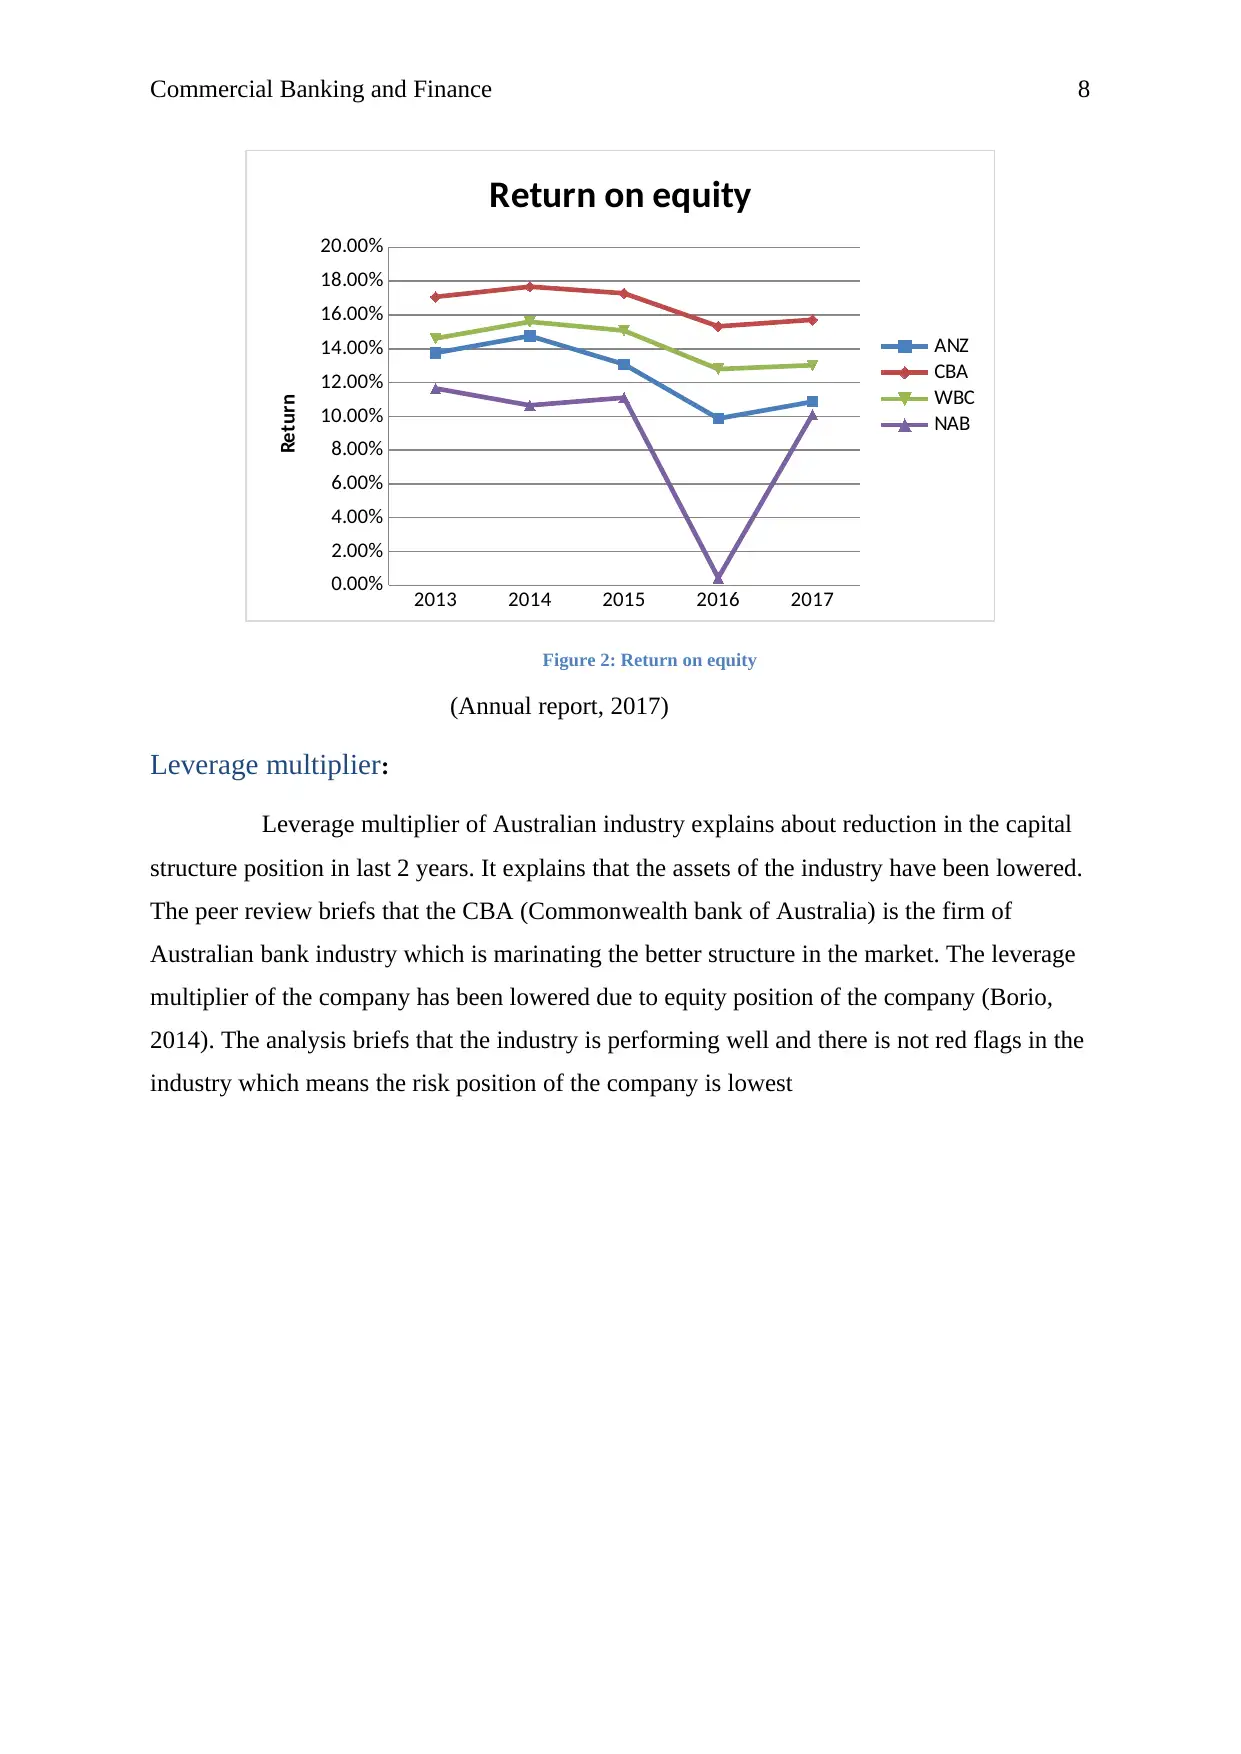
Figure 2: Return on equity
(Annual report, 2017)
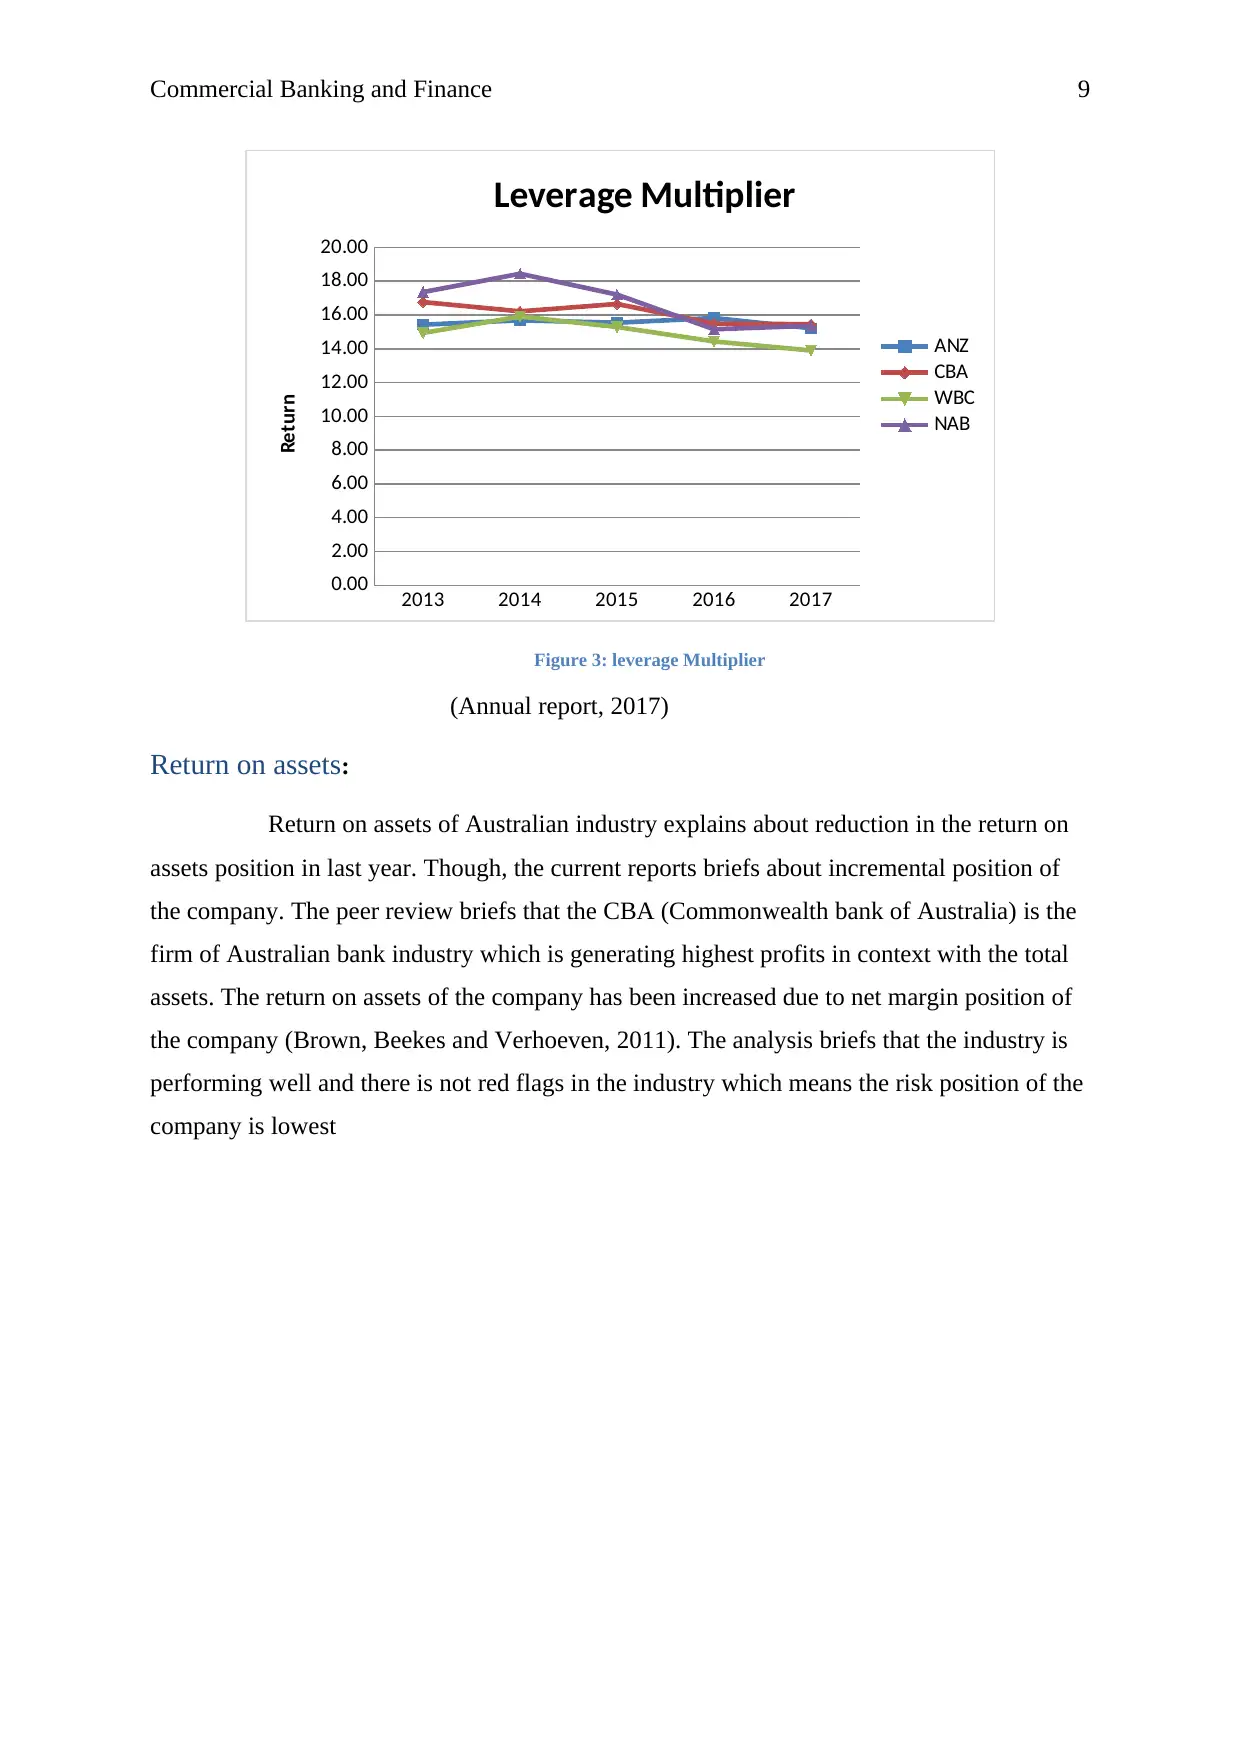
Leverage multiplier:
Leverage multiplier of Australian industry explains about reduction in the capital
structure position in last 2 years. It explains that the assets of the industry have been lowered.
The peer review briefs that the CBA (Commonwealth bank of Australia) is the firm of
Australian bank industry which is marinating the better structure in the market. The leverage
multiplier of the company has been lowered due to equity position of the company (Borio,
2014). The analysis briefs that the industry is performing well and there is not red flags in the
industry which means the risk position of the company is lowest
2013 2014 2015 2016 2017
0.00%
2.00%
4.00%
6.00%
8.00%
10.00%
12.00%
14.00%
16.00%
18.00%
20.00%
Return on equity
ANZ
CBA
WBC
NAB
Return
Figure 2: Return on equity
(Annual report, 2017)
Leverage multiplier:
Leverage multiplier of Australian industry explains about reduction in the capital
structure position in last 2 years. It explains that the assets of the industry have been lowered.
The peer review briefs that the CBA (Commonwealth bank of Australia) is the firm of
Australian bank industry which is marinating the better structure in the market. The leverage
multiplier of the company has been lowered due to equity position of the company (Borio,
2014). The analysis briefs that the industry is performing well and there is not red flags in the
industry which means the risk position of the company is lowest
Commercial Banking and Finance 9
2013 2014 2015 2016 2017
0.00
2.00
4.00
6.00
8.00
10.00
12.00
14.00
16.00
18.00
20.00
Leverage Multiplier
ANZ
CBA
WBC
NAB
Return
Figure 3: leverage Multiplier
(Annual report, 2017)
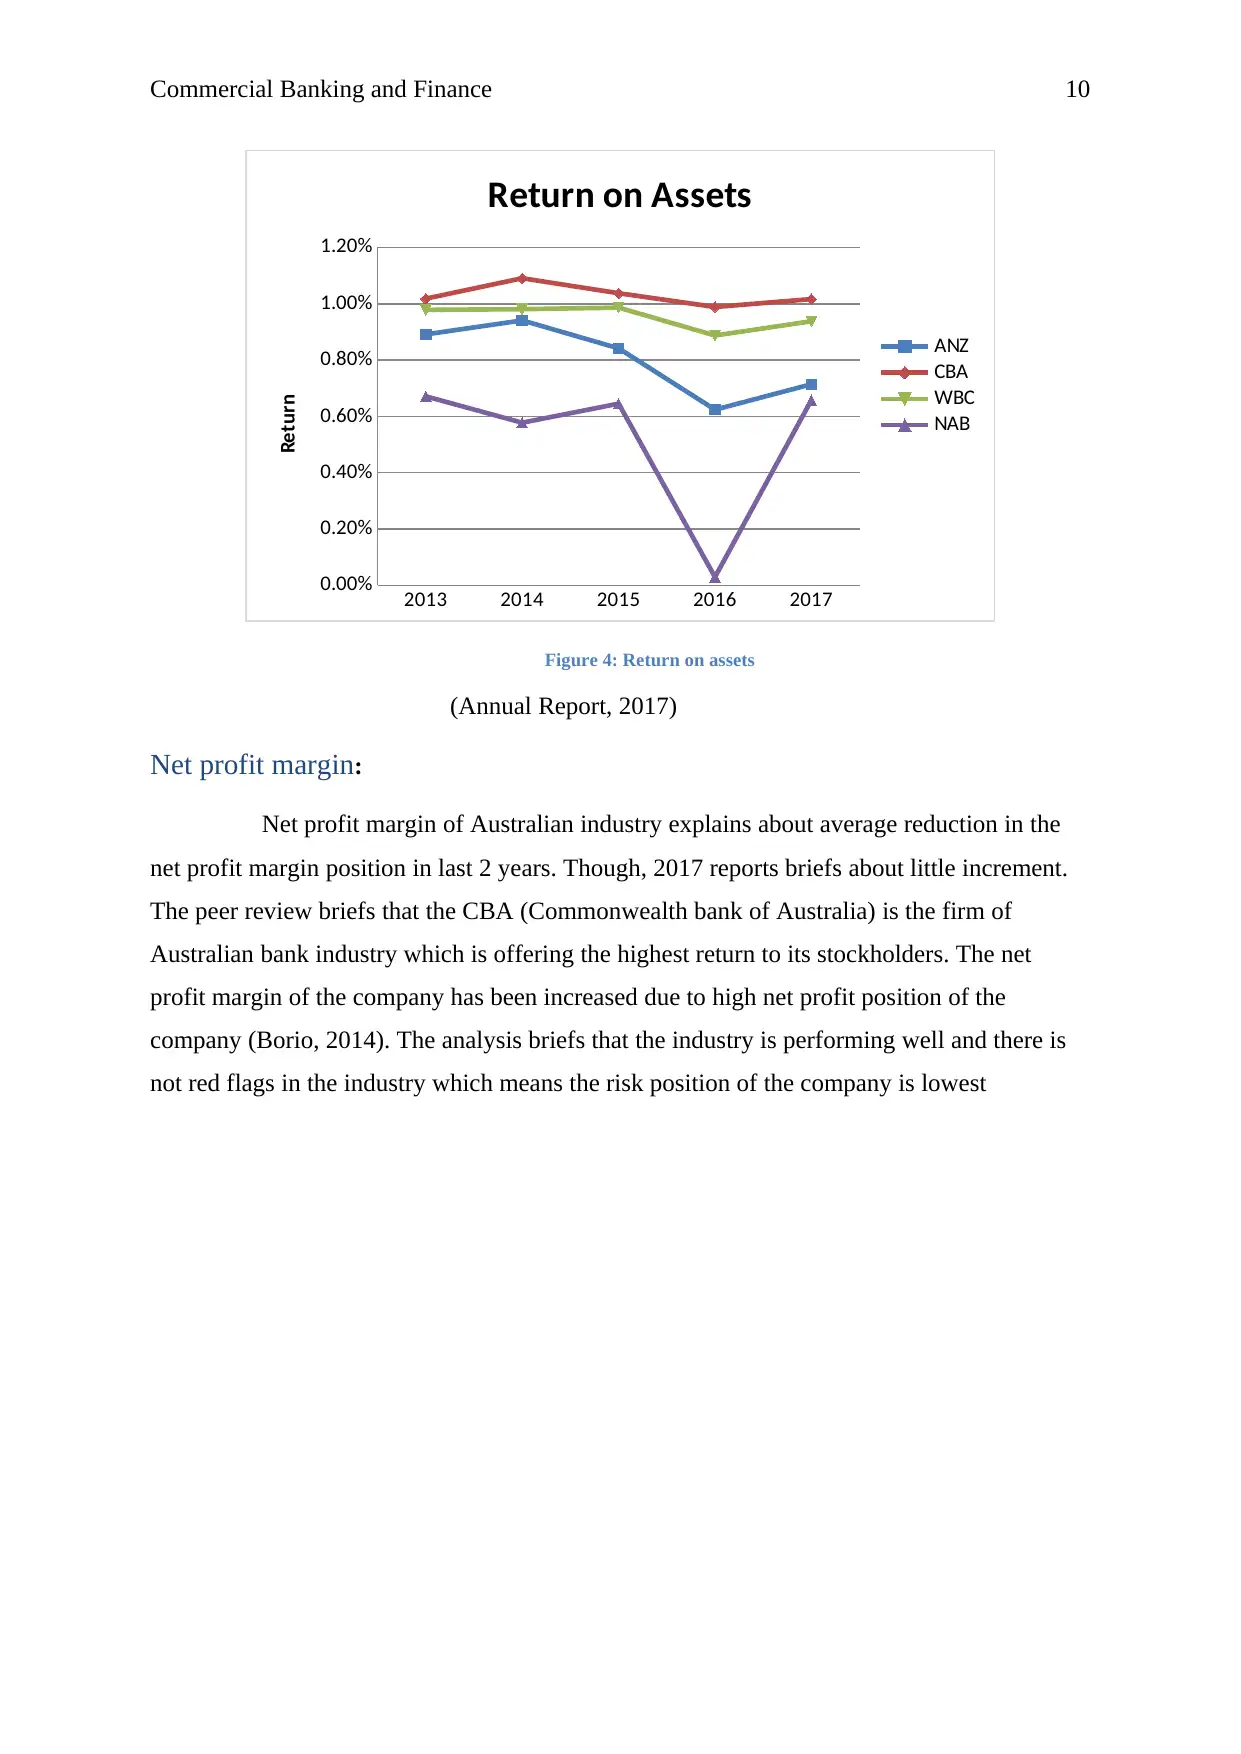
Return on assets:
Return on assets of Australian industry explains about reduction in the return on
assets position in last year. Though, the current reports briefs about incremental position of
the company. The peer review briefs that the CBA (Commonwealth bank of Australia) is the
firm of Australian bank industry which is generating highest profits in context with the total
assets. The return on assets of the company has been increased due to net margin position of
the company (Brown, Beekes and Verhoeven, 2011). The analysis briefs that the industry is
performing well and there is not red flags in the industry which means the risk position of the
company is lowest
2013 2014 2015 2016 2017
0.00
2.00
4.00
6.00
8.00
10.00
12.00
14.00
16.00
18.00
20.00
Leverage Multiplier
ANZ
CBA
WBC
NAB
Return
Figure 3: leverage Multiplier
(Annual report, 2017)
Return on assets:
Return on assets of Australian industry explains about reduction in the return on
assets position in last year. Though, the current reports briefs about incremental position of
the company. The peer review briefs that the CBA (Commonwealth bank of Australia) is the
firm of Australian bank industry which is generating highest profits in context with the total
assets. The return on assets of the company has been increased due to net margin position of
the company (Brown, Beekes and Verhoeven, 2011). The analysis briefs that the industry is
performing well and there is not red flags in the industry which means the risk position of the
company is lowest
⊘ This is a preview!⊘
Do you want full access?
Subscribe today to unlock all pages.
Trusted by 1+ million students worldwide
Commercial Banking and Finance 10
2013 2014 2015 2016 2017
0.00%
0.20%
0.40%
0.60%
0.80%
1.00%
1.20%
Return on Assets
ANZ
CBA
WBC
NAB
Return
Figure 4: Return on assets
(Annual Report, 2017)
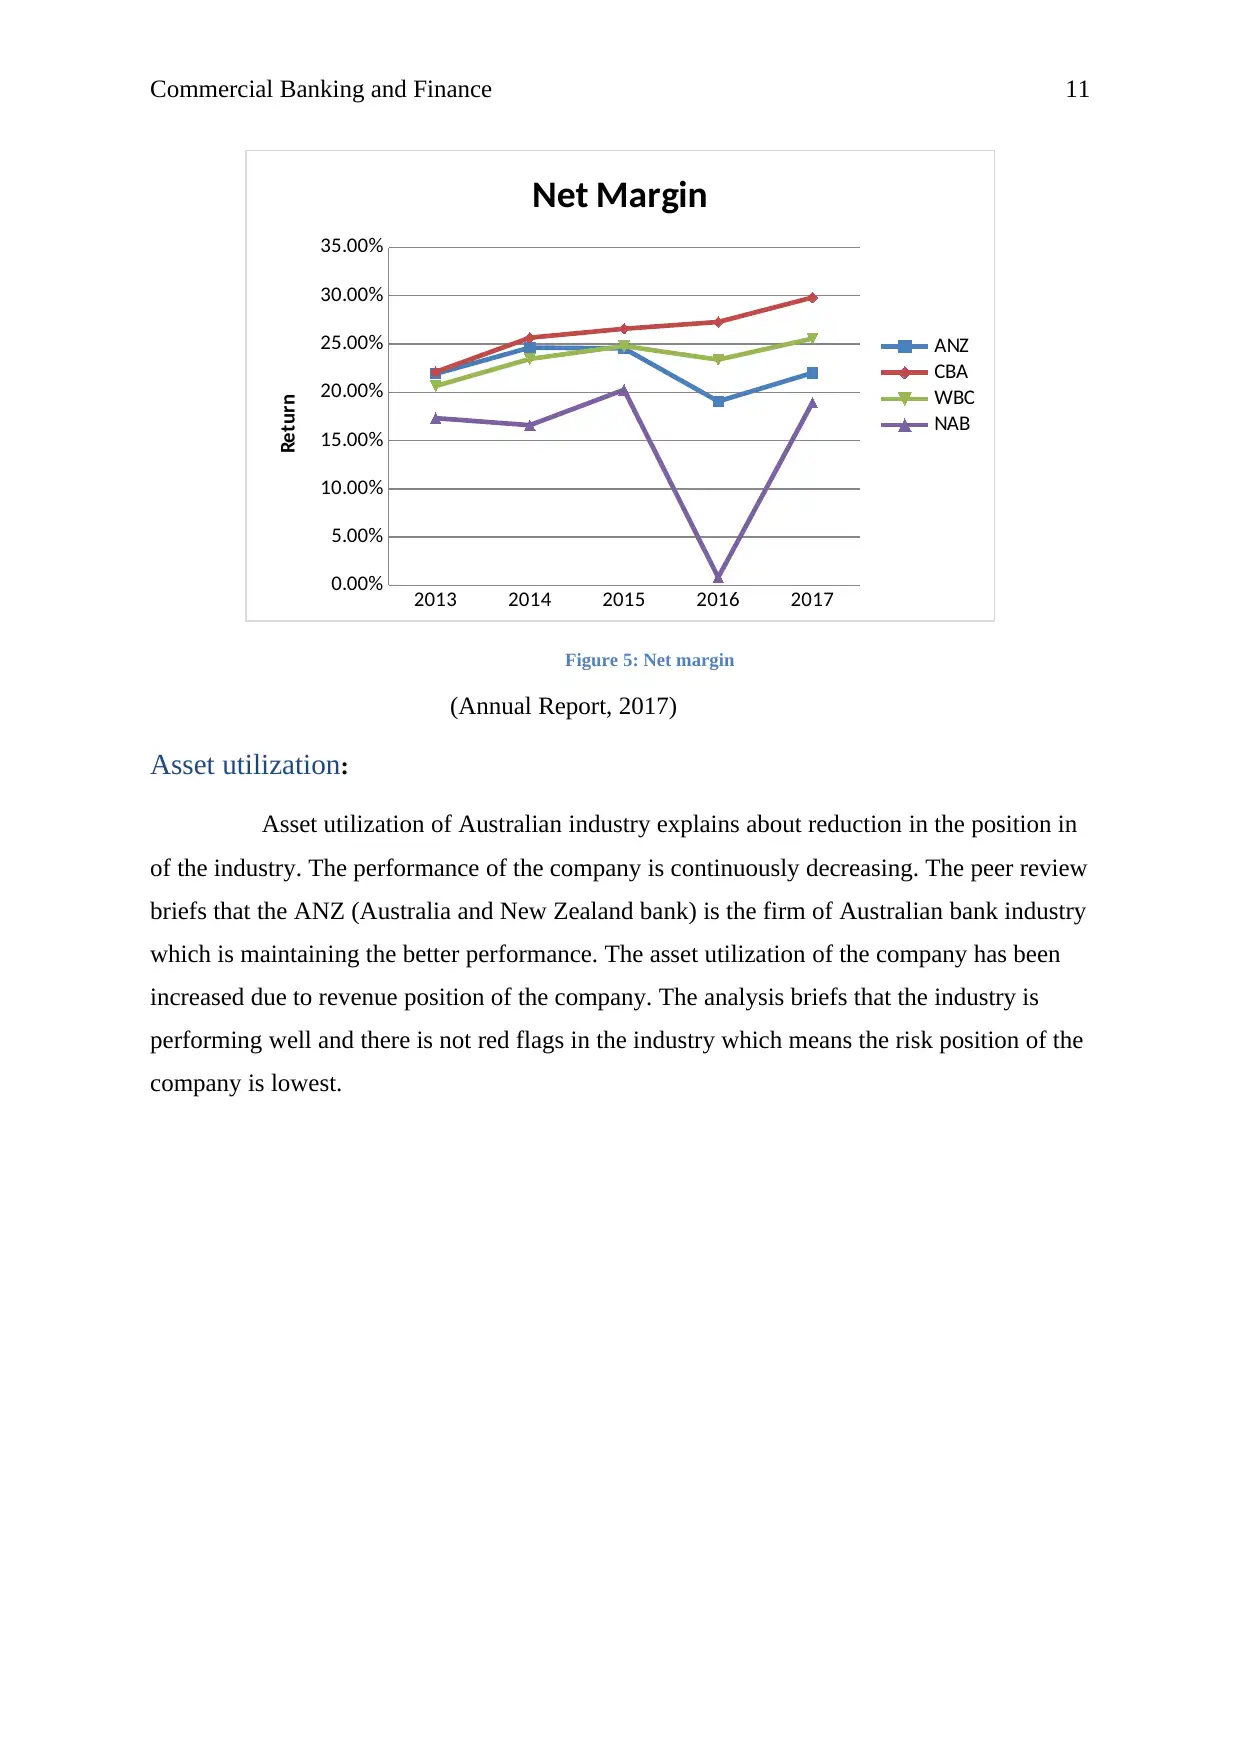
Net profit margin:
Net profit margin of Australian industry explains about average reduction in the
net profit margin position in last 2 years. Though, 2017 reports briefs about little increment.
The peer review briefs that the CBA (Commonwealth bank of Australia) is the firm of
Australian bank industry which is offering the highest return to its stockholders. The net
profit margin of the company has been increased due to high net profit position of the
company (Borio, 2014). The analysis briefs that the industry is performing well and there is
not red flags in the industry which means the risk position of the company is lowest
2013 2014 2015 2016 2017
0.00%
0.20%
0.40%
0.60%
0.80%
1.00%
1.20%
Return on Assets
ANZ
CBA
WBC
NAB
Return
Figure 4: Return on assets
(Annual Report, 2017)
Net profit margin:
Net profit margin of Australian industry explains about average reduction in the
net profit margin position in last 2 years. Though, 2017 reports briefs about little increment.
The peer review briefs that the CBA (Commonwealth bank of Australia) is the firm of
Australian bank industry which is offering the highest return to its stockholders. The net
profit margin of the company has been increased due to high net profit position of the
company (Borio, 2014). The analysis briefs that the industry is performing well and there is
not red flags in the industry which means the risk position of the company is lowest
Paraphrase This Document
Need a fresh take? Get an instant paraphrase of this document with our AI Paraphraser
Commercial Banking and Finance 11
2013 2014 2015 2016 2017
0.00%
5.00%
10.00%
15.00%
20.00%
25.00%
30.00%
35.00%
Net Margin
ANZ
CBA
WBC
NAB
Return
Figure 5: Net margin
(Annual Report, 2017)
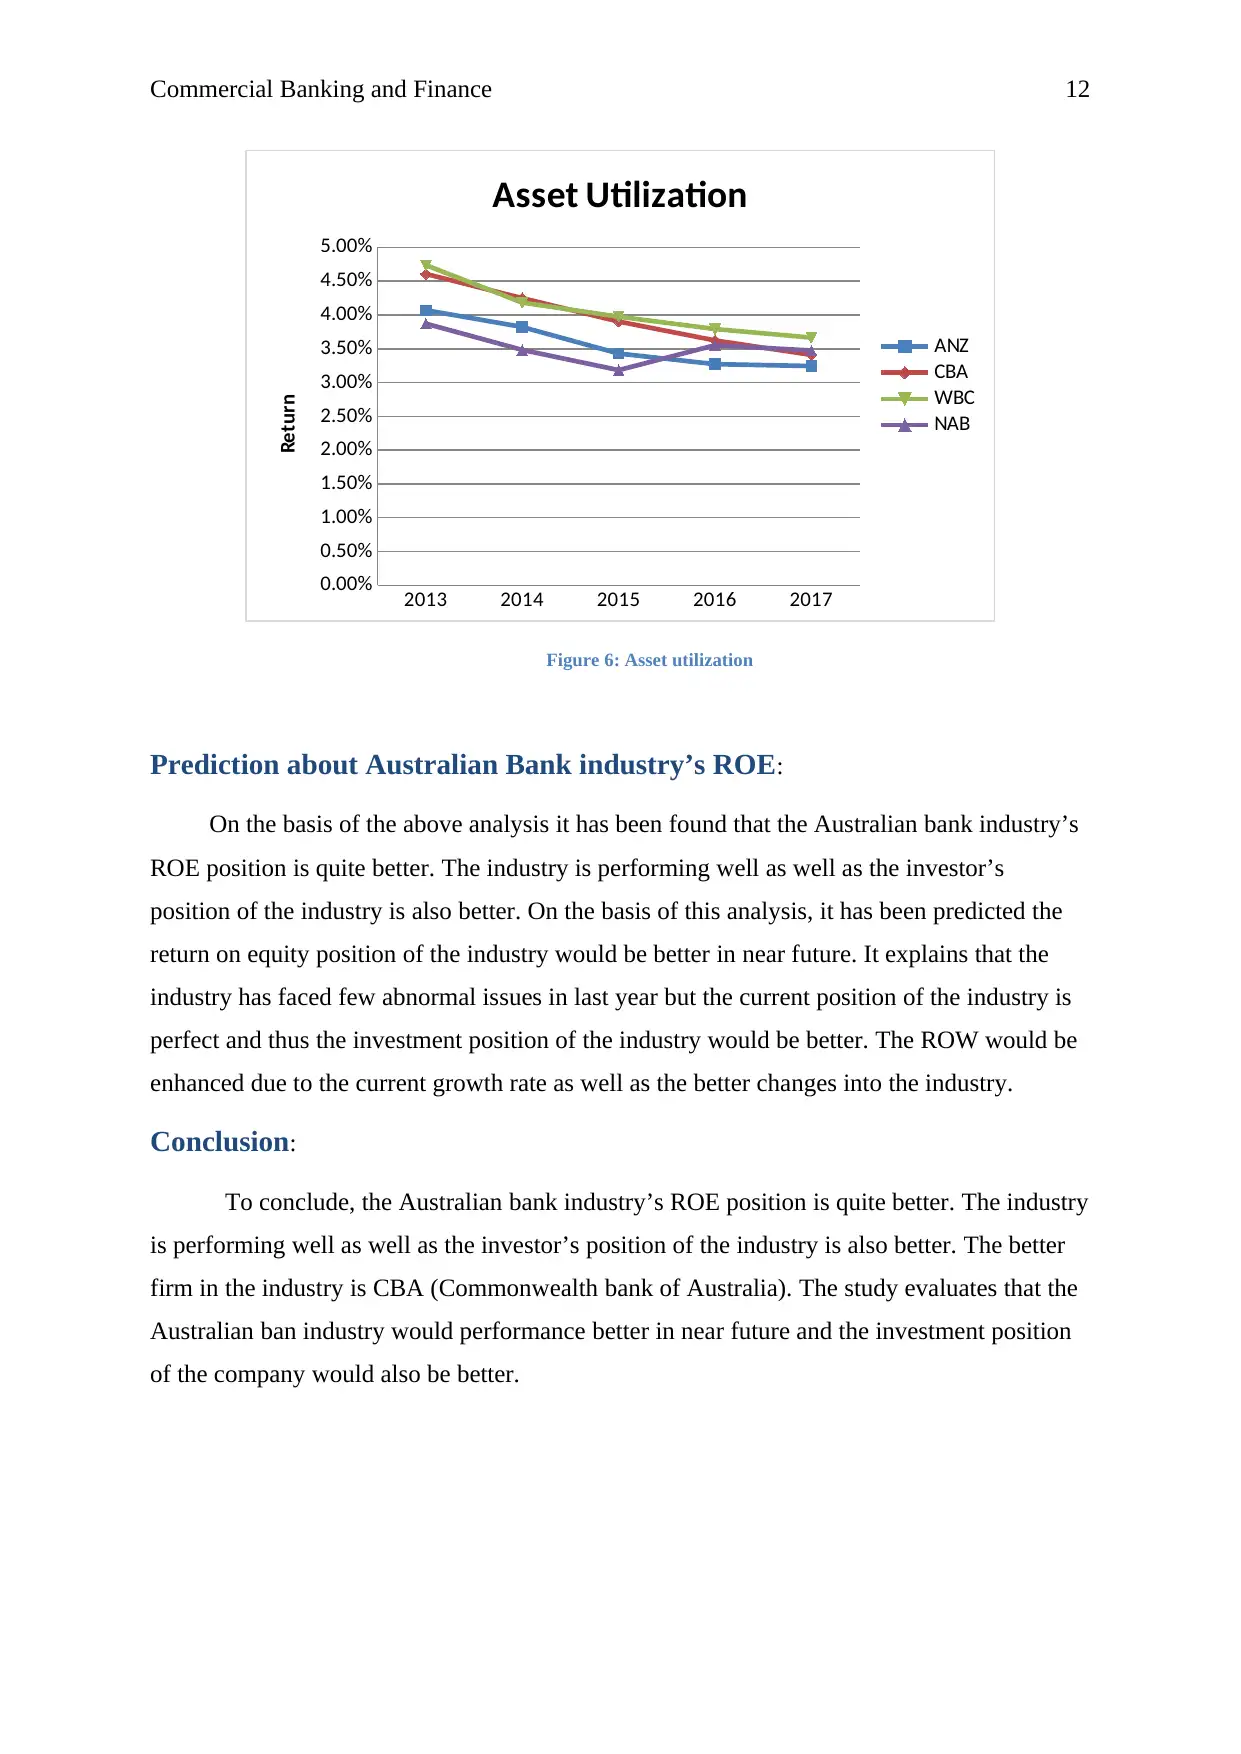
Asset utilization:
Asset utilization of Australian industry explains about reduction in the position in
of the industry. The performance of the company is continuously decreasing. The peer review
briefs that the ANZ (Australia and New Zealand bank) is the firm of Australian bank industry
which is maintaining the better performance. The asset utilization of the company has been
increased due to revenue position of the company. The analysis briefs that the industry is
performing well and there is not red flags in the industry which means the risk position of the
company is lowest.
2013 2014 2015 2016 2017
0.00%
5.00%
10.00%
15.00%
20.00%
25.00%
30.00%
35.00%
Net Margin
ANZ
CBA
WBC
NAB
Return
Figure 5: Net margin
(Annual Report, 2017)
Asset utilization:
Asset utilization of Australian industry explains about reduction in the position in
of the industry. The performance of the company is continuously decreasing. The peer review
briefs that the ANZ (Australia and New Zealand bank) is the firm of Australian bank industry
which is maintaining the better performance. The asset utilization of the company has been
increased due to revenue position of the company. The analysis briefs that the industry is
performing well and there is not red flags in the industry which means the risk position of the
company is lowest.
Commercial Banking and Finance 12
2013 2014 2015 2016 2017
0.00%
0.50%
1.00%
1.50%
2.00%
2.50%
3.00%
3.50%
4.00%
4.50%
5.00%
Asset Utilization
ANZ
CBA
WBC
NAB
Return
Figure 6: Asset utilization
Prediction about Australian Bank industry’s ROE:
On the basis of the above analysis it has been found that the Australian bank industry’s
ROE position is quite better. The industry is performing well as well as the investor’s
position of the industry is also better. On the basis of this analysis, it has been predicted the
return on equity position of the industry would be better in near future. It explains that the
industry has faced few abnormal issues in last year but the current position of the industry is
perfect and thus the investment position of the industry would be better. The ROW would be
enhanced due to the current growth rate as well as the better changes into the industry.
Conclusion:
To conclude, the Australian bank industry’s ROE position is quite better. The industry
is performing well as well as the investor’s position of the industry is also better. The better
firm in the industry is CBA (Commonwealth bank of Australia). The study evaluates that the
Australian ban industry would performance better in near future and the investment position
of the company would also be better.
⊘ This is a preview!⊘
Do you want full access?
Subscribe today to unlock all pages.
Trusted by 1+ million students worldwide
1 out of 14
Related Documents


Your All-in-One AI-Powered Toolkit for Academic Success.
+13062052269
info@desklib.com
Available 24*7 on WhatsApp / Email
![[object Object]](/_next/static/media/star-bottom.7253800d.svg)
Unlock your academic potential
Copyright © 2020–2026 A2Z Services. All Rights Reserved. Developed and managed by ZUCOL.