BFF2401 Finance Project: ROE Analysis of Australian Banks via DuPont
VerifiedAdded on 2023/06/13
|14
|3066
|325
Report
AI Summary
This report provides a detailed DuPont analysis of the top four banks in Australia: AUSTRALIA AND NEW ZEALAND BANKING GROUP LTD, COMMONWEALTH BANK OF AUSTRALIA, WESTPAC BANKING CORP, and NATIONAL AUSTRALIA BANK LTD. The analysis evaluates the Return on Equity (ROE) of these banks, breaking it down into Leverage Multiplier, Return on Assets (ROA), Asset Utilization, and Net Profit Margin. The report examines the ROE trends over five years (2013-2017), highlighting the Commonwealth Bank of Australia's consistently high ROE. The study also identifies factors influencing ROE, such as financial crises and industrial issues, and assesses the risk implications for each bank. The findings offer valuable insights for investors and stakeholders in the Australian banking sector. Desklib provides similar past papers and solved assignments for students.

Running Head: Finance
1
Project Report: Finance
1
Project Report: Finance
Paraphrase This Document
Need a fresh take? Get an instant paraphrase of this document with our AI Paraphraser
Finance
2
Contents
Introduction.......................................................................................................................3
DuPont analysis................................................................................................................3
DuPont analysis of four major banks of Australia............................................................5
Analysis of ROE...............................................................................................................7
Trend of ROE in next few years.....................................................................................11
Conclusion......................................................................................................................11
References.......................................................................................................................12
Finance
3
Introduction:
DuPont formula is a technique to assess return on equity of a company. It breaks the
process into 5 parts. The name of this process has come from DuPont Corporation which has
started using the formula initially in 1920s. The report explains about the return on equity of
top 4 banks of Australia. AUSTRALIA AND NEW ZEALAND BANKING GROUP LTD,
COMMONWEALTH BANK OF AUSTRALIA, WESTPAC BANKING CORP and
NATIONAL AUSTRALIA BANK LTD’s return on equity has been evaluated on the basis of
DuPont analysis and it has been found that the Roe of which bank is highest and what would
be trend of ROE in next few years in the Australian market.
DuPont analysis:
DuPont analysis offers a broad knowledge about the return on equity of an
organization. It ensures and highlights the main power and strengths and at the same time in
pin points the main area of company where improvements are required to be done. DuPont
analysis makes it easy for the comapny to find out the main reason behind lower ROE (Little
et al, 2011). It measures that whether the lower profit margin is the reason behind the lower
ROE or the return on assets of the company. Once the organization finds out the main area
due to which the ROE is getting lower, few steps could be taken by the company to improve
it and make it better. The DuPont formula is mainly based upon the following ratios:
⊘ This is a preview!⊘
Do you want full access?
Subscribe today to unlock all pages.
Trusted by 1+ million students worldwide
Finance
4
Figure 1: DuPont Analysis
(Clark et al, 2009)
Return on equity:
Return on equity offers the useful insight about the performance of the company.
Return on equity could easily be compared with the different companies and a better decision
could be made by the investors about the investments. Return on equity is calculated on the
basis of total profit of the company and the equity level of the company. The more the equity
of an organization would be the less the Return on equity would be. It briefs that the comapny
should manage the equity according to the equity level of the company. The formula of return
on equity is as follows:
Return on equity = Net income / Equity (Liesz & Maranville, 2008)
Though, the DuPont formula briefs that the return on equity of an organization is the
combination of leverage multiplier, asset utilization and net profit margin of the company.
Return on equity calculations on the basis of DuPont analysis makes it easy for the comapny
to find out the main reason behind lower ROE. It measures that whether the lower profit
margin is the reason behind the lower ROE or the asset utilization of the company.
Leverage multiplier:
Paraphrase This Document
Need a fresh take? Get an instant paraphrase of this document with our AI Paraphraser
Finance
5
Further, the leverage multiplier has been studied and it has been found that it is the
major and main element to evaluate the return on equity of an organization on the basis of
DuPont analysis. Leverage multiplier is calculated on the basis of total assets and total equity
of an organization. Leverage multiplier evaluates the level of total assets of the company on
the basis of total equity. It is measures to identify the financial performance of the company.
The formula of leverage multiplier is as follows:
Leverage Multiplier = Total assets / total Equity
The leverage multiplier briefs that it affects the better impact on the total return on
equity of an organization and thus it is required for the company to calculated and measure
the performance of the company (Burja & Mărginean, 2014). The better the leverage
multiplier of a company the better the ROE would be.
Return on assets:
Return on assets has been studied and it has been found that it is the major and main
element to evaluate the return on equity of an organization on the basis of DuPont analysis.
Return on assets is calculated on the basis of net income and total assets of an organization.
Return on assets evaluates the level of total net profit of the company on the basis of total
assets. It is measures to identify the financial performance of the company. The formula of
return on assets is as follows:
Return on assets = Net profit / Total assets
Return on assets briefs that it affects the better impact on the total return on equity of
an organization and thus it is required for the company to calculated and measure the
performance of the company. The better the Return on assets of a company the better the
ROE would be (Alhabeeb, 2012).
Net profit margin:
Net profit margin is the part of return on assets. It is measured in DuPont analysis to
calculate the return on assets of the company. Net profit margin briefs the net profit of the
company against the total revenue of the company. Formula of net profit margin is as
follows:
Net profit Margin = net profit / total revenue
Finance
6
Net profit margin briefs that it indirectly impacts on the return on equity of an
organization and thus it is required for an organization to maintain better net profit margin to
enhance the level of return on equity of the company.
Asset utilization:
Asset utilization is the part of return on assets. It is measured in DuPont analysis to
calculate the return on assets of the company. Asset utilization briefs the total revenue of the
company against the total assets of the company. Formula of assets utilization is as follows:
Asset utilization = Total revenue / Total assets
Asset utilization briefs that it indirectly impacts on the return on equity of an
organization and thus it is required for an organization to maintain better asset utilization
capacity to enhance the level of return on equity of the company (Chang, Chichernea &
HassabElnaby, 2014).
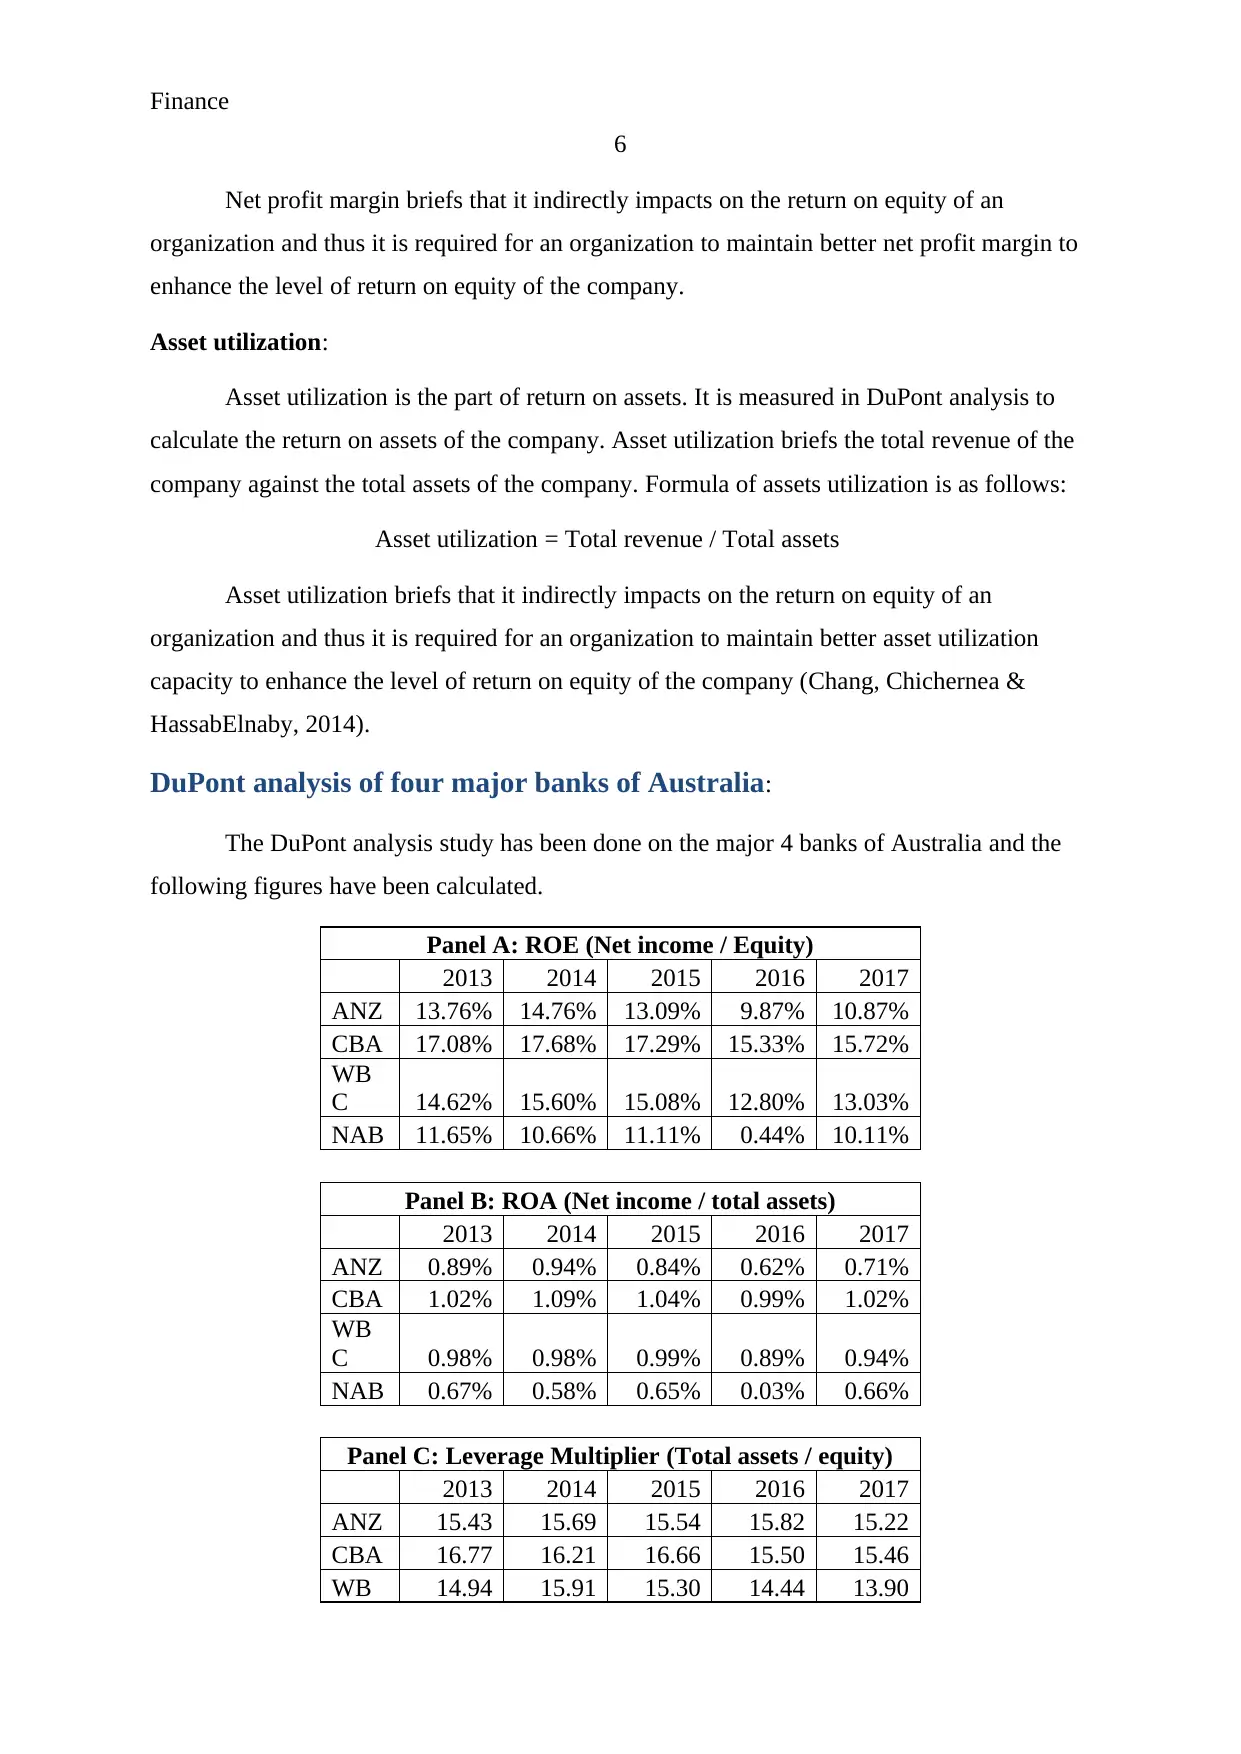
DuPont analysis of four major banks of Australia:
The DuPont analysis study has been done on the major 4 banks of Australia and the
following figures have been calculated.
Panel A: ROE (Net income / Equity)
2013 2014 2015 2016 2017
ANZ 13.76% 14.76% 13.09% 9.87% 10.87%
CBA 17.08% 17.68% 17.29% 15.33% 15.72%
WB
C 14.62% 15.60% 15.08% 12.80% 13.03%
NAB 11.65% 10.66% 11.11% 0.44% 10.11%
Panel B: ROA (Net income / total assets)
2013 2014 2015 2016 2017
ANZ 0.89% 0.94% 0.84% 0.62% 0.71%
CBA 1.02% 1.09% 1.04% 0.99% 1.02%
WB
C 0.98% 0.98% 0.99% 0.89% 0.94%
NAB 0.67% 0.58% 0.65% 0.03% 0.66%
Panel C: Leverage Multiplier (Total assets / equity)
2013 2014 2015 2016 2017
ANZ 15.43 15.69 15.54 15.82 15.22
CBA 16.77 16.21 16.66 15.50 15.46
WB 14.94 15.91 15.30 14.44 13.90
6
Net profit margin briefs that it indirectly impacts on the return on equity of an
organization and thus it is required for an organization to maintain better net profit margin to
enhance the level of return on equity of the company.
Asset utilization:
Asset utilization is the part of return on assets. It is measured in DuPont analysis to
calculate the return on assets of the company. Asset utilization briefs the total revenue of the
company against the total assets of the company. Formula of assets utilization is as follows:
Asset utilization = Total revenue / Total assets
Asset utilization briefs that it indirectly impacts on the return on equity of an
organization and thus it is required for an organization to maintain better asset utilization
capacity to enhance the level of return on equity of the company (Chang, Chichernea &
HassabElnaby, 2014).
DuPont analysis of four major banks of Australia:
The DuPont analysis study has been done on the major 4 banks of Australia and the
following figures have been calculated.
Panel A: ROE (Net income / Equity)
2013 2014 2015 2016 2017
ANZ 13.76% 14.76% 13.09% 9.87% 10.87%
CBA 17.08% 17.68% 17.29% 15.33% 15.72%
WB
C 14.62% 15.60% 15.08% 12.80% 13.03%
NAB 11.65% 10.66% 11.11% 0.44% 10.11%
Panel B: ROA (Net income / total assets)
2013 2014 2015 2016 2017
ANZ 0.89% 0.94% 0.84% 0.62% 0.71%
CBA 1.02% 1.09% 1.04% 0.99% 1.02%
WB
C 0.98% 0.98% 0.99% 0.89% 0.94%
NAB 0.67% 0.58% 0.65% 0.03% 0.66%
Panel C: Leverage Multiplier (Total assets / equity)
2013 2014 2015 2016 2017
ANZ 15.43 15.69 15.54 15.82 15.22
CBA 16.77 16.21 16.66 15.50 15.46
WB 14.94 15.91 15.30 14.44 13.90
⊘ This is a preview!⊘
Do you want full access?
Subscribe today to unlock all pages.
Trusted by 1+ million students worldwide
Finance
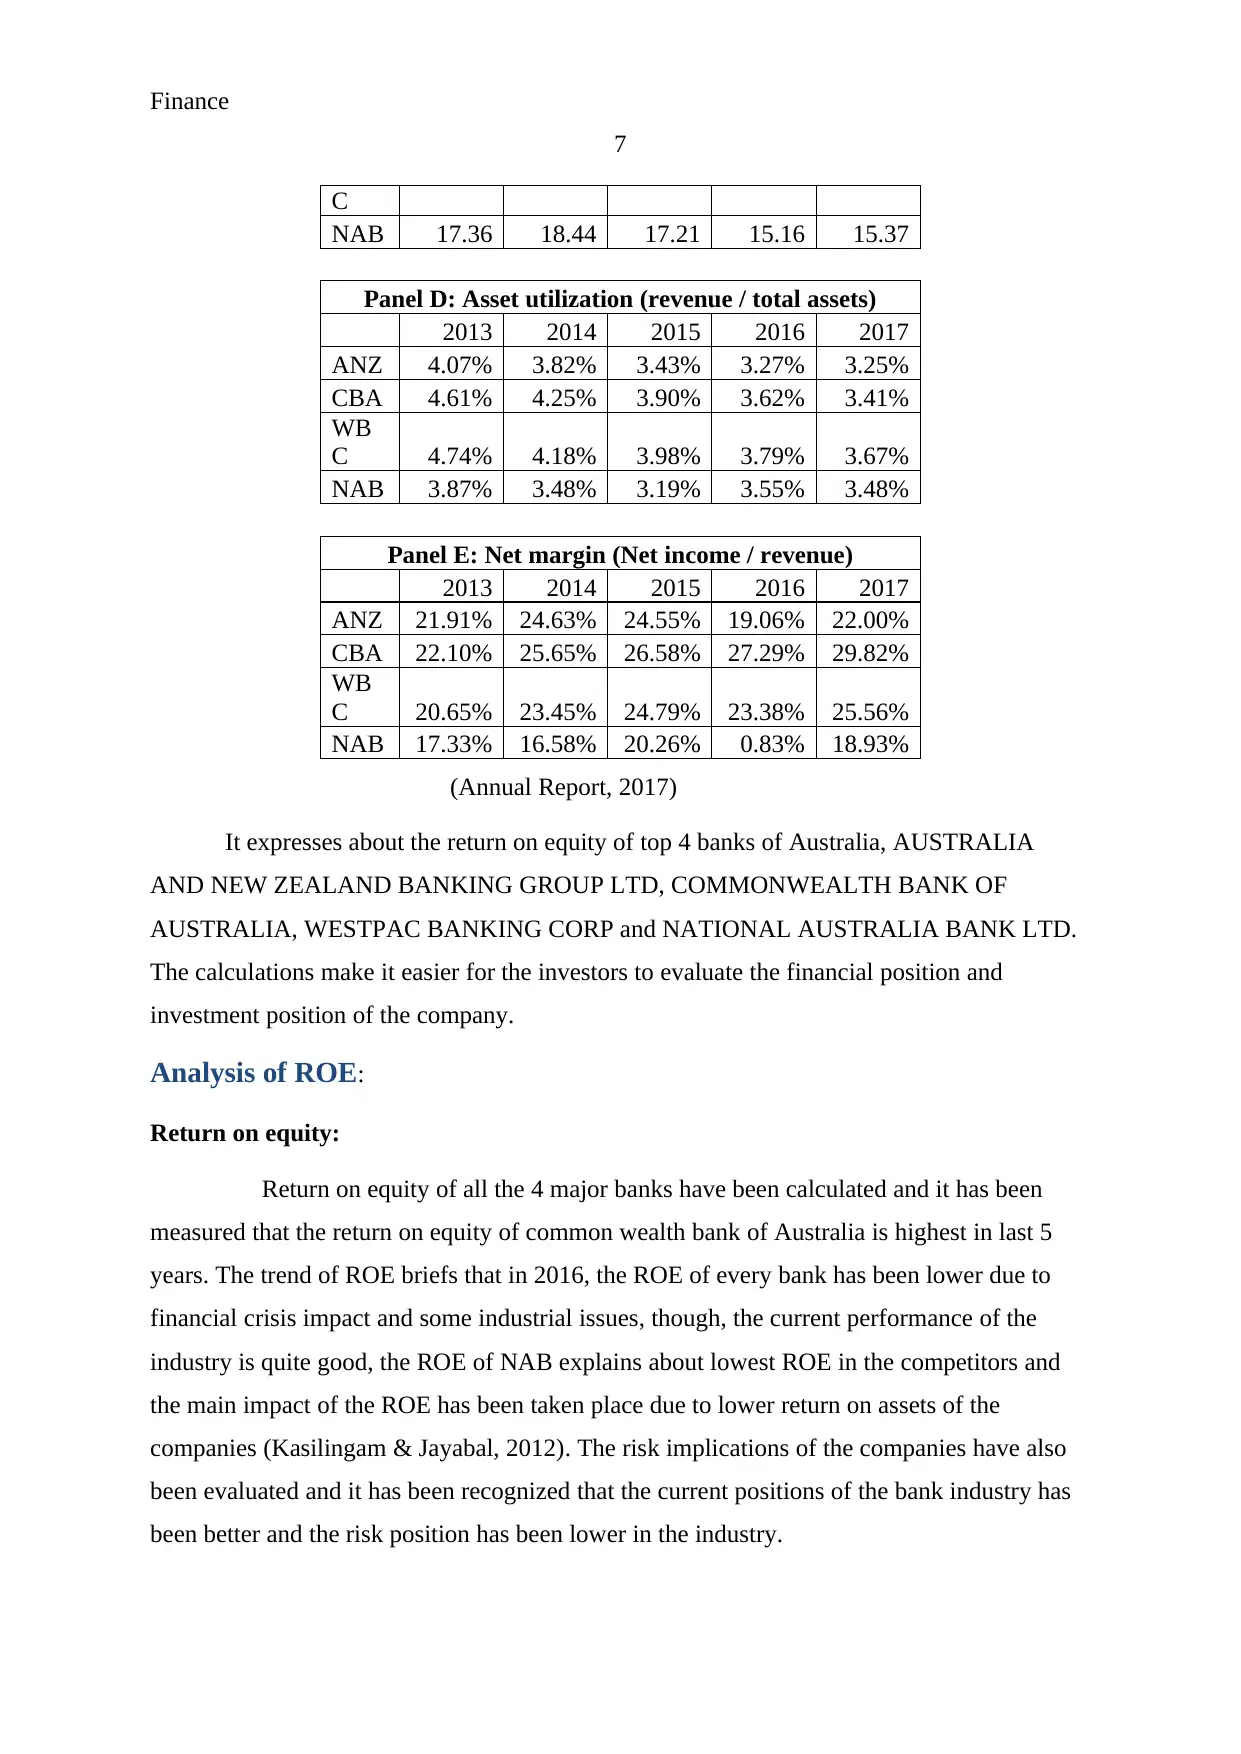
7
C
NAB 17.36 18.44 17.21 15.16 15.37
Panel D: Asset utilization (revenue / total assets)
2013 2014 2015 2016 2017
ANZ 4.07% 3.82% 3.43% 3.27% 3.25%
CBA 4.61% 4.25% 3.90% 3.62% 3.41%
WB
C 4.74% 4.18% 3.98% 3.79% 3.67%
NAB 3.87% 3.48% 3.19% 3.55% 3.48%
Panel E: Net margin (Net income / revenue)
2013 2014 2015 2016 2017
ANZ 21.91% 24.63% 24.55% 19.06% 22.00%
CBA 22.10% 25.65% 26.58% 27.29% 29.82%
WB
C 20.65% 23.45% 24.79% 23.38% 25.56%
NAB 17.33% 16.58% 20.26% 0.83% 18.93%
(Annual Report, 2017)
It expresses about the return on equity of top 4 banks of Australia, AUSTRALIA
AND NEW ZEALAND BANKING GROUP LTD, COMMONWEALTH BANK OF
AUSTRALIA, WESTPAC BANKING CORP and NATIONAL AUSTRALIA BANK LTD.
The calculations make it easier for the investors to evaluate the financial position and
investment position of the company.
Analysis of ROE:
Return on equity:
Return on equity of all the 4 major banks have been calculated and it has been
measured that the return on equity of common wealth bank of Australia is highest in last 5
years. The trend of ROE briefs that in 2016, the ROE of every bank has been lower due to
financial crisis impact and some industrial issues, though, the current performance of the
industry is quite good, the ROE of NAB explains about lowest ROE in the competitors and
the main impact of the ROE has been taken place due to lower return on assets of the
companies (Kasilingam & Jayabal, 2012). The risk implications of the companies have also
been evaluated and it has been recognized that the current positions of the bank industry has
been better and the risk position has been lower in the industry.
Paraphrase This Document
Need a fresh take? Get an instant paraphrase of this document with our AI Paraphraser
Finance
8
2013 2014 2015 2016 2017
0.00%
2.00%
4.00%
6.00%
8.00%
10.00%
12.00%
14.00%
16.00%
18.00%
20.00%
Return on equity
ANZ
CBA
WBC
NAB
Return
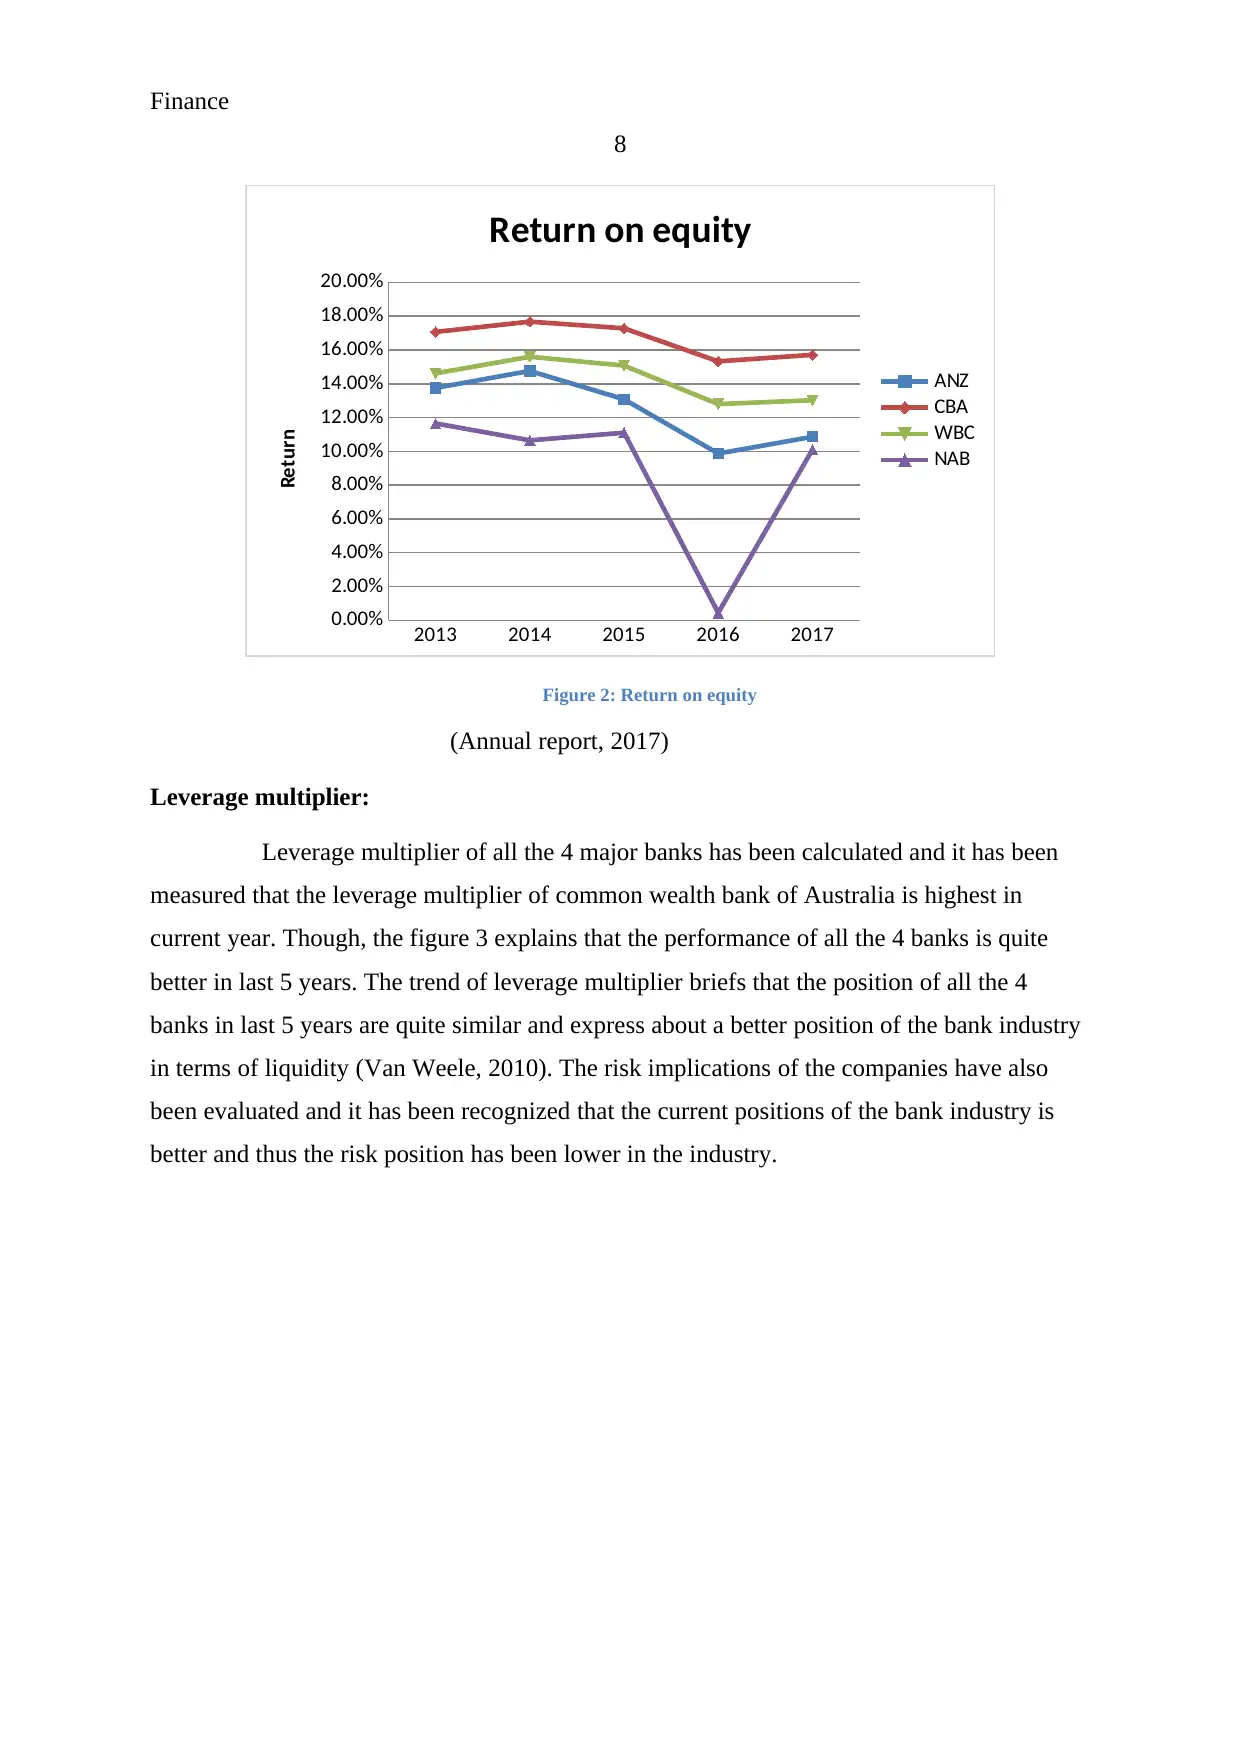
Figure 2: Return on equity
(Annual report, 2017)
Leverage multiplier:
Leverage multiplier of all the 4 major banks has been calculated and it has been
measured that the leverage multiplier of common wealth bank of Australia is highest in
current year. Though, the figure 3 explains that the performance of all the 4 banks is quite
better in last 5 years. The trend of leverage multiplier briefs that the position of all the 4
banks in last 5 years are quite similar and express about a better position of the bank industry
in terms of liquidity (Van Weele, 2010). The risk implications of the companies have also
been evaluated and it has been recognized that the current positions of the bank industry is
better and thus the risk position has been lower in the industry.
8
2013 2014 2015 2016 2017
0.00%
2.00%
4.00%
6.00%
8.00%
10.00%
12.00%
14.00%
16.00%
18.00%
20.00%
Return on equity
ANZ
CBA
WBC
NAB
Return
Figure 2: Return on equity
(Annual report, 2017)
Leverage multiplier:
Leverage multiplier of all the 4 major banks has been calculated and it has been
measured that the leverage multiplier of common wealth bank of Australia is highest in
current year. Though, the figure 3 explains that the performance of all the 4 banks is quite
better in last 5 years. The trend of leverage multiplier briefs that the position of all the 4
banks in last 5 years are quite similar and express about a better position of the bank industry
in terms of liquidity (Van Weele, 2010). The risk implications of the companies have also
been evaluated and it has been recognized that the current positions of the bank industry is
better and thus the risk position has been lower in the industry.
Finance
9
2013 2014 2015 2016 2017
0.00
2.00
4.00
6.00
8.00
10.00
12.00
14.00
16.00
18.00
20.00
Leverage Multiplier
ANZ
CBA
WBC
NAB
Return
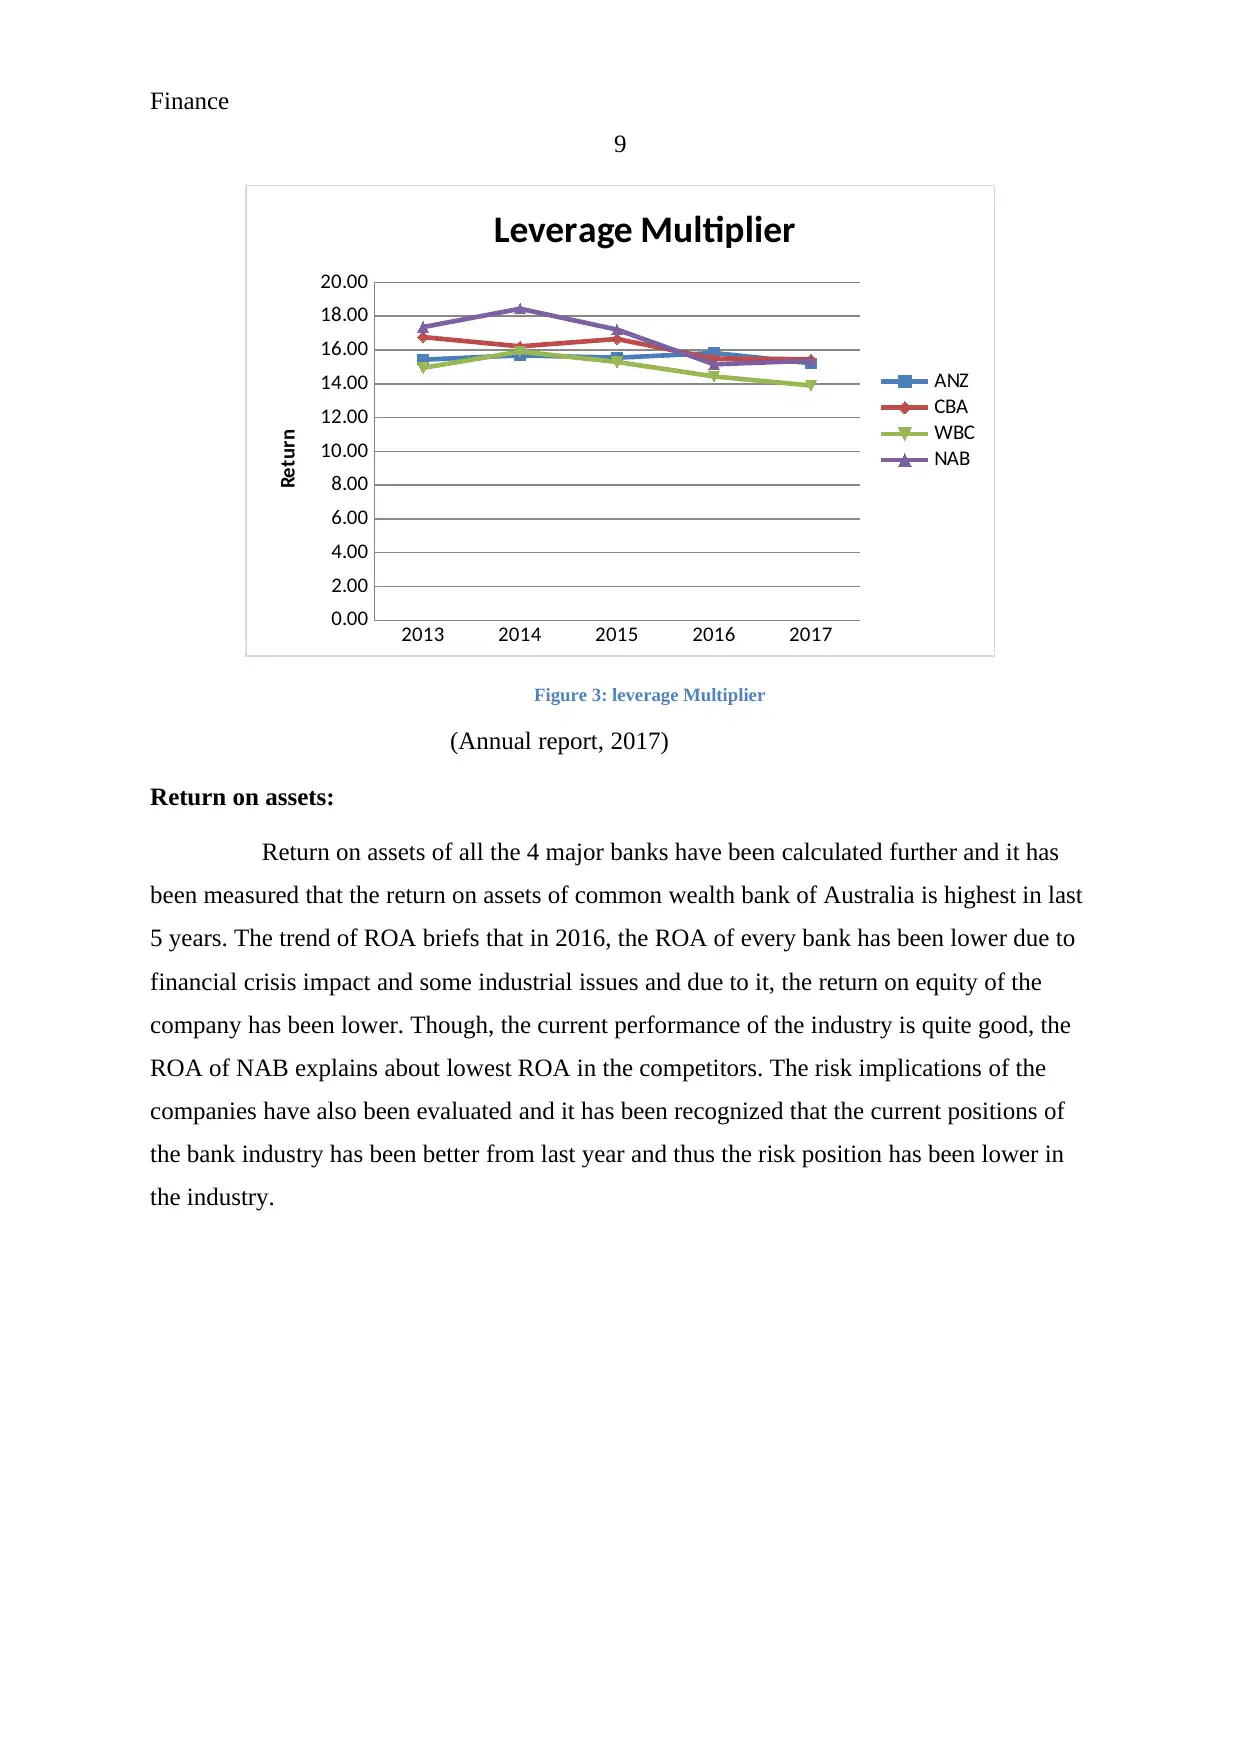
Figure 3: leverage Multiplier
(Annual report, 2017)
Return on assets:
Return on assets of all the 4 major banks have been calculated further and it has
been measured that the return on assets of common wealth bank of Australia is highest in last
5 years. The trend of ROA briefs that in 2016, the ROA of every bank has been lower due to
financial crisis impact and some industrial issues and due to it, the return on equity of the
company has been lower. Though, the current performance of the industry is quite good, the
ROA of NAB explains about lowest ROA in the competitors. The risk implications of the
companies have also been evaluated and it has been recognized that the current positions of
the bank industry has been better from last year and thus the risk position has been lower in
the industry.
9
2013 2014 2015 2016 2017
0.00
2.00
4.00
6.00
8.00
10.00
12.00
14.00
16.00
18.00
20.00
Leverage Multiplier
ANZ
CBA
WBC
NAB
Return
Figure 3: leverage Multiplier
(Annual report, 2017)
Return on assets:
Return on assets of all the 4 major banks have been calculated further and it has
been measured that the return on assets of common wealth bank of Australia is highest in last
5 years. The trend of ROA briefs that in 2016, the ROA of every bank has been lower due to
financial crisis impact and some industrial issues and due to it, the return on equity of the
company has been lower. Though, the current performance of the industry is quite good, the
ROA of NAB explains about lowest ROA in the competitors. The risk implications of the
companies have also been evaluated and it has been recognized that the current positions of
the bank industry has been better from last year and thus the risk position has been lower in
the industry.
⊘ This is a preview!⊘
Do you want full access?
Subscribe today to unlock all pages.
Trusted by 1+ million students worldwide
Finance
10
2013 2014 2015 2016 2017
0.00%
0.20%
0.40%
0.60%
0.80%
1.00%
1.20%
Return on Assets
ANZ
CBA
WBC
NAB
Return
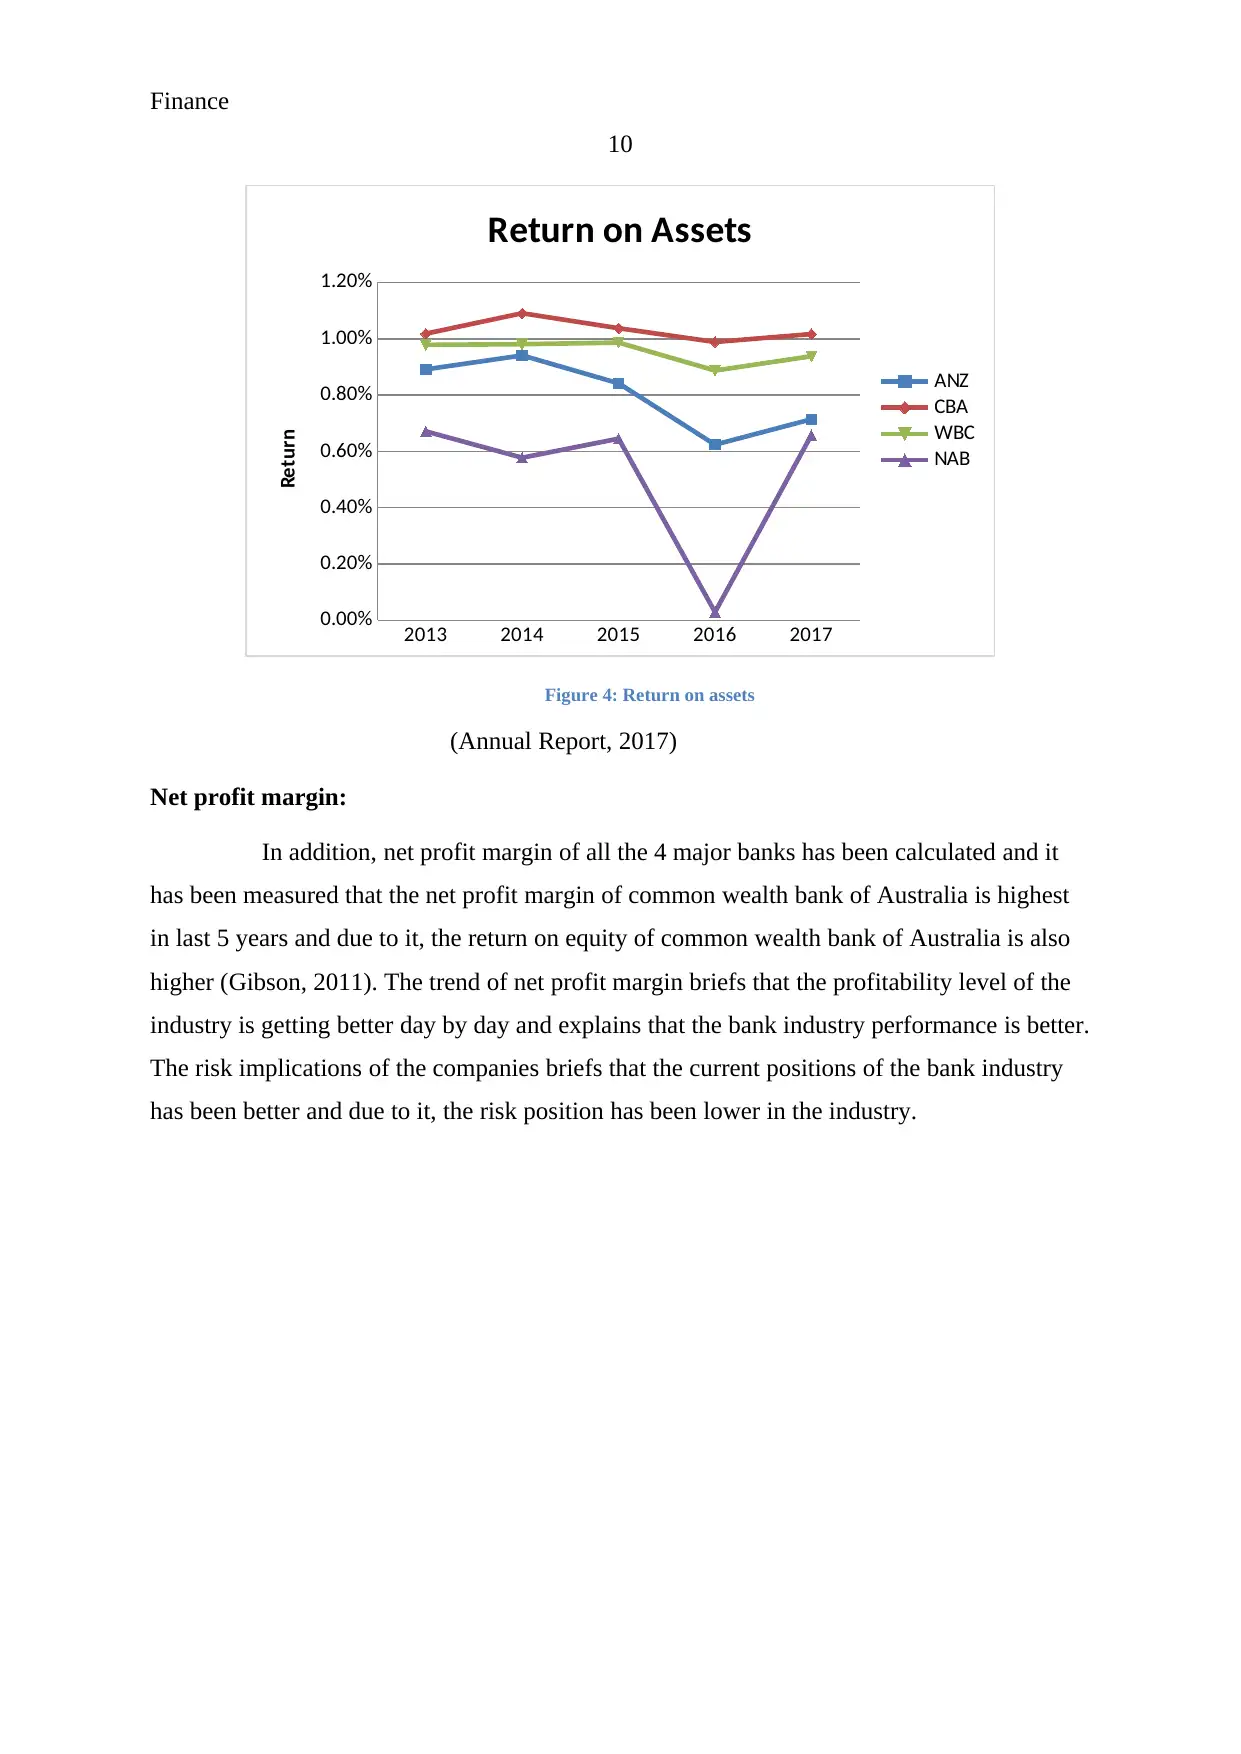
Figure 4: Return on assets
(Annual Report, 2017)
Net profit margin:
In addition, net profit margin of all the 4 major banks has been calculated and it
has been measured that the net profit margin of common wealth bank of Australia is highest
in last 5 years and due to it, the return on equity of common wealth bank of Australia is also
higher (Gibson, 2011). The trend of net profit margin briefs that the profitability level of the
industry is getting better day by day and explains that the bank industry performance is better.
The risk implications of the companies briefs that the current positions of the bank industry
has been better and due to it, the risk position has been lower in the industry.
10
2013 2014 2015 2016 2017
0.00%
0.20%
0.40%
0.60%
0.80%
1.00%
1.20%
Return on Assets
ANZ
CBA
WBC
NAB
Return
Figure 4: Return on assets
(Annual Report, 2017)
Net profit margin:
In addition, net profit margin of all the 4 major banks has been calculated and it
has been measured that the net profit margin of common wealth bank of Australia is highest
in last 5 years and due to it, the return on equity of common wealth bank of Australia is also
higher (Gibson, 2011). The trend of net profit margin briefs that the profitability level of the
industry is getting better day by day and explains that the bank industry performance is better.
The risk implications of the companies briefs that the current positions of the bank industry
has been better and due to it, the risk position has been lower in the industry.
Paraphrase This Document
Need a fresh take? Get an instant paraphrase of this document with our AI Paraphraser
Finance
11
2013 2014 2015 2016 2017
0.00%
5.00%
10.00%
15.00%
20.00%
25.00%
30.00%
35.00%
Net Margin
ANZ
CBA
WBC
NAB
Return
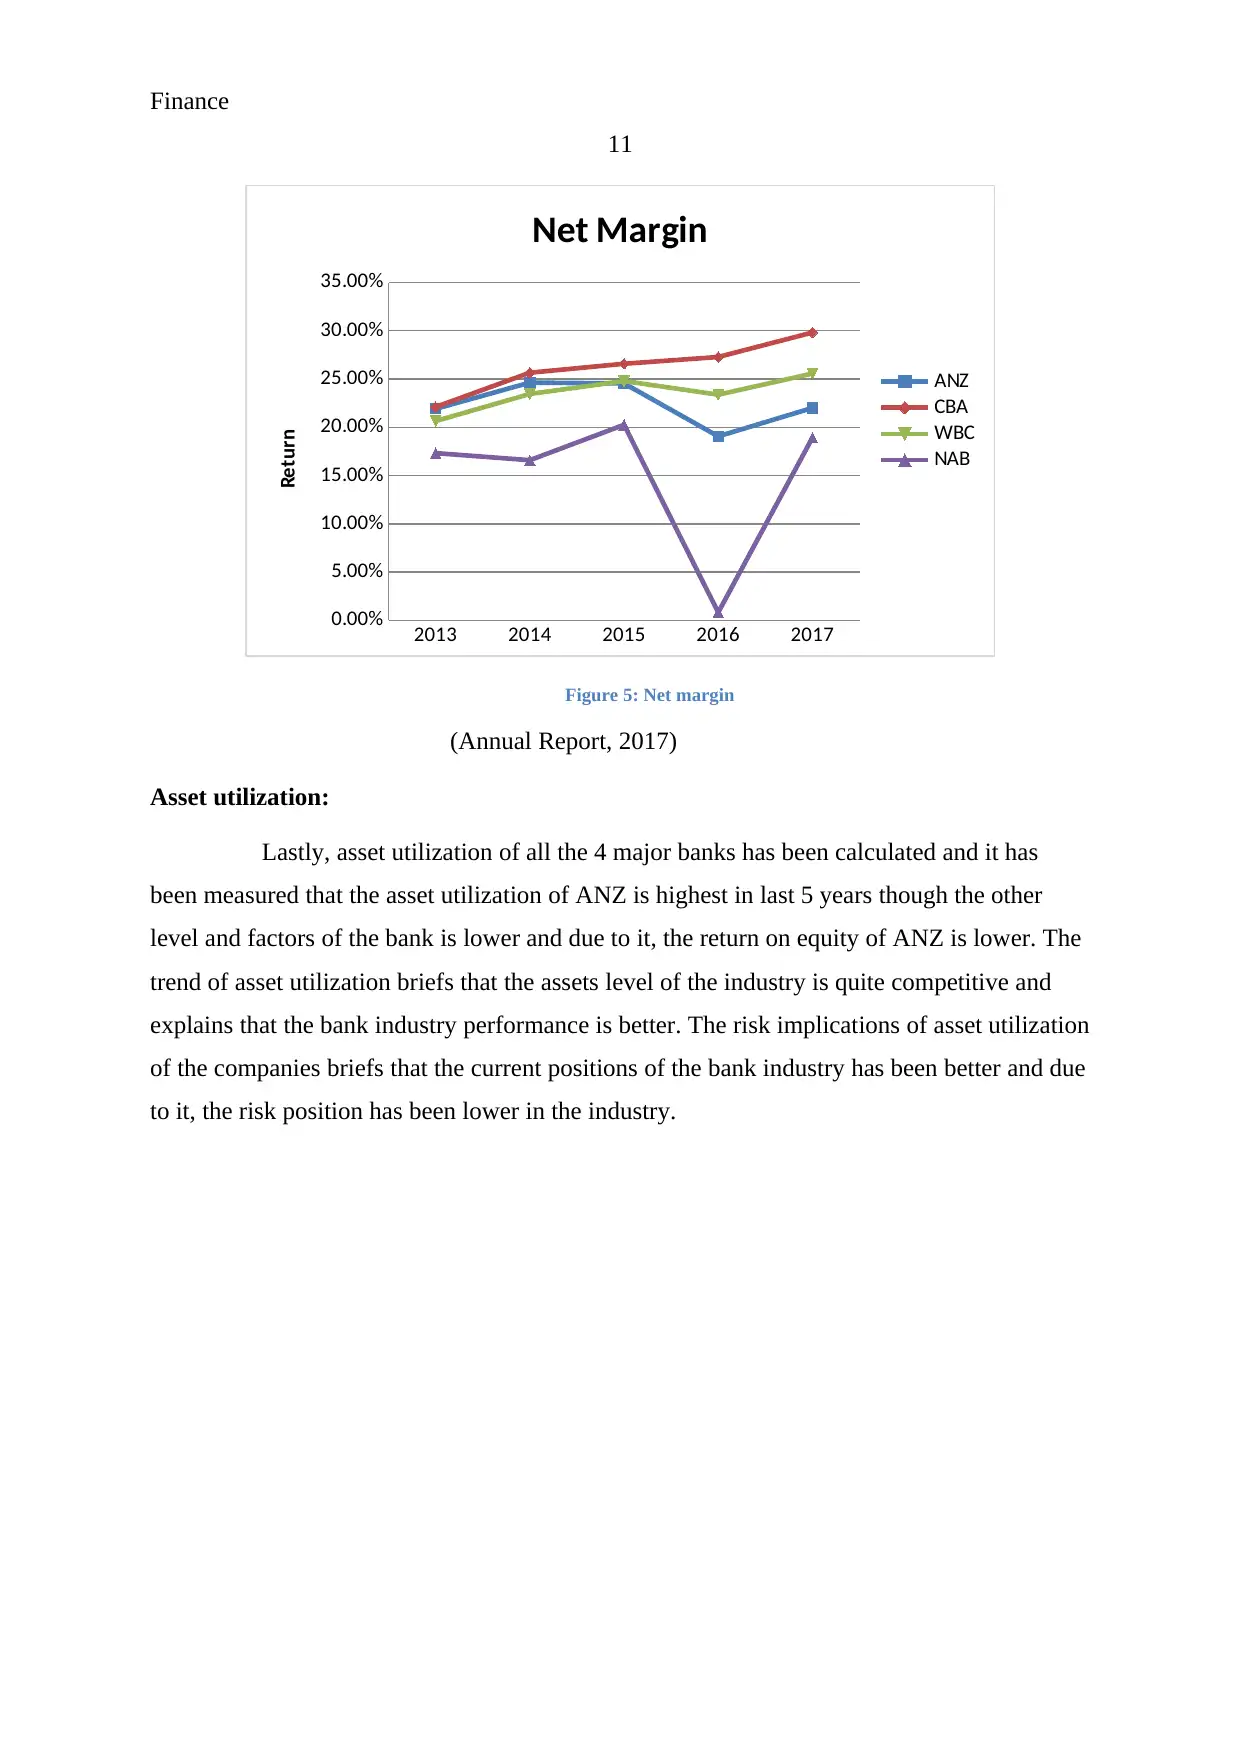
Figure 5: Net margin
(Annual Report, 2017)
Asset utilization:
Lastly, asset utilization of all the 4 major banks has been calculated and it has
been measured that the asset utilization of ANZ is highest in last 5 years though the other
level and factors of the bank is lower and due to it, the return on equity of ANZ is lower. The
trend of asset utilization briefs that the assets level of the industry is quite competitive and
explains that the bank industry performance is better. The risk implications of asset utilization
of the companies briefs that the current positions of the bank industry has been better and due
to it, the risk position has been lower in the industry.
11
2013 2014 2015 2016 2017
0.00%
5.00%
10.00%
15.00%
20.00%
25.00%
30.00%
35.00%
Net Margin
ANZ
CBA
WBC
NAB
Return
Figure 5: Net margin
(Annual Report, 2017)
Asset utilization:
Lastly, asset utilization of all the 4 major banks has been calculated and it has
been measured that the asset utilization of ANZ is highest in last 5 years though the other
level and factors of the bank is lower and due to it, the return on equity of ANZ is lower. The
trend of asset utilization briefs that the assets level of the industry is quite competitive and
explains that the bank industry performance is better. The risk implications of asset utilization
of the companies briefs that the current positions of the bank industry has been better and due
to it, the risk position has been lower in the industry.
Finance
12
2013 2014 2015 2016 2017
0.00%
0.50%
1.00%
1.50%
2.00%
2.50%
3.00%
3.50%
4.00%
4.50%
5.00%
Asset Utilization
ANZ
CBA
WBC
NAB
Return
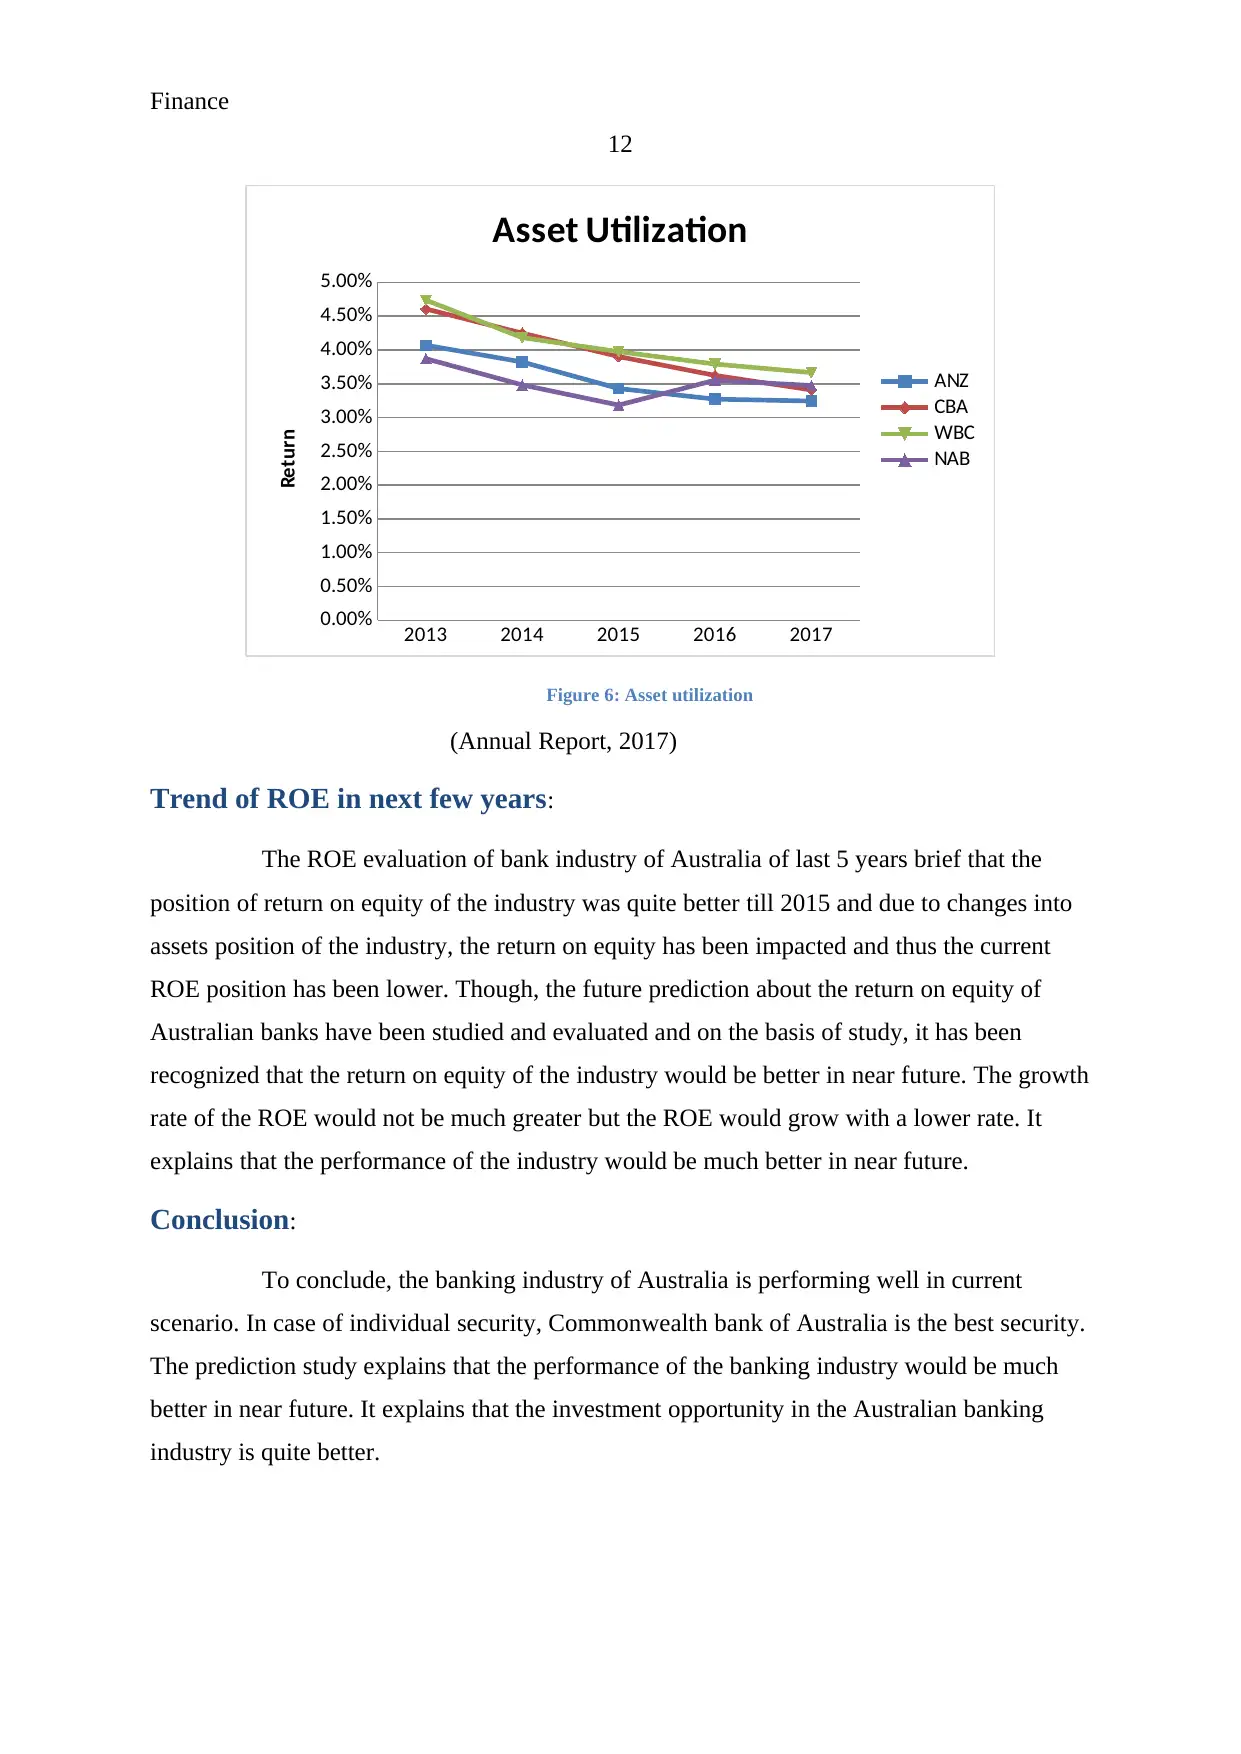
Figure 6: Asset utilization
(Annual Report, 2017)
Trend of ROE in next few years:
The ROE evaluation of bank industry of Australia of last 5 years brief that the
position of return on equity of the industry was quite better till 2015 and due to changes into
assets position of the industry, the return on equity has been impacted and thus the current
ROE position has been lower. Though, the future prediction about the return on equity of
Australian banks have been studied and evaluated and on the basis of study, it has been
recognized that the return on equity of the industry would be better in near future. The growth
rate of the ROE would not be much greater but the ROE would grow with a lower rate. It
explains that the performance of the industry would be much better in near future.
Conclusion:
To conclude, the banking industry of Australia is performing well in current
scenario. In case of individual security, Commonwealth bank of Australia is the best security.
The prediction study explains that the performance of the banking industry would be much
better in near future. It explains that the investment opportunity in the Australian banking
industry is quite better.
12
2013 2014 2015 2016 2017
0.00%
0.50%
1.00%
1.50%
2.00%
2.50%
3.00%
3.50%
4.00%
4.50%
5.00%
Asset Utilization
ANZ
CBA
WBC
NAB
Return
Figure 6: Asset utilization
(Annual Report, 2017)
Trend of ROE in next few years:
The ROE evaluation of bank industry of Australia of last 5 years brief that the
position of return on equity of the industry was quite better till 2015 and due to changes into
assets position of the industry, the return on equity has been impacted and thus the current
ROE position has been lower. Though, the future prediction about the return on equity of
Australian banks have been studied and evaluated and on the basis of study, it has been
recognized that the return on equity of the industry would be better in near future. The growth
rate of the ROE would not be much greater but the ROE would grow with a lower rate. It
explains that the performance of the industry would be much better in near future.
Conclusion:
To conclude, the banking industry of Australia is performing well in current
scenario. In case of individual security, Commonwealth bank of Australia is the best security.
The prediction study explains that the performance of the banking industry would be much
better in near future. It explains that the investment opportunity in the Australian banking
industry is quite better.
⊘ This is a preview!⊘
Do you want full access?
Subscribe today to unlock all pages.
Trusted by 1+ million students worldwide
1 out of 14
Related Documents


Your All-in-One AI-Powered Toolkit for Academic Success.
+13062052269
info@desklib.com
Available 24*7 on WhatsApp / Email
![[object Object]](/_next/static/media/star-bottom.7253800d.svg)
Unlock your academic potential
Copyright © 2020–2026 A2Z Services. All Rights Reserved. Developed and managed by ZUCOL.