Financial Analysis of BHP Billiton: A Comprehensive Company Report
VerifiedAdded on 2021/02/21
|15
|2906
|18
Report
AI Summary
This report provides a detailed company analysis of BHP Billiton, a major player in the mining, petroleum, and metal extraction industries. It begins with an overview of the company, including its history, key products (such as iron ore, petroleum, copper, and coal), and market position. The report delves into a financial analysis of BHP Billiton, using data from recent annual reports. It examines income statements, stock price movements, and dividend policies. Furthermore, the analysis includes projected financial statements (income statement, balance sheet, and cash flow statement) for the next five years. The report also covers the calculation of Project Free Cash Flow, risk analysis, Terminal Value, and the application of the Weighted Average Cost of Capital (WACC) for discounting. The analysis reveals the company's performance and offers insights into its financial health and future prospects. The report is structured to provide a comprehensive view of BHP Billiton's operations and financial strategies.
Company Analysis
Paraphrase This Document
Need a fresh take? Get an instant paraphrase of this document with our AI Paraphraser
Table of Contents
INTRODUCTION...........................................................................................................................1
MAIN BODY ..................................................................................................................................1
Overview company.....................................................................................................................1
Financial analysis........................................................................................................................4
RECOMMENDATION..............................................................................................................8
CONCLUSION................................................................................................................................8
REFERENCES ...............................................................................................................................9
APPENDEX...................................................................................................................................10
INTRODUCTION
In modern era, the concept of company analysis is defined as the process that is being
implemented by potential investors to measure the value of securities, gathering information
about market value of company, product and services provided and overall profitability in a
respective time frame (Company analysis, 2019). The quantitative side of company analysis
includes considering factors which are evaluated numerically like assets, liabilities, cash flow,
income level and earning per share. The process of company analysis involves analysis of
financial statements, find competitors, identify the size of market, make comparison with other
dealing in same industry and make valid comparison. To better understand the concepts of
company analysis BHP Billiton have been selected which is listed on ASX.
In this report, detail analysis of selected company including history, main product,
income and gross profit, stock price movement and number of share form recent annual report.
In addition report also provide the proforma financial statements for next 5 years, calculation of
Project Free Cash Flow with risk analysis and Terminal Value and discount them using discount
rate, which is Weighted Average Cost of Capital (WACC).
MAIN BODY
Overview company
BHP Billiton is an Anglo Australia multinational company which have its headquarter in
Melbourne, Victoria, Australia that have the major function in mining, petroleum and metal
extraction etc. In year 2017, company was ranked the worlds biggest mining company as per the
market share and is consider to be the 3rd largest Melbourne's company according to revenue
generation (About BHP Billiton Limited, 2019).
Background and History
BHP Billiton was founded in 2001 after the merger of BHP and Billiton Plc and thus
become the largest company of Australia by revenue and capital invested in market (Czanderna,
2012). The chairman of company is Ken MacKenzie and CEO is Andrew Mackenzie. The main
objective of BHP Billiton is to provide a framework that support employee, customer, supplier
or shareholder to learn and determine the manner of operation method of company in both
internal and external environment so that it could remain respectful for both individual and
regulations.
1
⊘ This is a preview!⊘
Do you want full access?
Subscribe today to unlock all pages.
Trusted by 1+ million students worldwide
Other Important information.
The main product offered by BHP Billiton are iron ore, petroleum, copper, coal, nickel,
natural gas and uranium. The ownership and management structure are responsible and
accountable for making effective policies and procedures that are beneficial for raising the values
of company (Backes‐Gellner and Veen, 2013). There are number of business that are provided
by company at worldwide level such as mineral America is a manufacture of copper and Zinc
concentrate, iron ore and thermal coal, mineral Australia produces nickel, iron ore, copper and
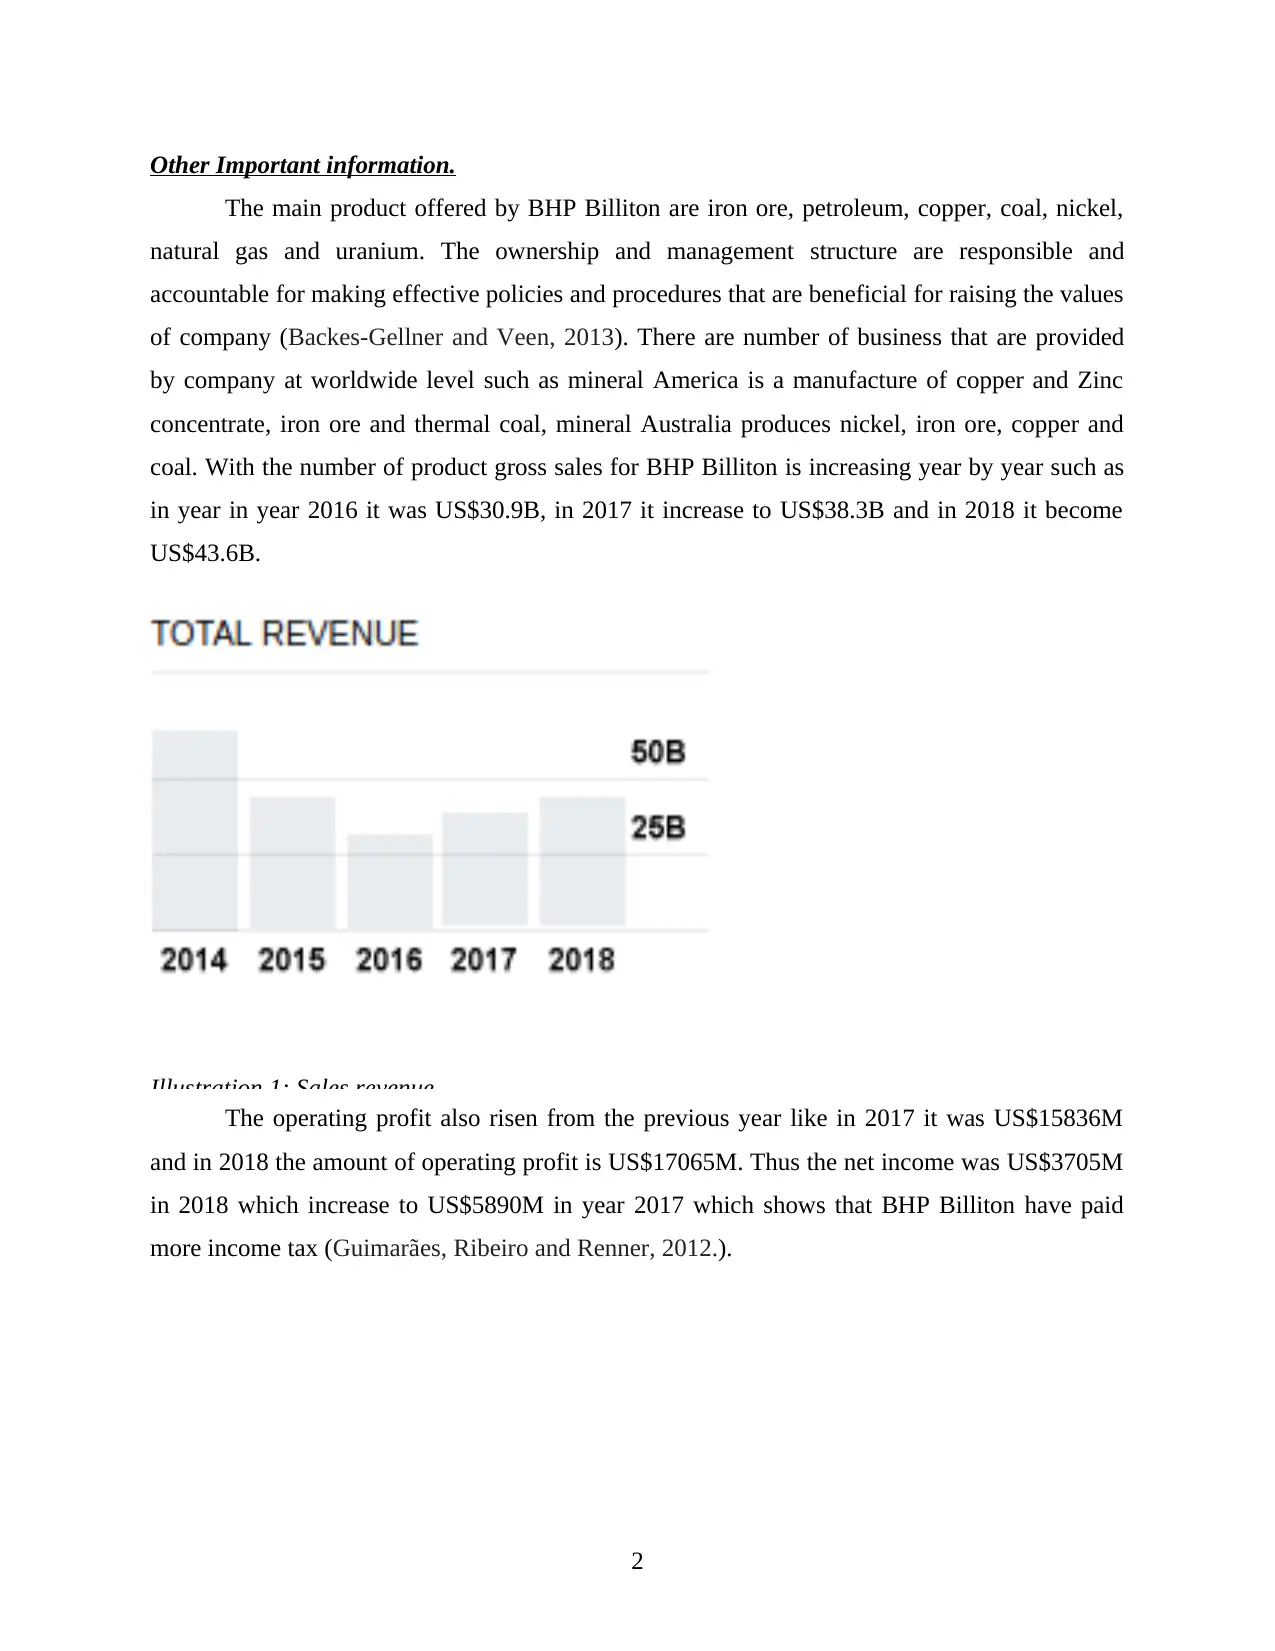
coal. With the number of product gross sales for BHP Billiton is increasing year by year such as
in year in year 2016 it was US$30.9B, in 2017 it increase to US$38.3B and in 2018 it become
US$43.6B.
Illustration 1: Sales revenue
The operating profit also risen from the previous year like in 2017 it was US$15836M
and in 2018 the amount of operating profit is US$17065M. Thus the net income was US$3705M
in 2018 which increase to US$5890M in year 2017 which shows that BHP Billiton have paid
more income tax (Guimarães, Ribeiro and Renner, 2012.).
2
The main product offered by BHP Billiton are iron ore, petroleum, copper, coal, nickel,
natural gas and uranium. The ownership and management structure are responsible and
accountable for making effective policies and procedures that are beneficial for raising the values
of company (Backes‐Gellner and Veen, 2013). There are number of business that are provided
by company at worldwide level such as mineral America is a manufacture of copper and Zinc
concentrate, iron ore and thermal coal, mineral Australia produces nickel, iron ore, copper and
coal. With the number of product gross sales for BHP Billiton is increasing year by year such as
in year in year 2016 it was US$30.9B, in 2017 it increase to US$38.3B and in 2018 it become
US$43.6B.
Illustration 1: Sales revenue
The operating profit also risen from the previous year like in 2017 it was US$15836M
and in 2018 the amount of operating profit is US$17065M. Thus the net income was US$3705M
in 2018 which increase to US$5890M in year 2017 which shows that BHP Billiton have paid
more income tax (Guimarães, Ribeiro and Renner, 2012.).
2
Paraphrase This Document
Need a fresh take? Get an instant paraphrase of this document with our AI Paraphraser
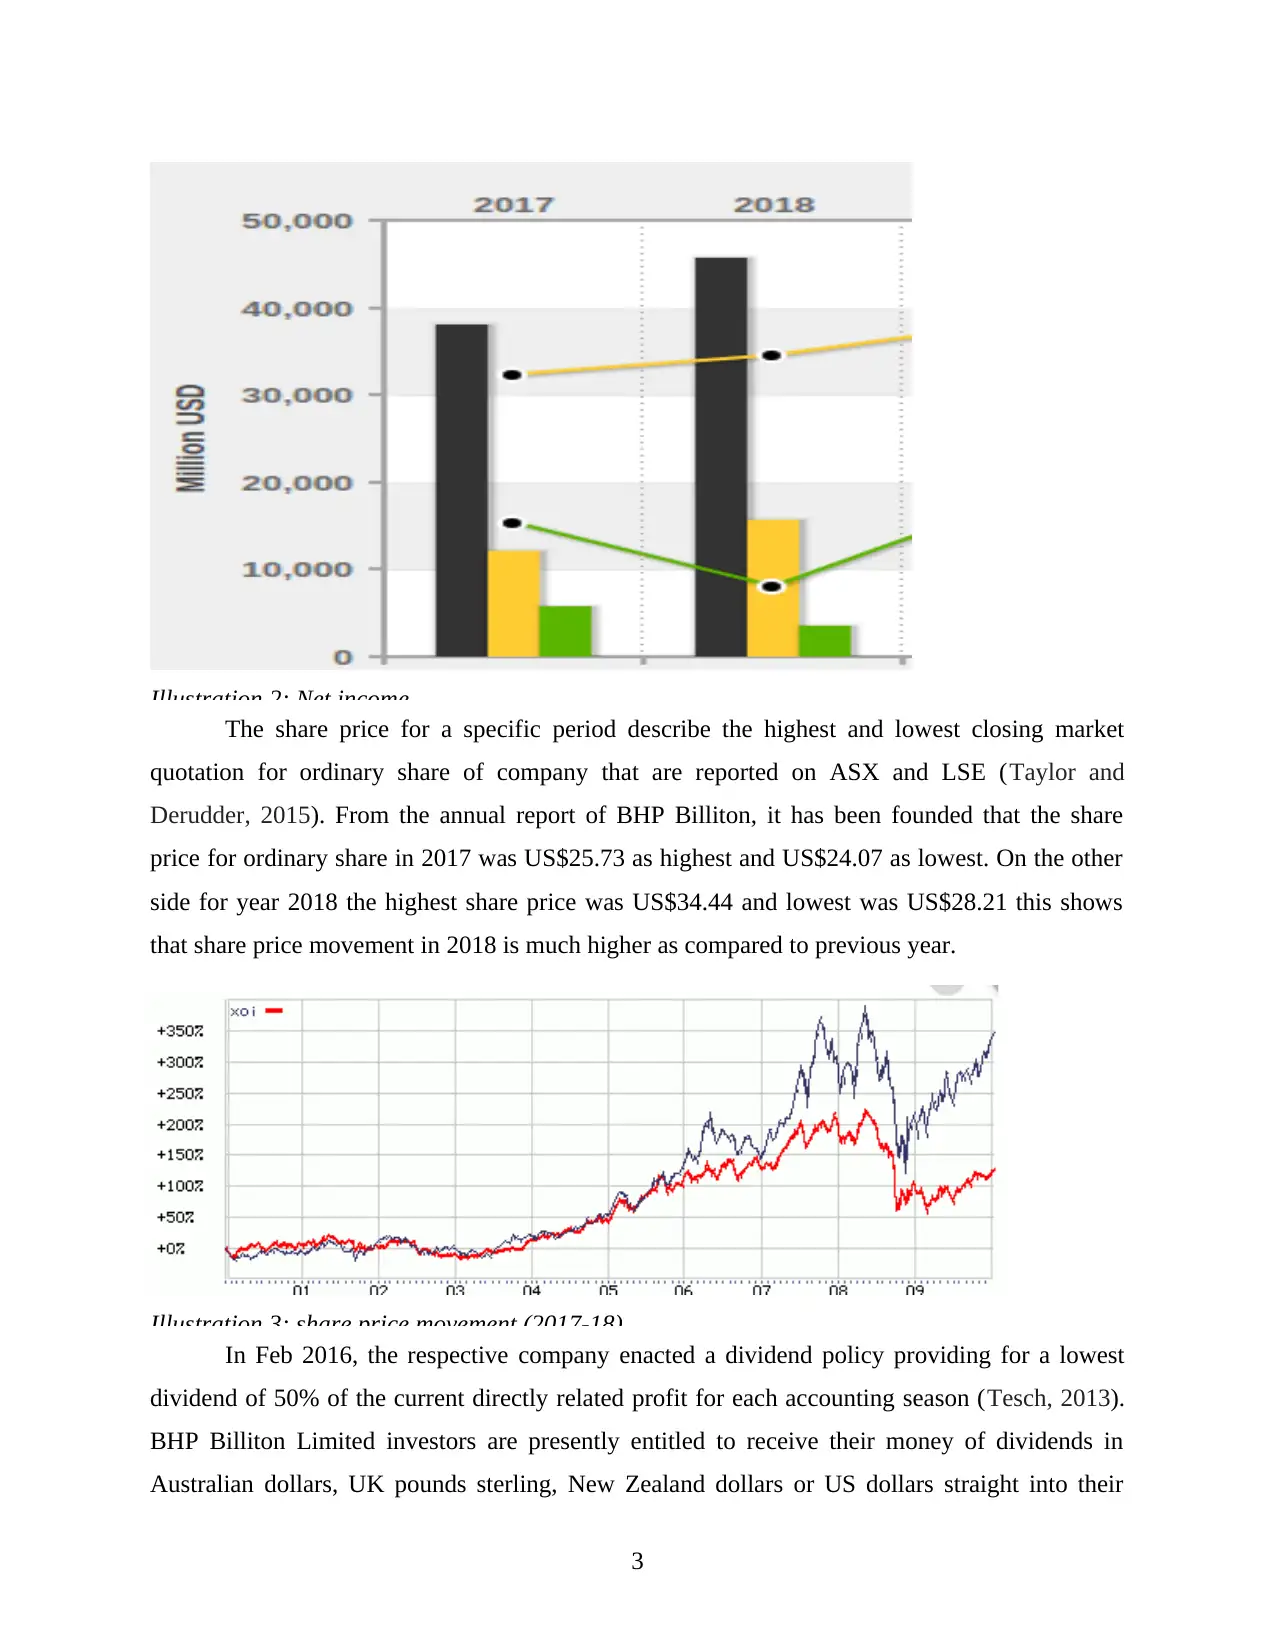
Illustration 2: Net income
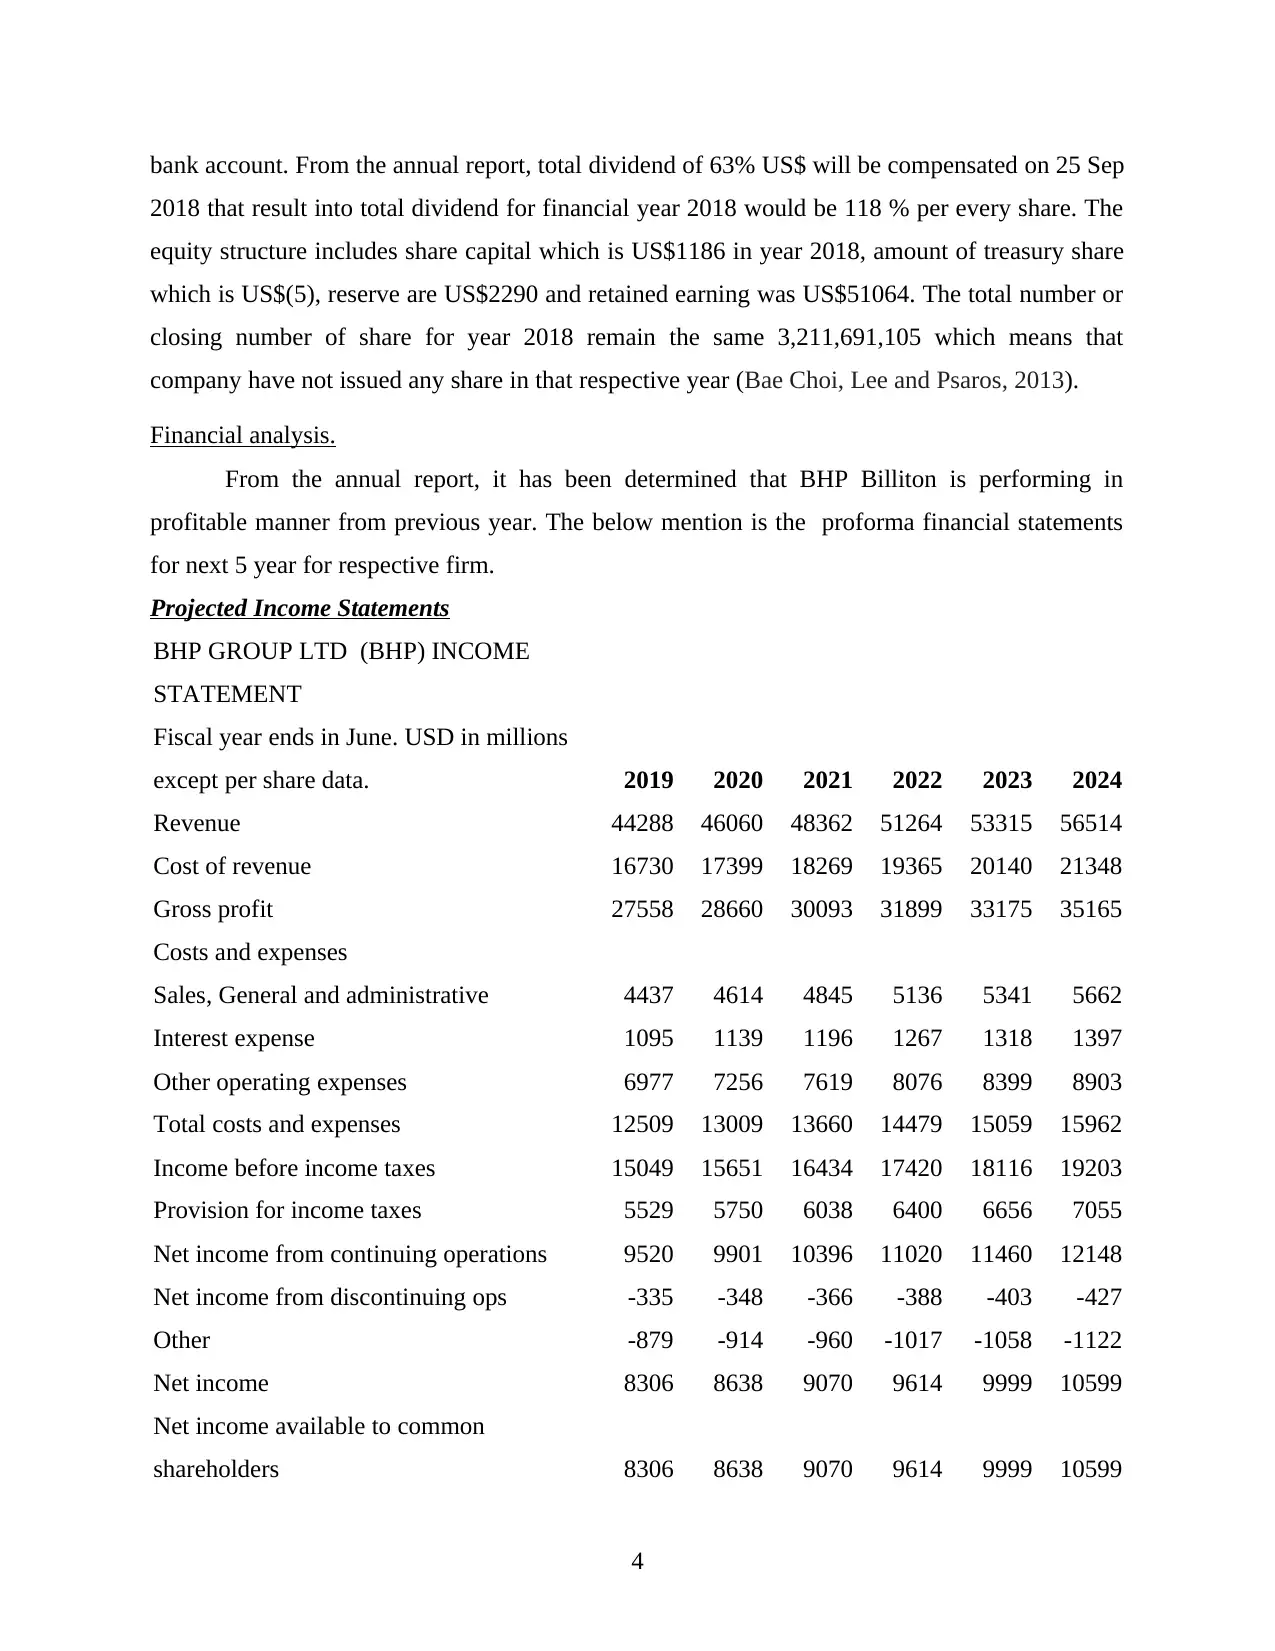
The share price for a specific period describe the highest and lowest closing market
quotation for ordinary share of company that are reported on ASX and LSE (Taylor and
Derudder, 2015). From the annual report of BHP Billiton, it has been founded that the share
price for ordinary share in 2017 was US$25.73 as highest and US$24.07 as lowest. On the other
side for year 2018 the highest share price was US$34.44 and lowest was US$28.21 this shows
that share price movement in 2018 is much higher as compared to previous year.
Illustration 3: share price movement (2017-18)
In Feb 2016, the respective company enacted a dividend policy providing for a lowest
dividend of 50% of the current directly related profit for each accounting season (Tesch, 2013).
BHP Billiton Limited investors are presently entitled to receive their money of dividends in
Australian dollars, UK pounds sterling, New Zealand dollars or US dollars straight into their
3
bank account. From the annual report, total dividend of 63% US$ will be compensated on 25 Sep
2018 that result into total dividend for financial year 2018 would be 118 % per every share. The
equity structure includes share capital which is US$1186 in year 2018, amount of treasury share
which is US$(5), reserve are US$2290 and retained earning was US$51064. The total number or
closing number of share for year 2018 remain the same 3,211,691,105 which means that
company have not issued any share in that respective year (Bae Choi, Lee and Psaros, 2013).
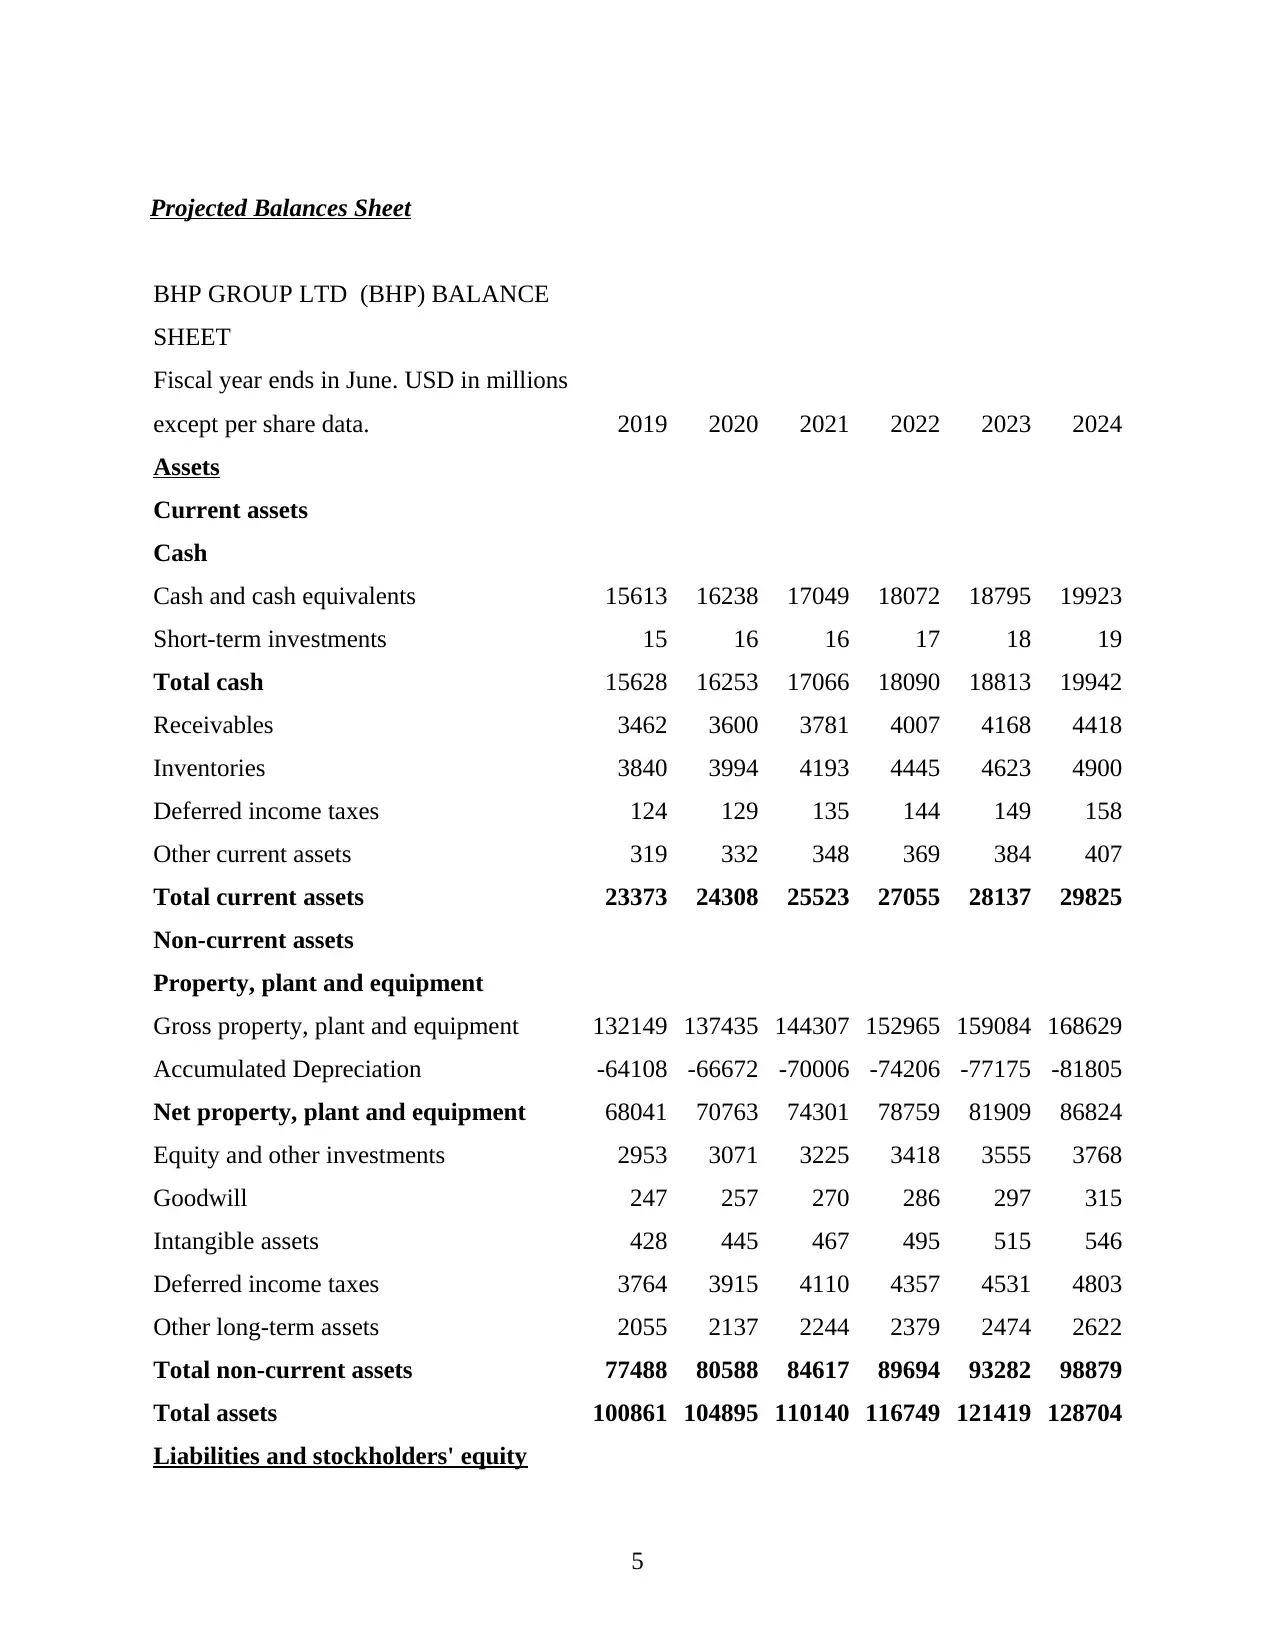
Financial analysis.
From the annual report, it has been determined that BHP Billiton is performing in
profitable manner from previous year. The below mention is the proforma financial statements
for next 5 year for respective firm.
Projected Income Statements
BHP GROUP LTD (BHP) INCOME
STATEMENT
Fiscal year ends in June. USD in millions
except per share data. 2019 2020 2021 2022 2023 2024
Revenue 44288 46060 48362 51264 53315 56514
Cost of revenue 16730 17399 18269 19365 20140 21348
Gross profit 27558 28660 30093 31899 33175 35165
Costs and expenses
Sales, General and administrative 4437 4614 4845 5136 5341 5662
Interest expense 1095 1139 1196 1267 1318 1397
Other operating expenses 6977 7256 7619 8076 8399 8903
Total costs and expenses 12509 13009 13660 14479 15059 15962
Income before income taxes 15049 15651 16434 17420 18116 19203
Provision for income taxes 5529 5750 6038 6400 6656 7055
Net income from continuing operations 9520 9901 10396 11020 11460 12148
Net income from discontinuing ops -335 -348 -366 -388 -403 -427
Other -879 -914 -960 -1017 -1058 -1122
Net income 8306 8638 9070 9614 9999 10599
Net income available to common
shareholders 8306 8638 9070 9614 9999 10599
4
2018 that result into total dividend for financial year 2018 would be 118 % per every share. The
equity structure includes share capital which is US$1186 in year 2018, amount of treasury share
which is US$(5), reserve are US$2290 and retained earning was US$51064. The total number or
closing number of share for year 2018 remain the same 3,211,691,105 which means that
company have not issued any share in that respective year (Bae Choi, Lee and Psaros, 2013).
Financial analysis.
From the annual report, it has been determined that BHP Billiton is performing in
profitable manner from previous year. The below mention is the proforma financial statements
for next 5 year for respective firm.
Projected Income Statements
BHP GROUP LTD (BHP) INCOME
STATEMENT
Fiscal year ends in June. USD in millions
except per share data. 2019 2020 2021 2022 2023 2024
Revenue 44288 46060 48362 51264 53315 56514
Cost of revenue 16730 17399 18269 19365 20140 21348
Gross profit 27558 28660 30093 31899 33175 35165
Costs and expenses
Sales, General and administrative 4437 4614 4845 5136 5341 5662
Interest expense 1095 1139 1196 1267 1318 1397
Other operating expenses 6977 7256 7619 8076 8399 8903
Total costs and expenses 12509 13009 13660 14479 15059 15962
Income before income taxes 15049 15651 16434 17420 18116 19203
Provision for income taxes 5529 5750 6038 6400 6656 7055
Net income from continuing operations 9520 9901 10396 11020 11460 12148
Net income from discontinuing ops -335 -348 -366 -388 -403 -427
Other -879 -914 -960 -1017 -1058 -1122
Net income 8306 8638 9070 9614 9999 10599
Net income available to common
shareholders 8306 8638 9070 9614 9999 10599
4
⊘ This is a preview!⊘
Do you want full access?
Subscribe today to unlock all pages.
Trusted by 1+ million students worldwide
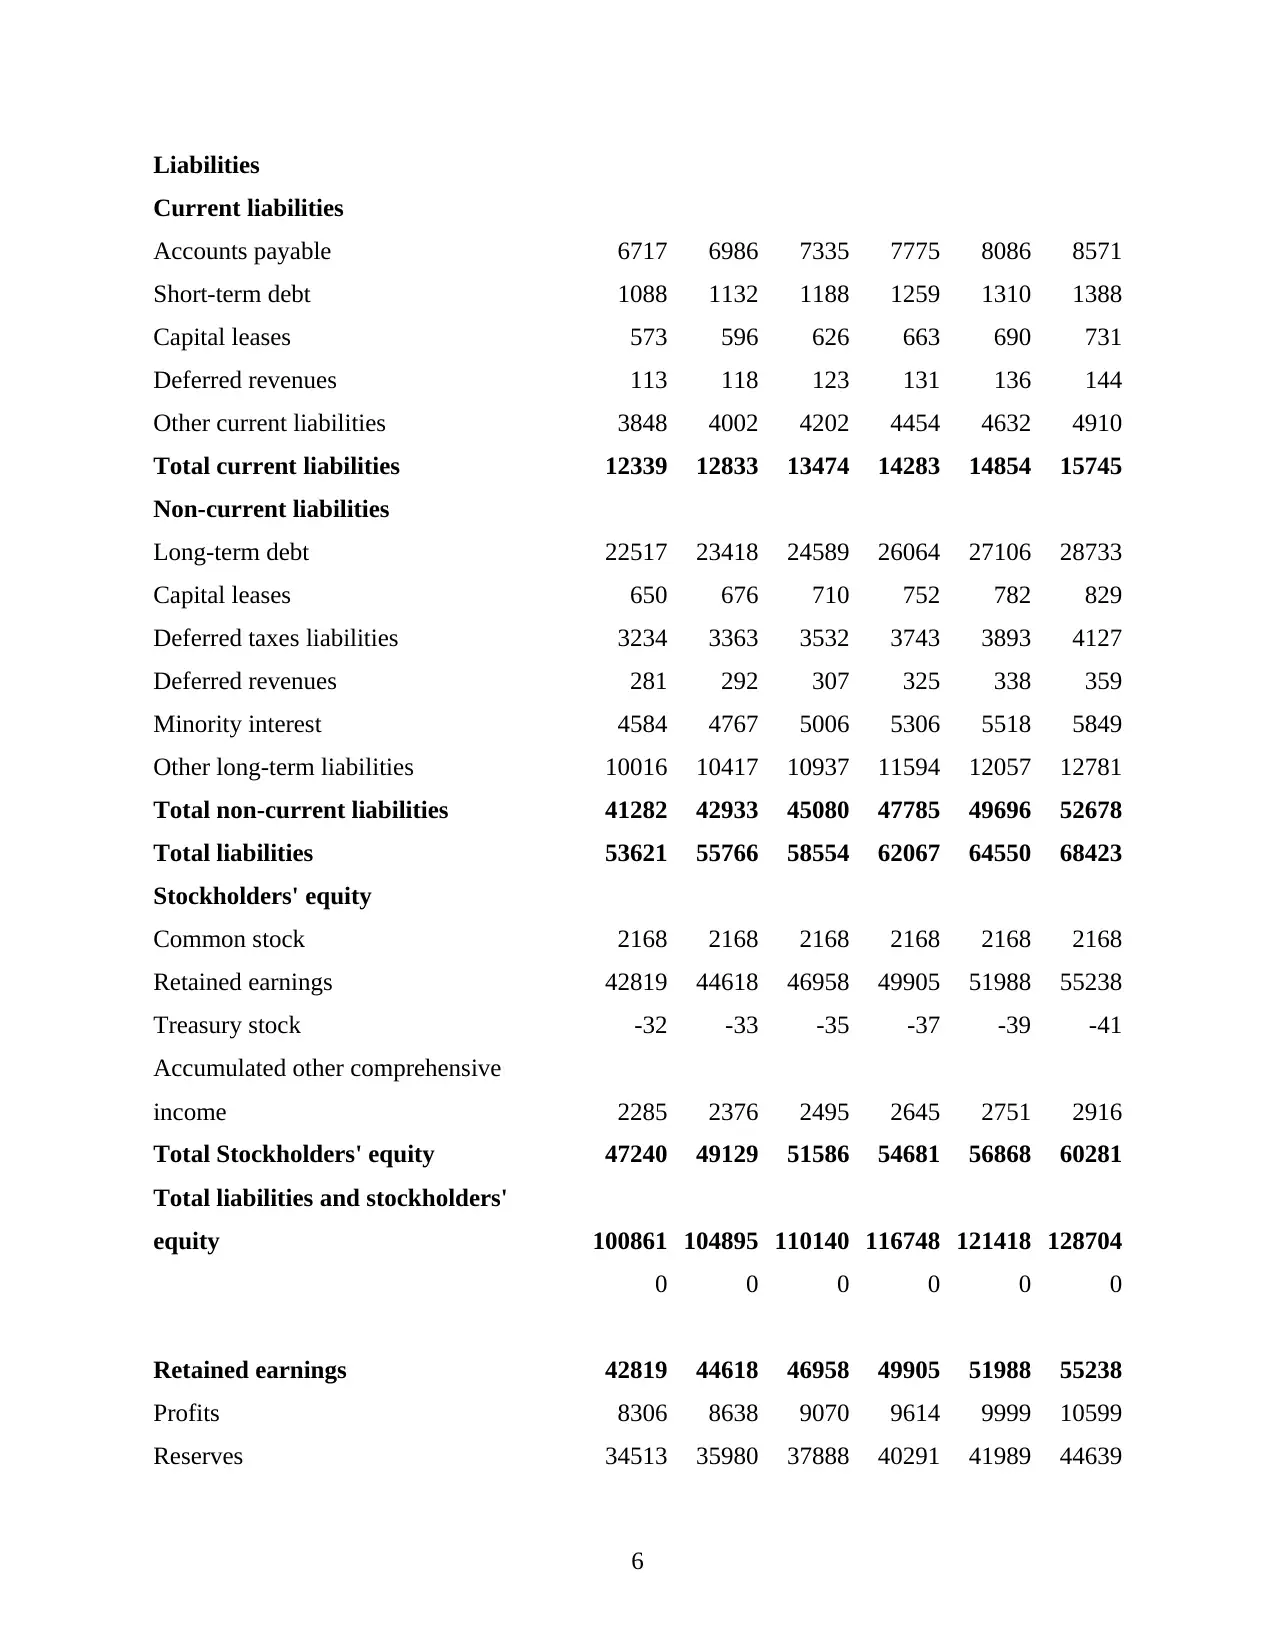
Projected Balances Sheet
BHP GROUP LTD (BHP) BALANCE
SHEET
Fiscal year ends in June. USD in millions
except per share data. 2019 2020 2021 2022 2023 2024
Assets
Current assets
Cash
Cash and cash equivalents 15613 16238 17049 18072 18795 19923
Short-term investments 15 16 16 17 18 19
Total cash 15628 16253 17066 18090 18813 19942
Receivables 3462 3600 3781 4007 4168 4418
Inventories 3840 3994 4193 4445 4623 4900
Deferred income taxes 124 129 135 144 149 158
Other current assets 319 332 348 369 384 407
Total current assets 23373 24308 25523 27055 28137 29825
Non-current assets
Property, plant and equipment
Gross property, plant and equipment 132149 137435 144307 152965 159084 168629
Accumulated Depreciation -64108 -66672 -70006 -74206 -77175 -81805
Net property, plant and equipment 68041 70763 74301 78759 81909 86824
Equity and other investments 2953 3071 3225 3418 3555 3768
Goodwill 247 257 270 286 297 315
Intangible assets 428 445 467 495 515 546
Deferred income taxes 3764 3915 4110 4357 4531 4803
Other long-term assets 2055 2137 2244 2379 2474 2622
Total non-current assets 77488 80588 84617 89694 93282 98879
Total assets 100861 104895 110140 116749 121419 128704
Liabilities and stockholders' equity
5
Paraphrase This Document
Need a fresh take? Get an instant paraphrase of this document with our AI Paraphraser
Liabilities
Current liabilities
Accounts payable 6717 6986 7335 7775 8086 8571
Short-term debt 1088 1132 1188 1259 1310 1388
Capital leases 573 596 626 663 690 731
Deferred revenues 113 118 123 131 136 144
Other current liabilities 3848 4002 4202 4454 4632 4910
Total current liabilities 12339 12833 13474 14283 14854 15745
Non-current liabilities
Long-term debt 22517 23418 24589 26064 27106 28733
Capital leases 650 676 710 752 782 829
Deferred taxes liabilities 3234 3363 3532 3743 3893 4127
Deferred revenues 281 292 307 325 338 359
Minority interest 4584 4767 5006 5306 5518 5849
Other long-term liabilities 10016 10417 10937 11594 12057 12781
Total non-current liabilities 41282 42933 45080 47785 49696 52678
Total liabilities 53621 55766 58554 62067 64550 68423
Stockholders' equity
Common stock 2168 2168 2168 2168 2168 2168
Retained earnings 42819 44618 46958 49905 51988 55238
Treasury stock -32 -33 -35 -37 -39 -41
Accumulated other comprehensive
income 2285 2376 2495 2645 2751 2916
Total Stockholders' equity 47240 49129 51586 54681 56868 60281
Total liabilities and stockholders'
equity 100861 104895 110140 116748 121418 128704
0 0 0 0 0 0
Retained earnings 42819 44618 46958 49905 51988 55238
Profits 8306 8638 9070 9614 9999 10599
Reserves 34513 35980 37888 40291 41989 44639
6
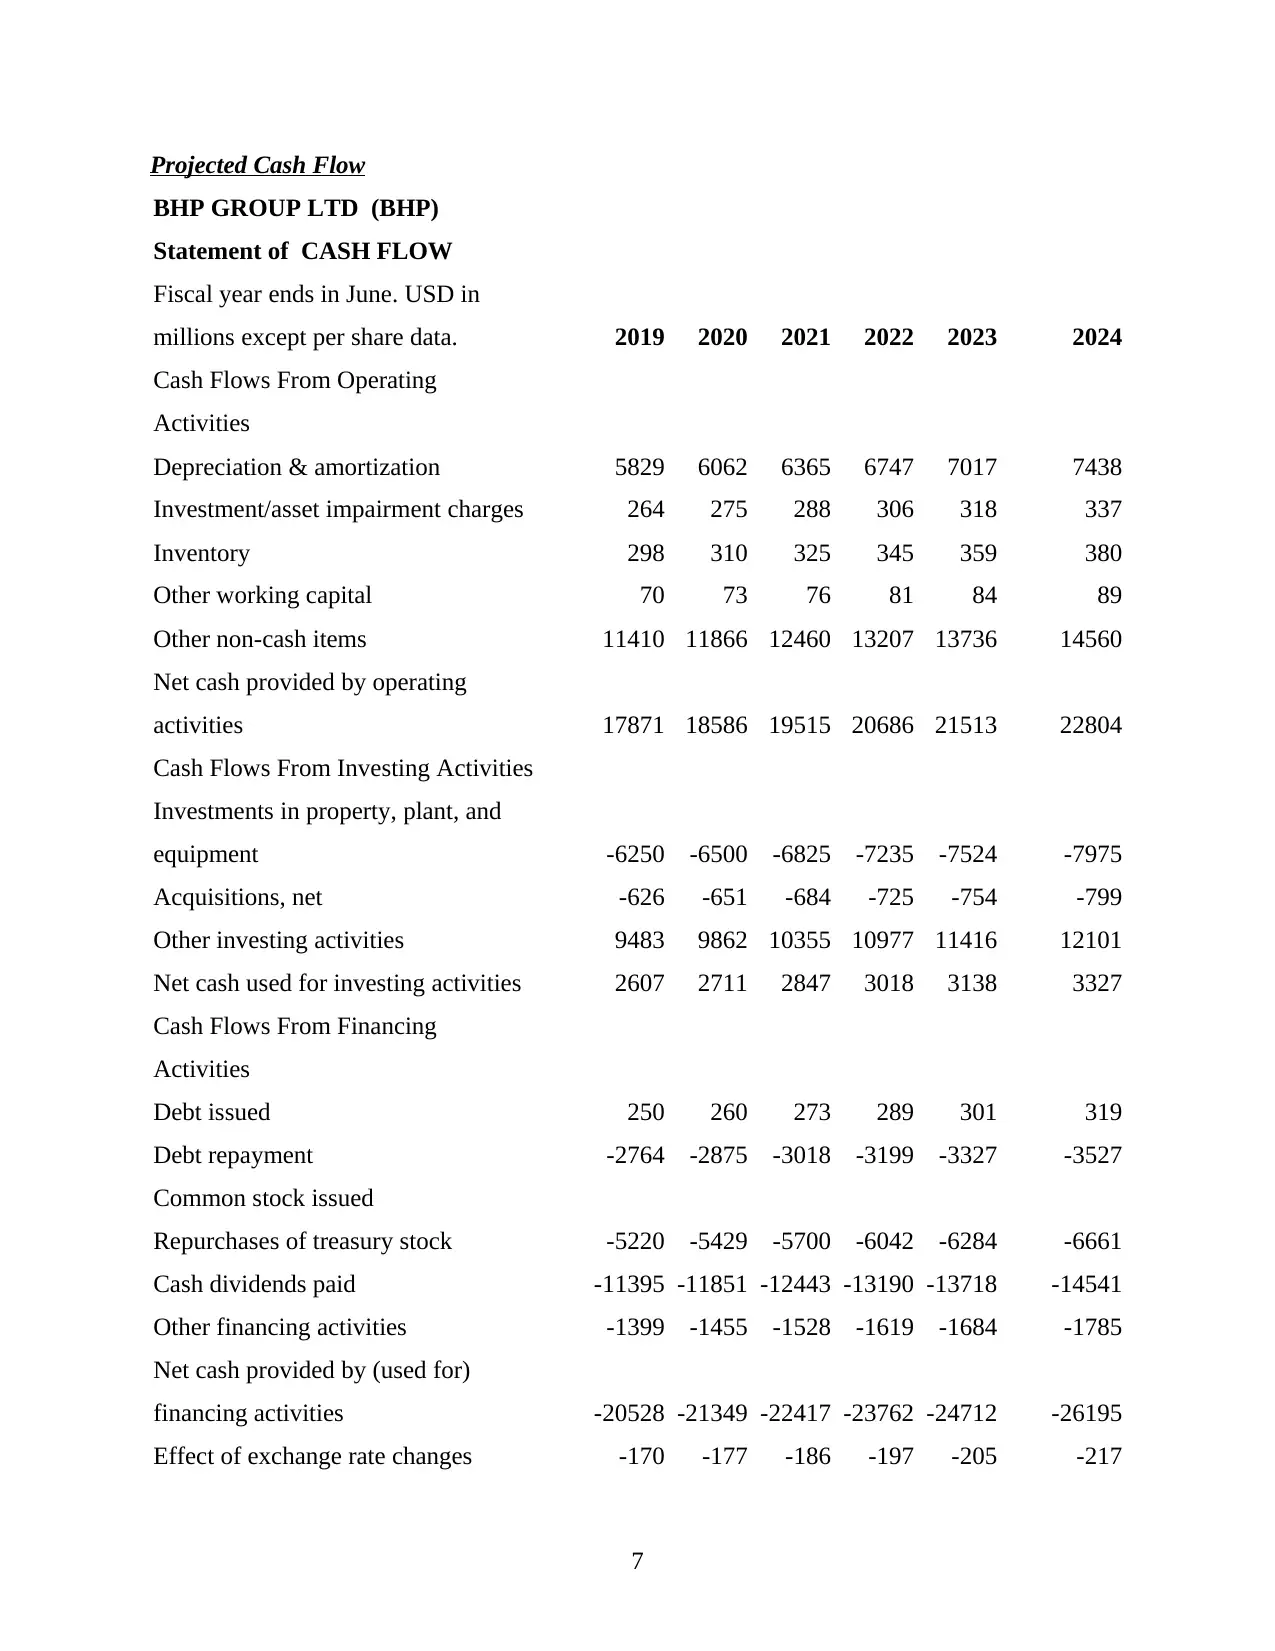
Projected Cash Flow
BHP GROUP LTD (BHP)
Statement of CASH FLOW
Fiscal year ends in June. USD in
millions except per share data. 2019 2020 2021 2022 2023 2024
Cash Flows From Operating
Activities
Depreciation & amortization 5829 6062 6365 6747 7017 7438
Investment/asset impairment charges 264 275 288 306 318 337
Inventory 298 310 325 345 359 380
Other working capital 70 73 76 81 84 89
Other non-cash items 11410 11866 12460 13207 13736 14560
Net cash provided by operating
activities 17871 18586 19515 20686 21513 22804
Cash Flows From Investing Activities
Investments in property, plant, and
equipment -6250 -6500 -6825 -7235 -7524 -7975
Acquisitions, net -626 -651 -684 -725 -754 -799
Other investing activities 9483 9862 10355 10977 11416 12101
Net cash used for investing activities 2607 2711 2847 3018 3138 3327
Cash Flows From Financing
Activities
Debt issued 250 260 273 289 301 319
Debt repayment -2764 -2875 -3018 -3199 -3327 -3527
Common stock issued
Repurchases of treasury stock -5220 -5429 -5700 -6042 -6284 -6661
Cash dividends paid -11395 -11851 -12443 -13190 -13718 -14541
Other financing activities -1399 -1455 -1528 -1619 -1684 -1785
Net cash provided by (used for)
financing activities -20528 -21349 -22417 -23762 -24712 -26195
Effect of exchange rate changes -170 -177 -186 -197 -205 -217
7
⊘ This is a preview!⊘
Do you want full access?
Subscribe today to unlock all pages.
Trusted by 1+ million students worldwide
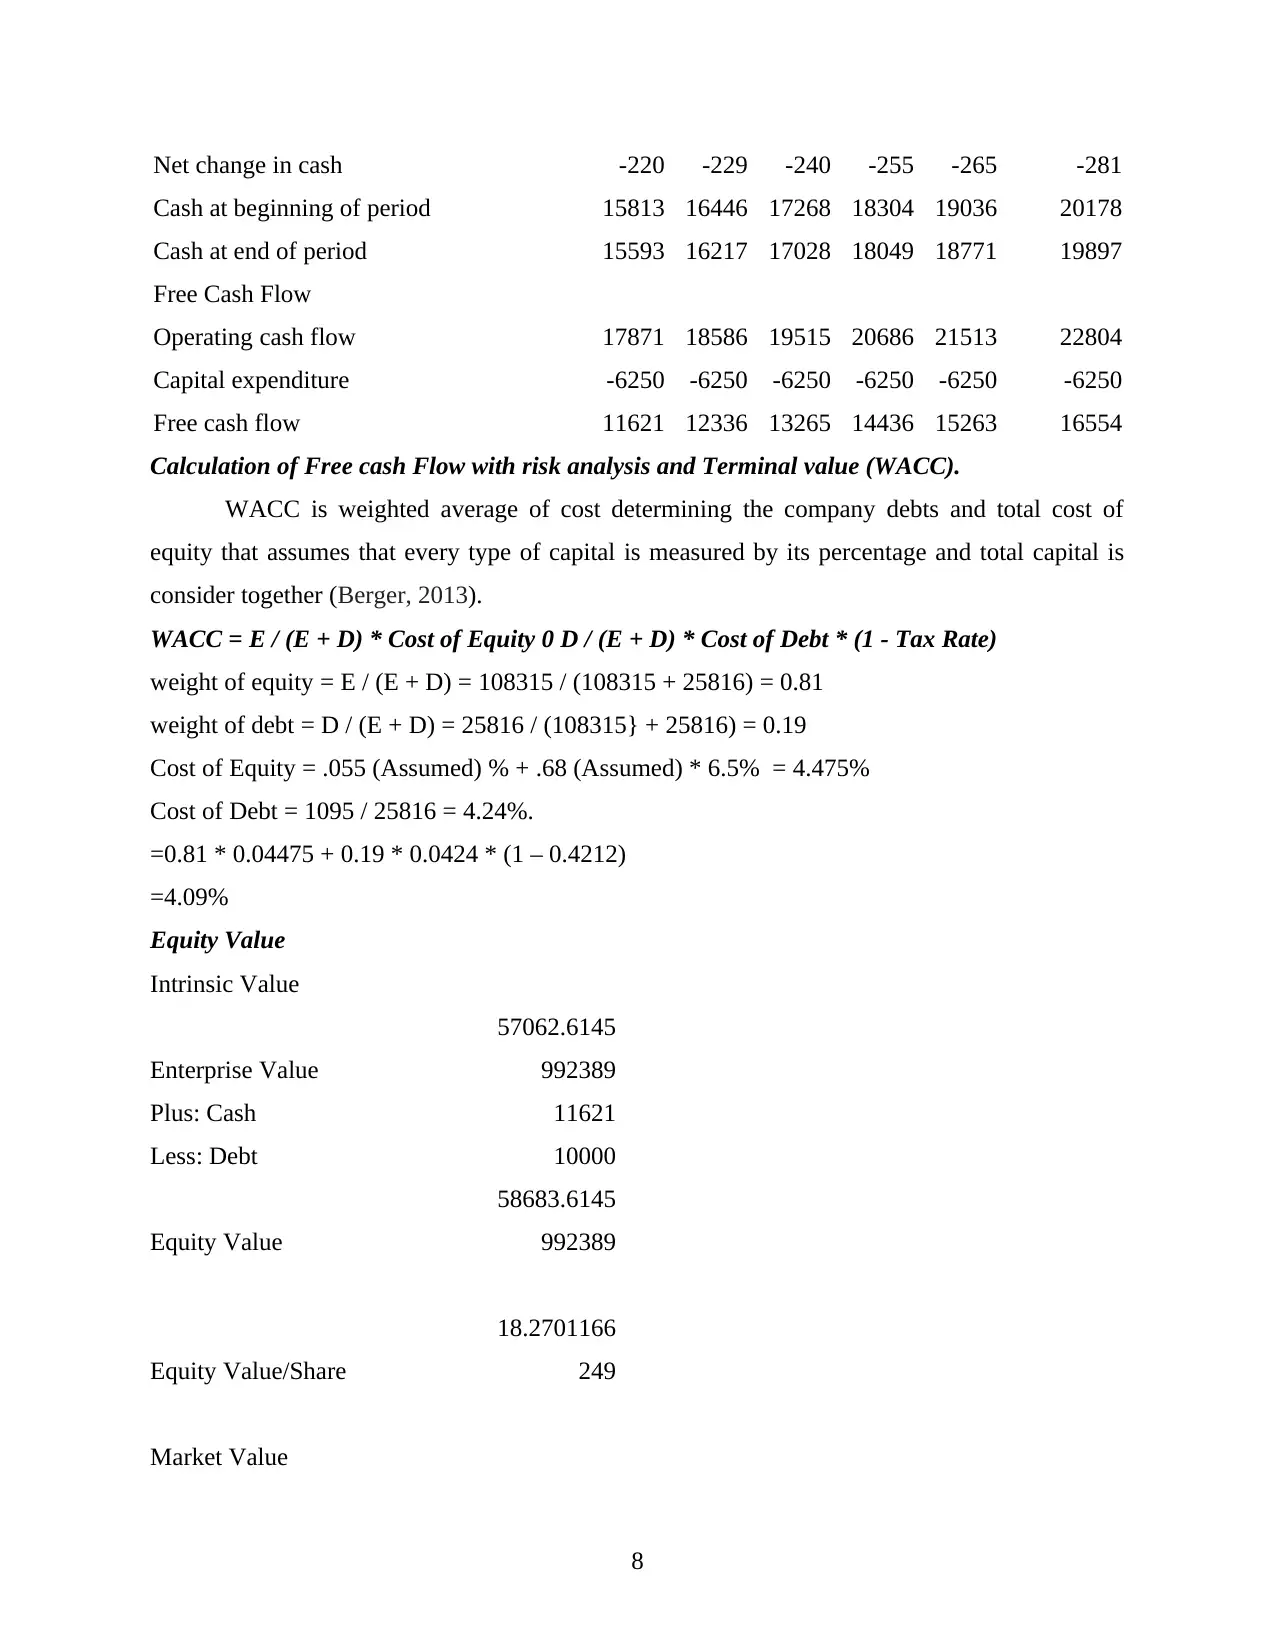
Net change in cash -220 -229 -240 -255 -265 -281
Cash at beginning of period 15813 16446 17268 18304 19036 20178
Cash at end of period 15593 16217 17028 18049 18771 19897
Free Cash Flow
Operating cash flow 17871 18586 19515 20686 21513 22804
Capital expenditure -6250 -6250 -6250 -6250 -6250 -6250
Free cash flow 11621 12336 13265 14436 15263 16554
Calculation of Free cash Flow with risk analysis and Terminal value (WACC).
WACC is weighted average of cost determining the company debts and total cost of
equity that assumes that every type of capital is measured by its percentage and total capital is
consider together (Berger, 2013).
WACC = E / (E + D) * Cost of Equity 0 D / (E + D) * Cost of Debt * (1 - Tax Rate)
weight of equity = E / (E + D) = 108315 / (108315 + 25816) = 0.81
weight of debt = D / (E + D) = 25816 / (108315} + 25816) = 0.19
Cost of Equity = .055 (Assumed) % + .68 (Assumed) * 6.5% = 4.475%
Cost of Debt = 1095 / 25816 = 4.24%.
=0.81 * 0.04475 + 0.19 * 0.0424 * (1 – 0.4212)
=4.09%
Equity Value
Intrinsic Value
Enterprise Value
57062.6145
992389
Plus: Cash 11621
Less: Debt 10000
Equity Value
58683.6145
992389
Equity Value/Share
18.2701166
249
Market Value
8
Paraphrase This Document
Need a fresh take? Get an instant paraphrase of this document with our AI Paraphraser
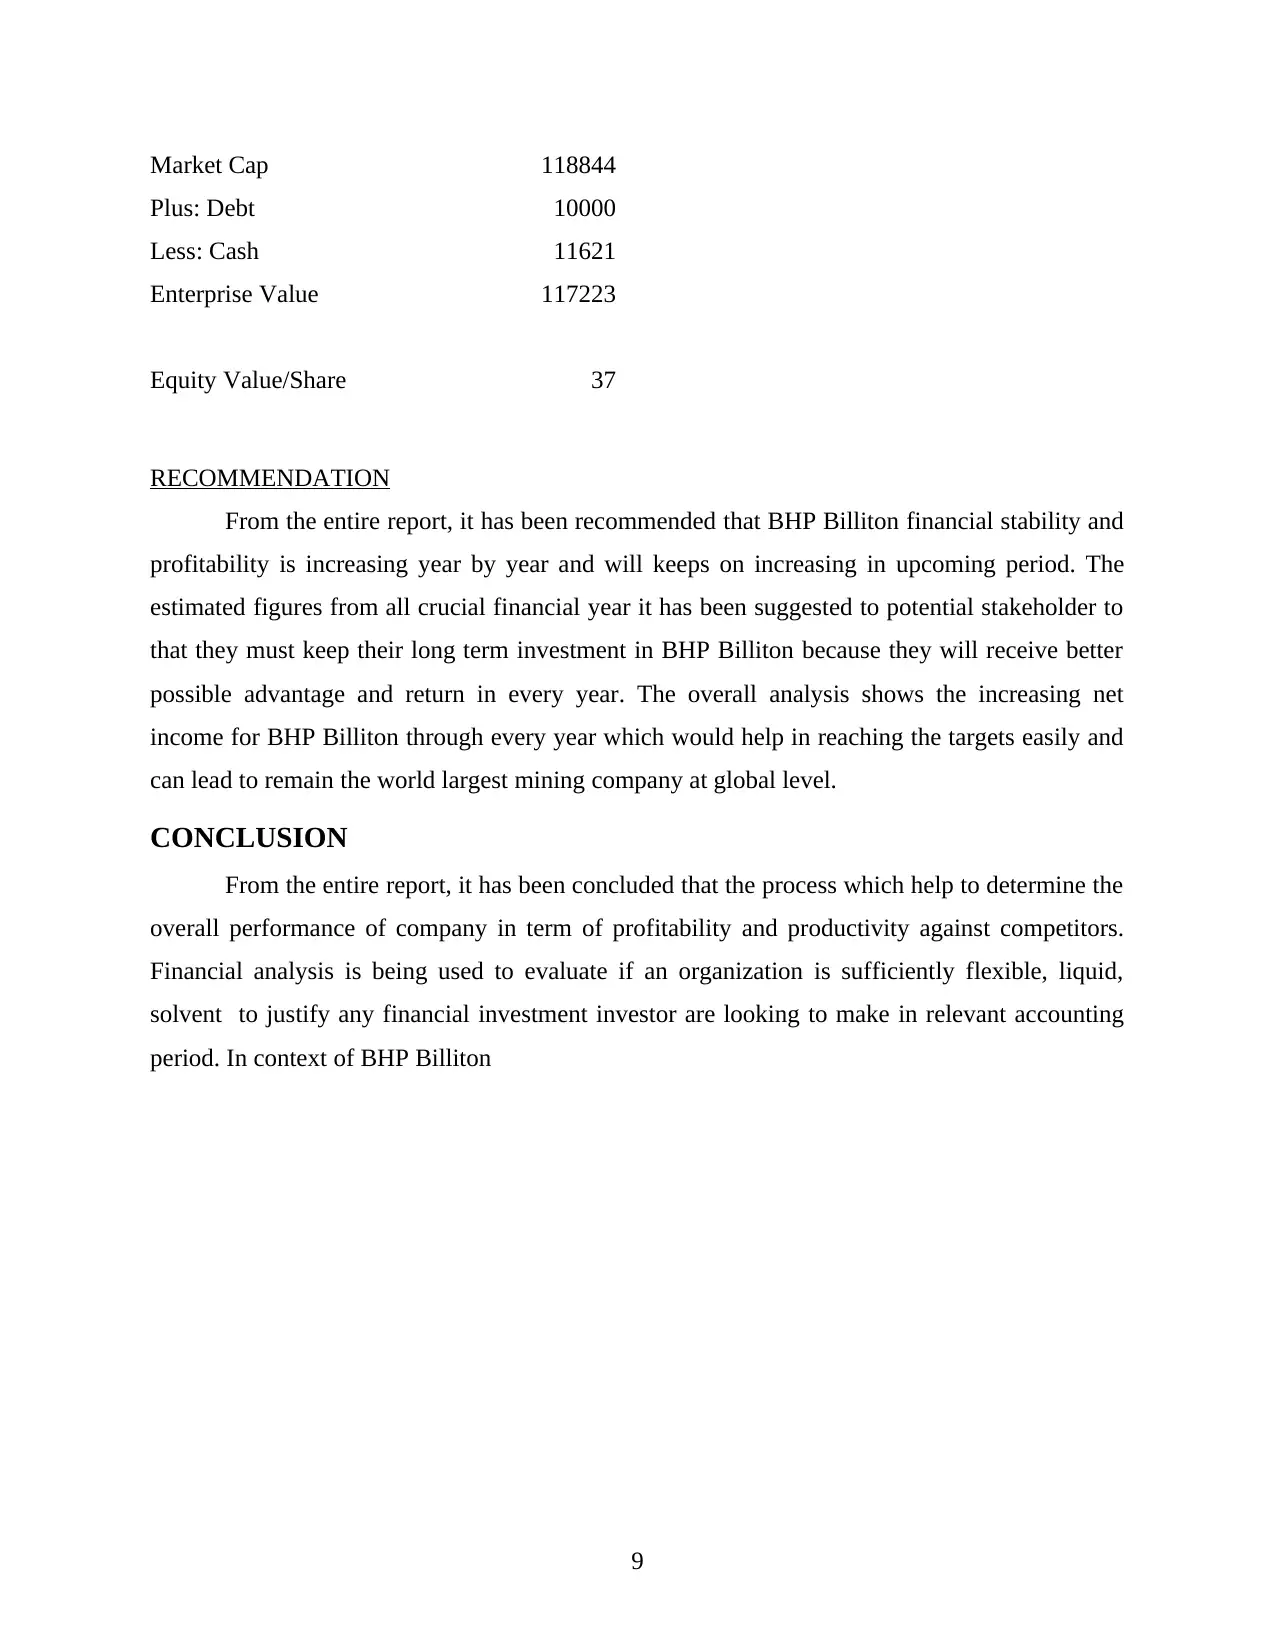
Market Cap 118844
Plus: Debt 10000
Less: Cash 11621
Enterprise Value 117223
Equity Value/Share 37
RECOMMENDATION
From the entire report, it has been recommended that BHP Billiton financial stability and
profitability is increasing year by year and will keeps on increasing in upcoming period. The
estimated figures from all crucial financial year it has been suggested to potential stakeholder to
that they must keep their long term investment in BHP Billiton because they will receive better
possible advantage and return in every year. The overall analysis shows the increasing net
income for BHP Billiton through every year which would help in reaching the targets easily and
can lead to remain the world largest mining company at global level.
CONCLUSION
From the entire report, it has been concluded that the process which help to determine the
overall performance of company in term of profitability and productivity against competitors.
Financial analysis is being used to evaluate if an organization is sufficiently flexible, liquid,
solvent to justify any financial investment investor are looking to make in relevant accounting
period. In context of BHP Billiton
9
REFERENCES
Books and Journals
Backes‐Gellner, U. and Veen, S., 2013. Positive effects of ageing and age diversity in innovative
companies–large‐scale empirical evidence on company productivity. Human Resource
Management Journal. 23(3). pp.279-295.
Bae Choi, B., Lee, D. and Psaros, J., 2013. An analysis of Australian company carbon emission
disclosures. Pacific Accounting Review. 25(1). pp.58-79.
Berger, J. O., 2013. Statistical decision theory and Bayesian analysis. Springer Science &
Business Media.
Czanderna, A. W. ed., 2012. Methods of surface analysis (Vol. 1). Elsevier.
Guimarães, L. D. M., Ribeiro, J. L. D. and Renner, J. S., 2012. Cost–benefit analysis of a socio-
technical intervention in a Brazilian footwear company. Applied ergonomics. 43(5).
pp.948-957.
Taylor, P. J. and Derudder, B., 2015. World city network: a global urban analysis. Routledge.
Tesch, R., 2013. Qualitative research: Analysis types and software. Routledge.
Online
About BHP Billiton Limited. 2019. [Online] Available through:
<https://www.bhp.com/>.
Company analysis. 2019. [Online] Available through:
<https://www.readyratios.com/reference/analysis/company_analysis.html>.
10
⊘ This is a preview!⊘
Do you want full access?
Subscribe today to unlock all pages.
Trusted by 1+ million students worldwide
1 out of 15
Related Documents


Your All-in-One AI-Powered Toolkit for Academic Success.
+13062052269
info@desklib.com
Available 24*7 on WhatsApp / Email
![[object Object]](/_next/static/media/star-bottom.7253800d.svg)
Unlock your academic potential
Copyright © 2020–2026 A2Z Services. All Rights Reserved. Developed and managed by ZUCOL.