Financial Analysis Report: BHP Billiton's Performance 2017 and 2018

Verified

Added on  2023/06/04

|12
|1111
|418
Report
AI Summary
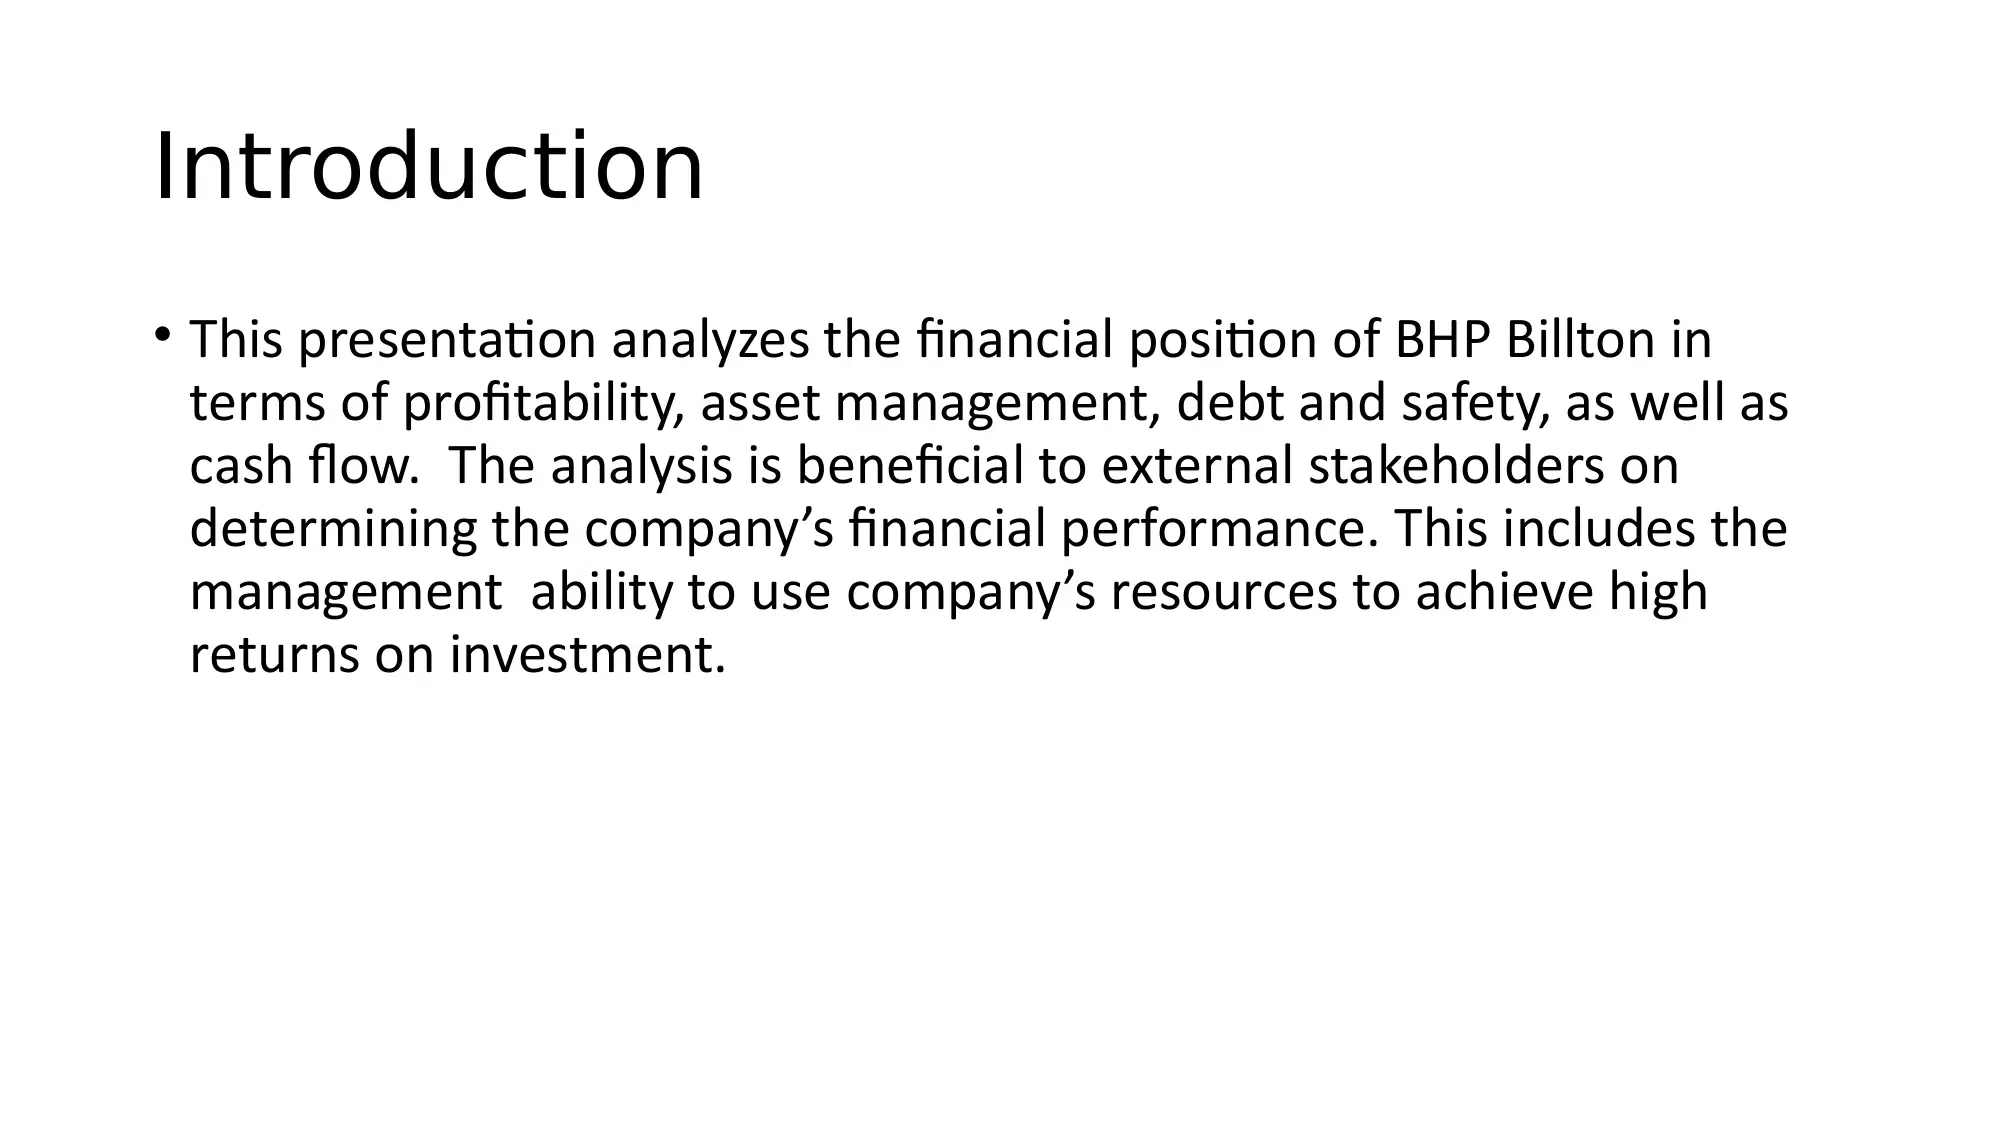
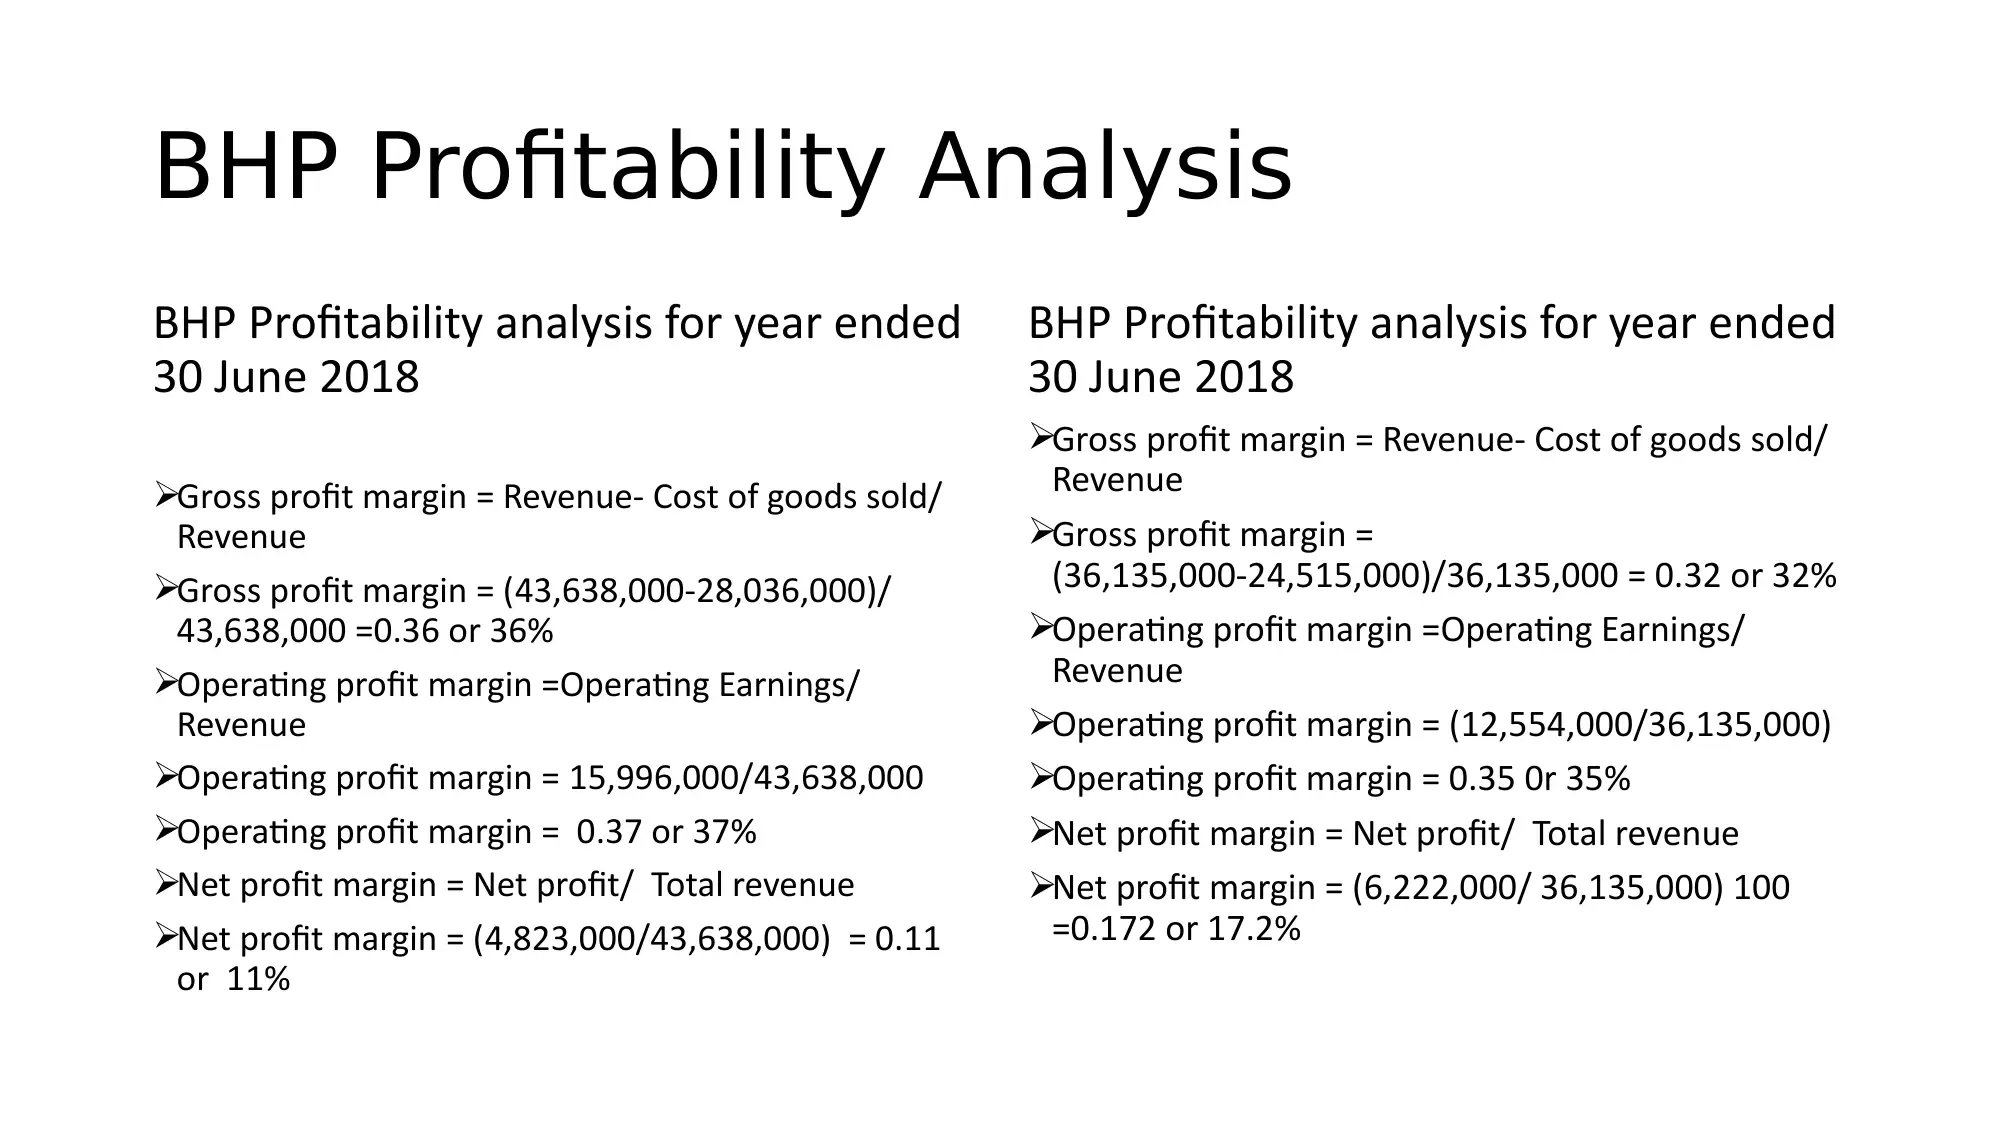
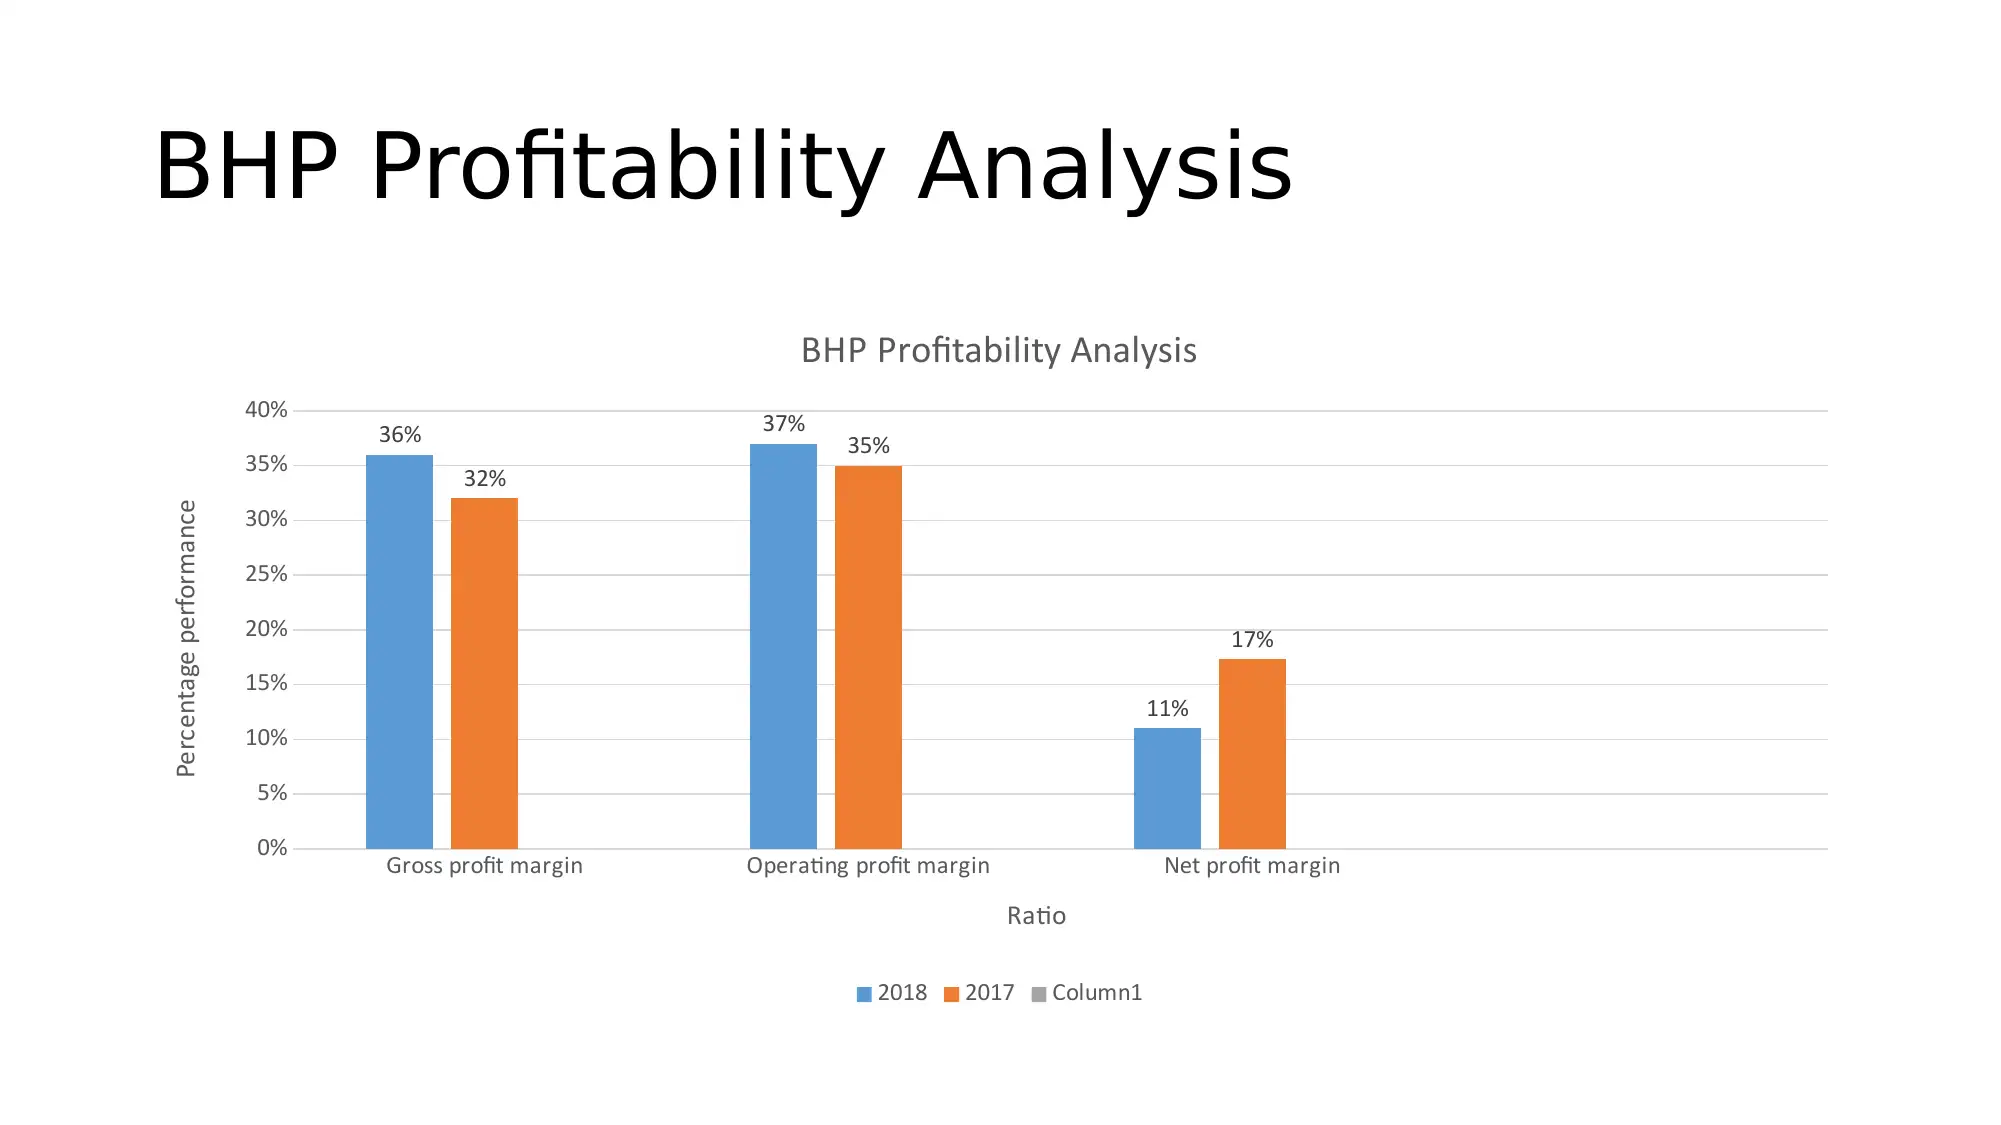
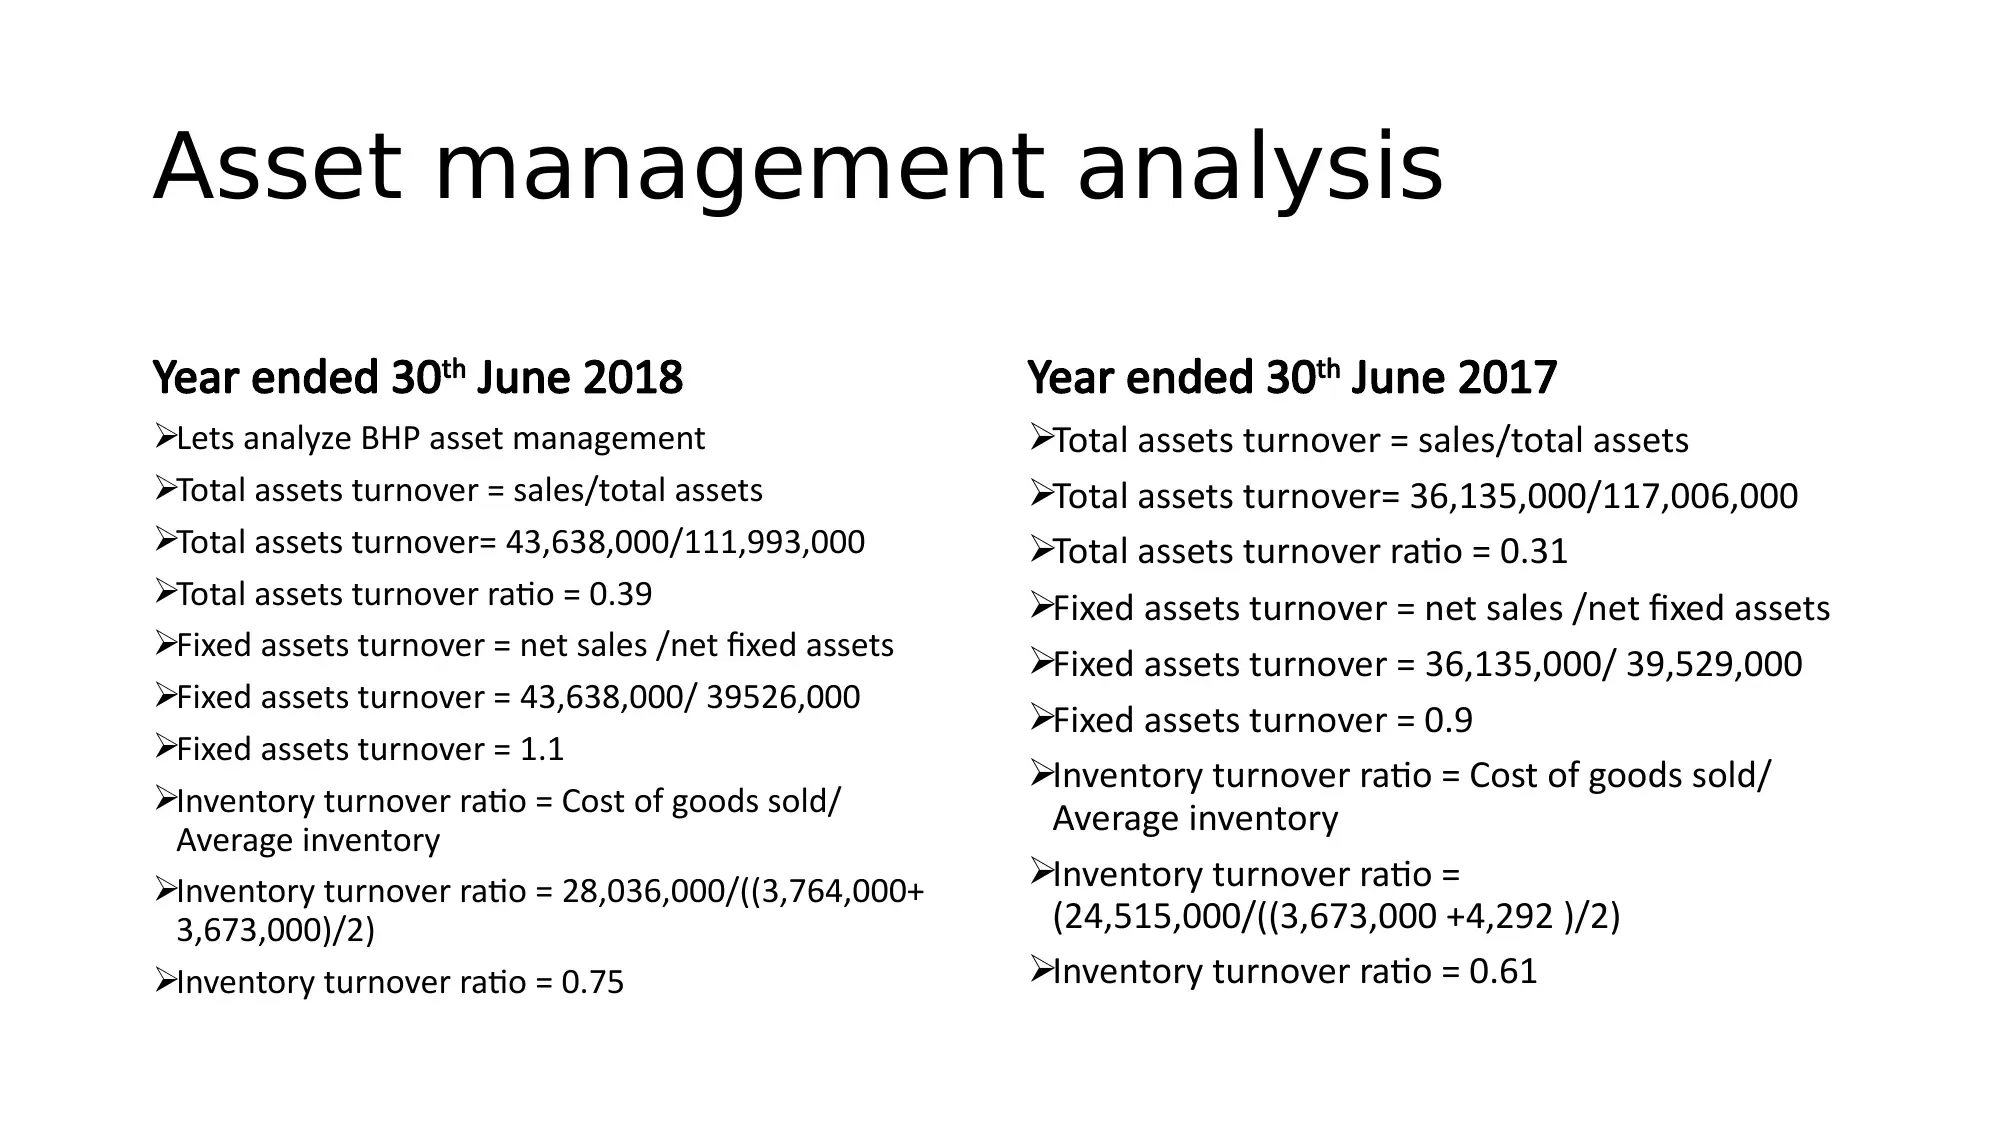
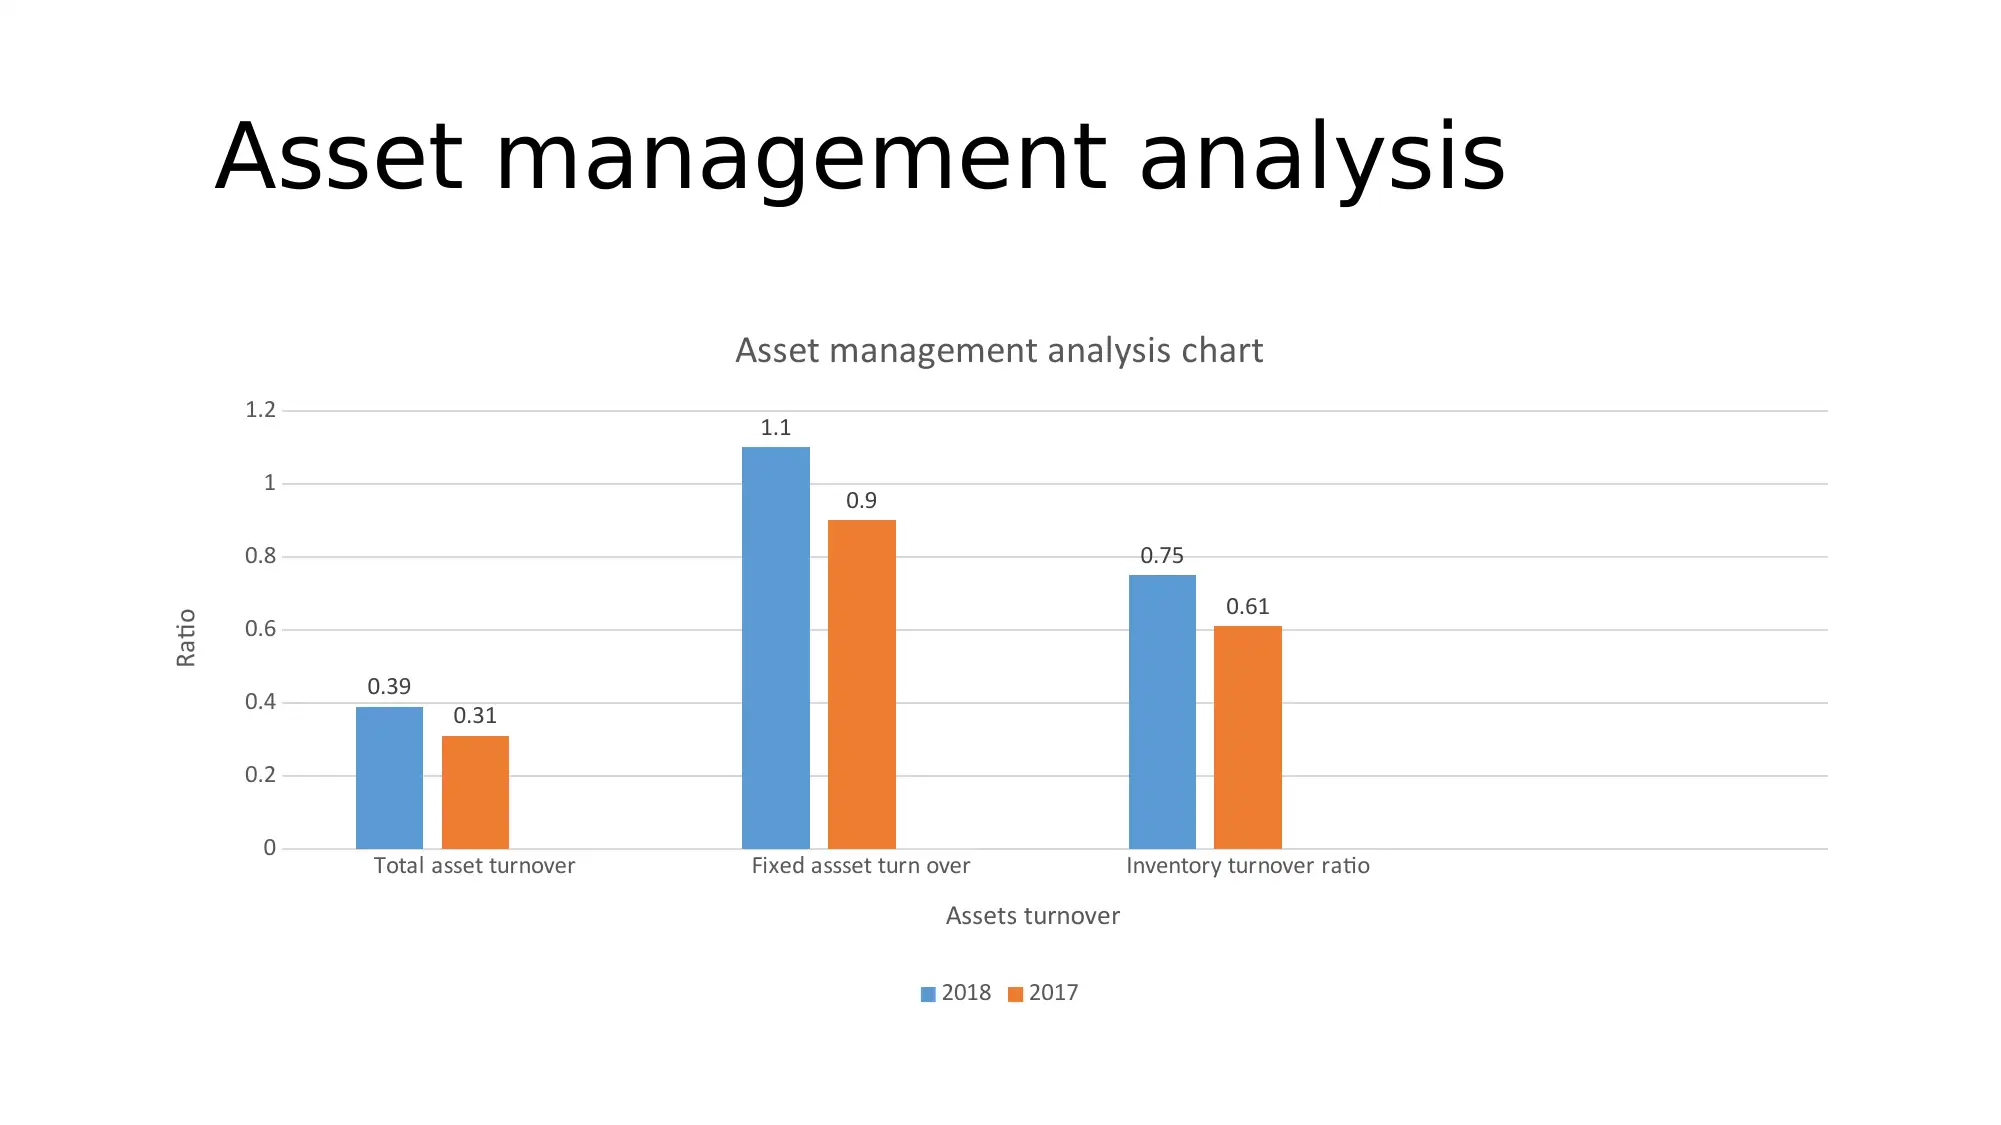
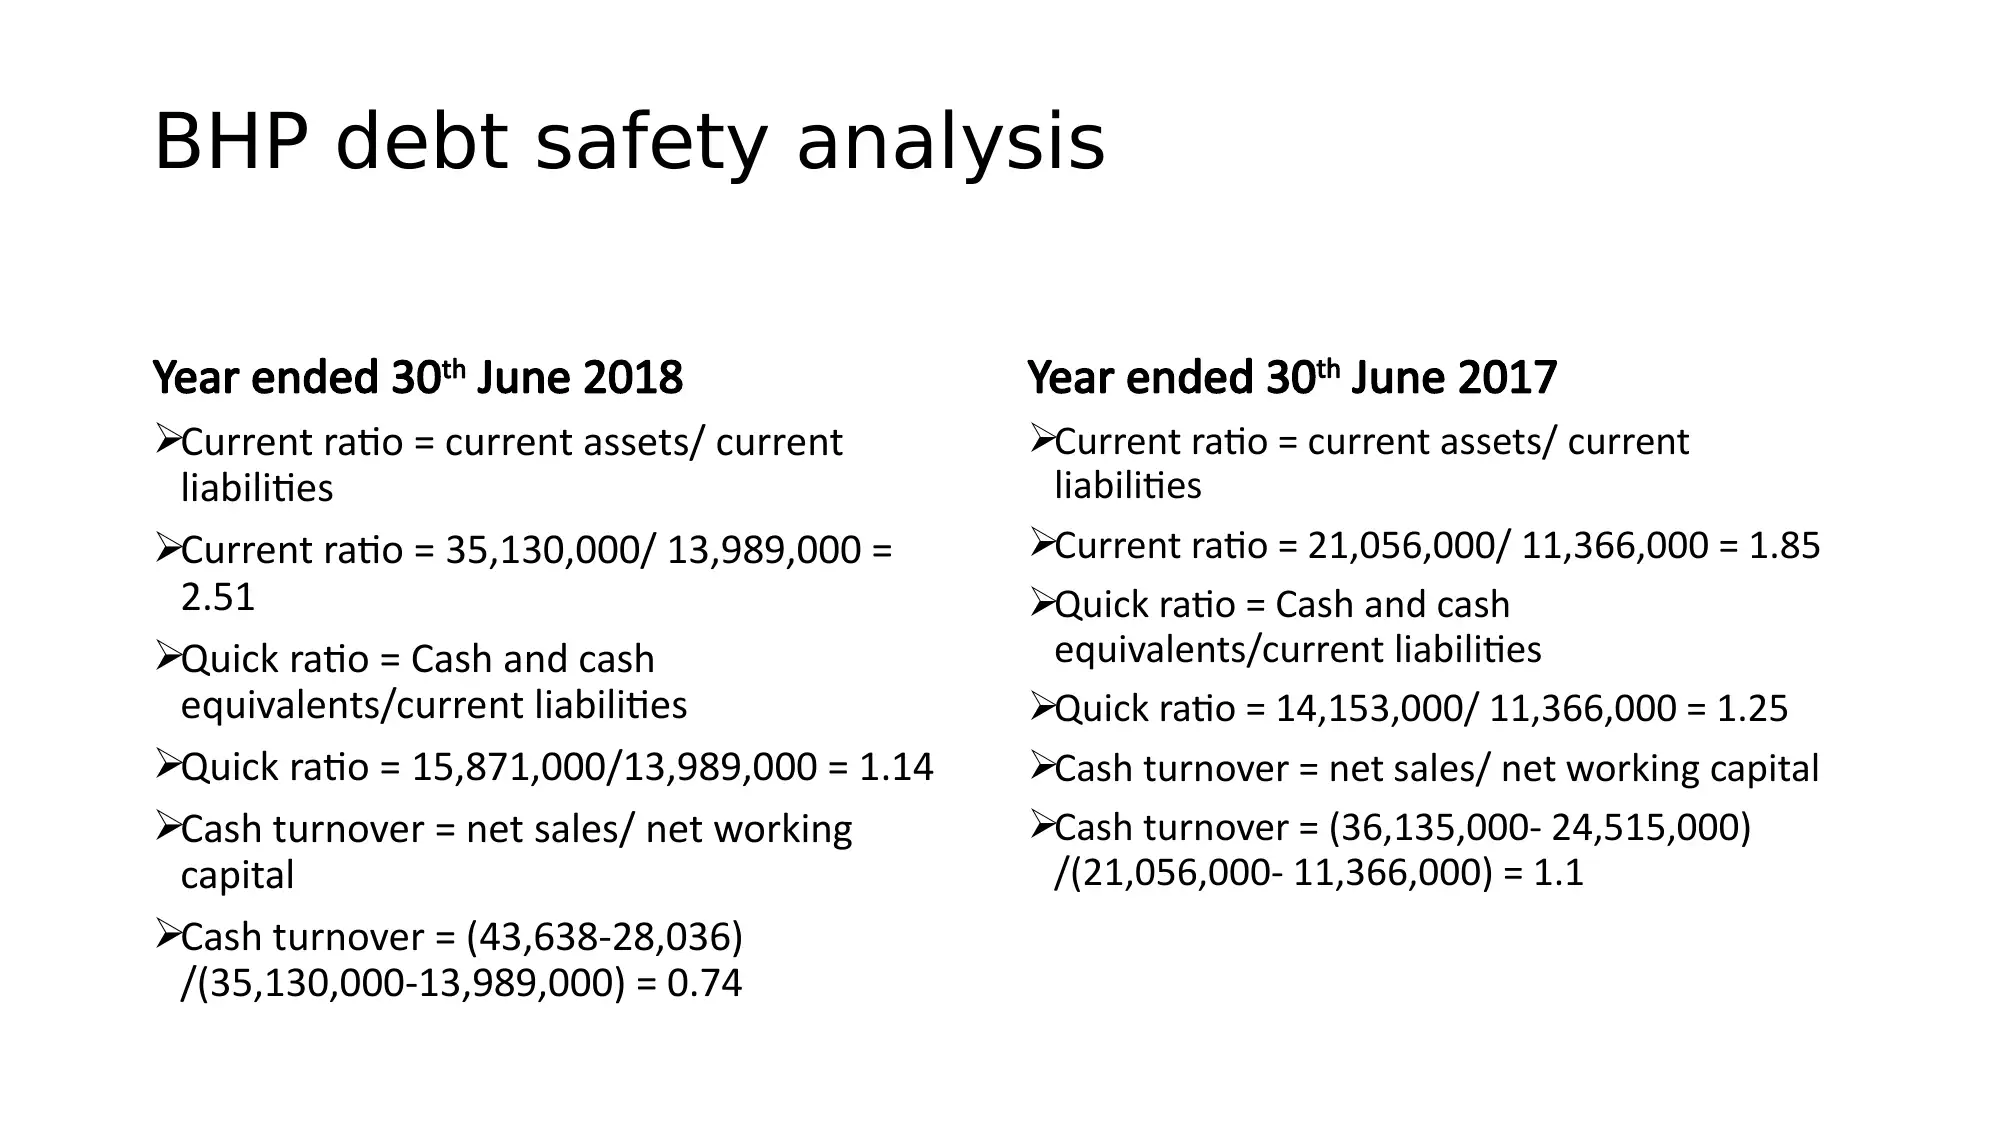
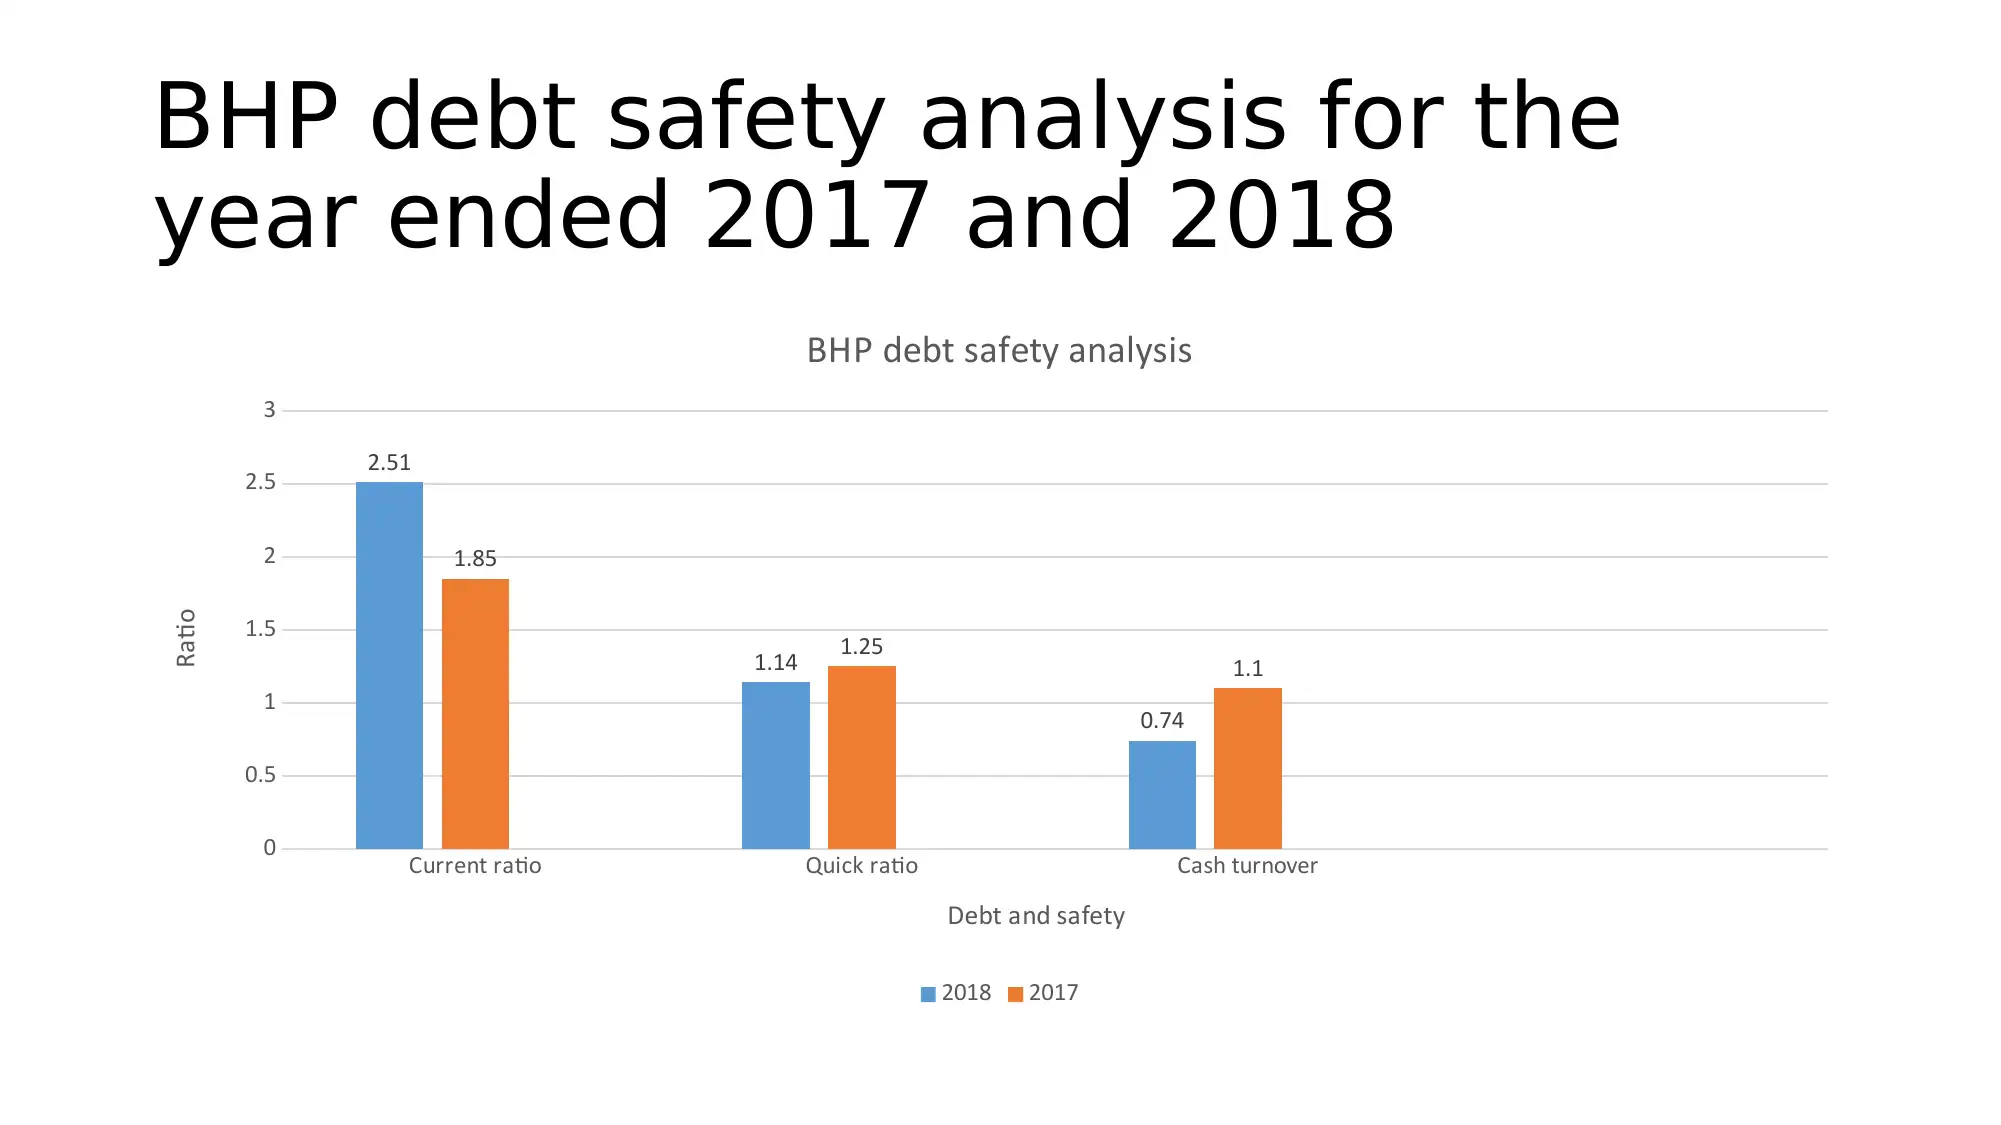
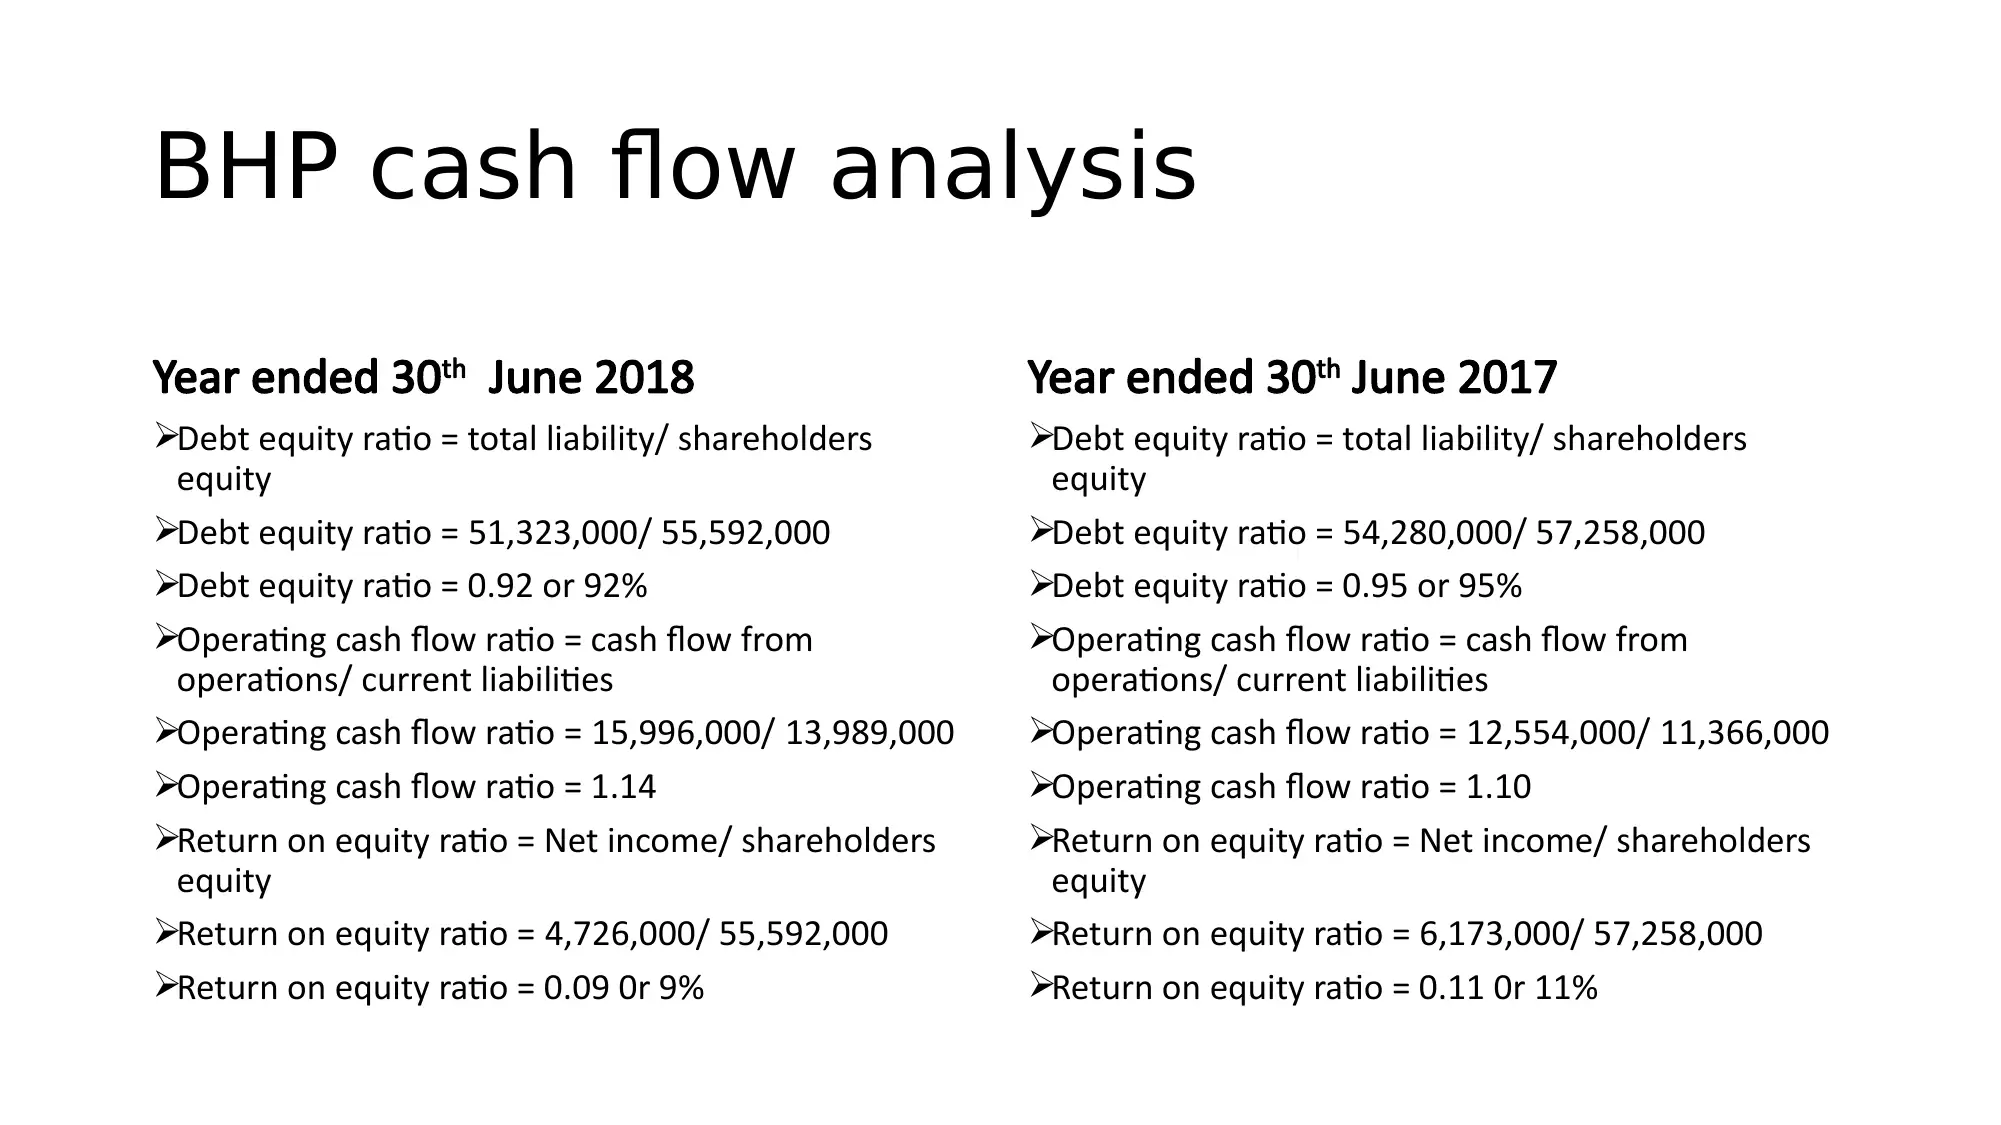
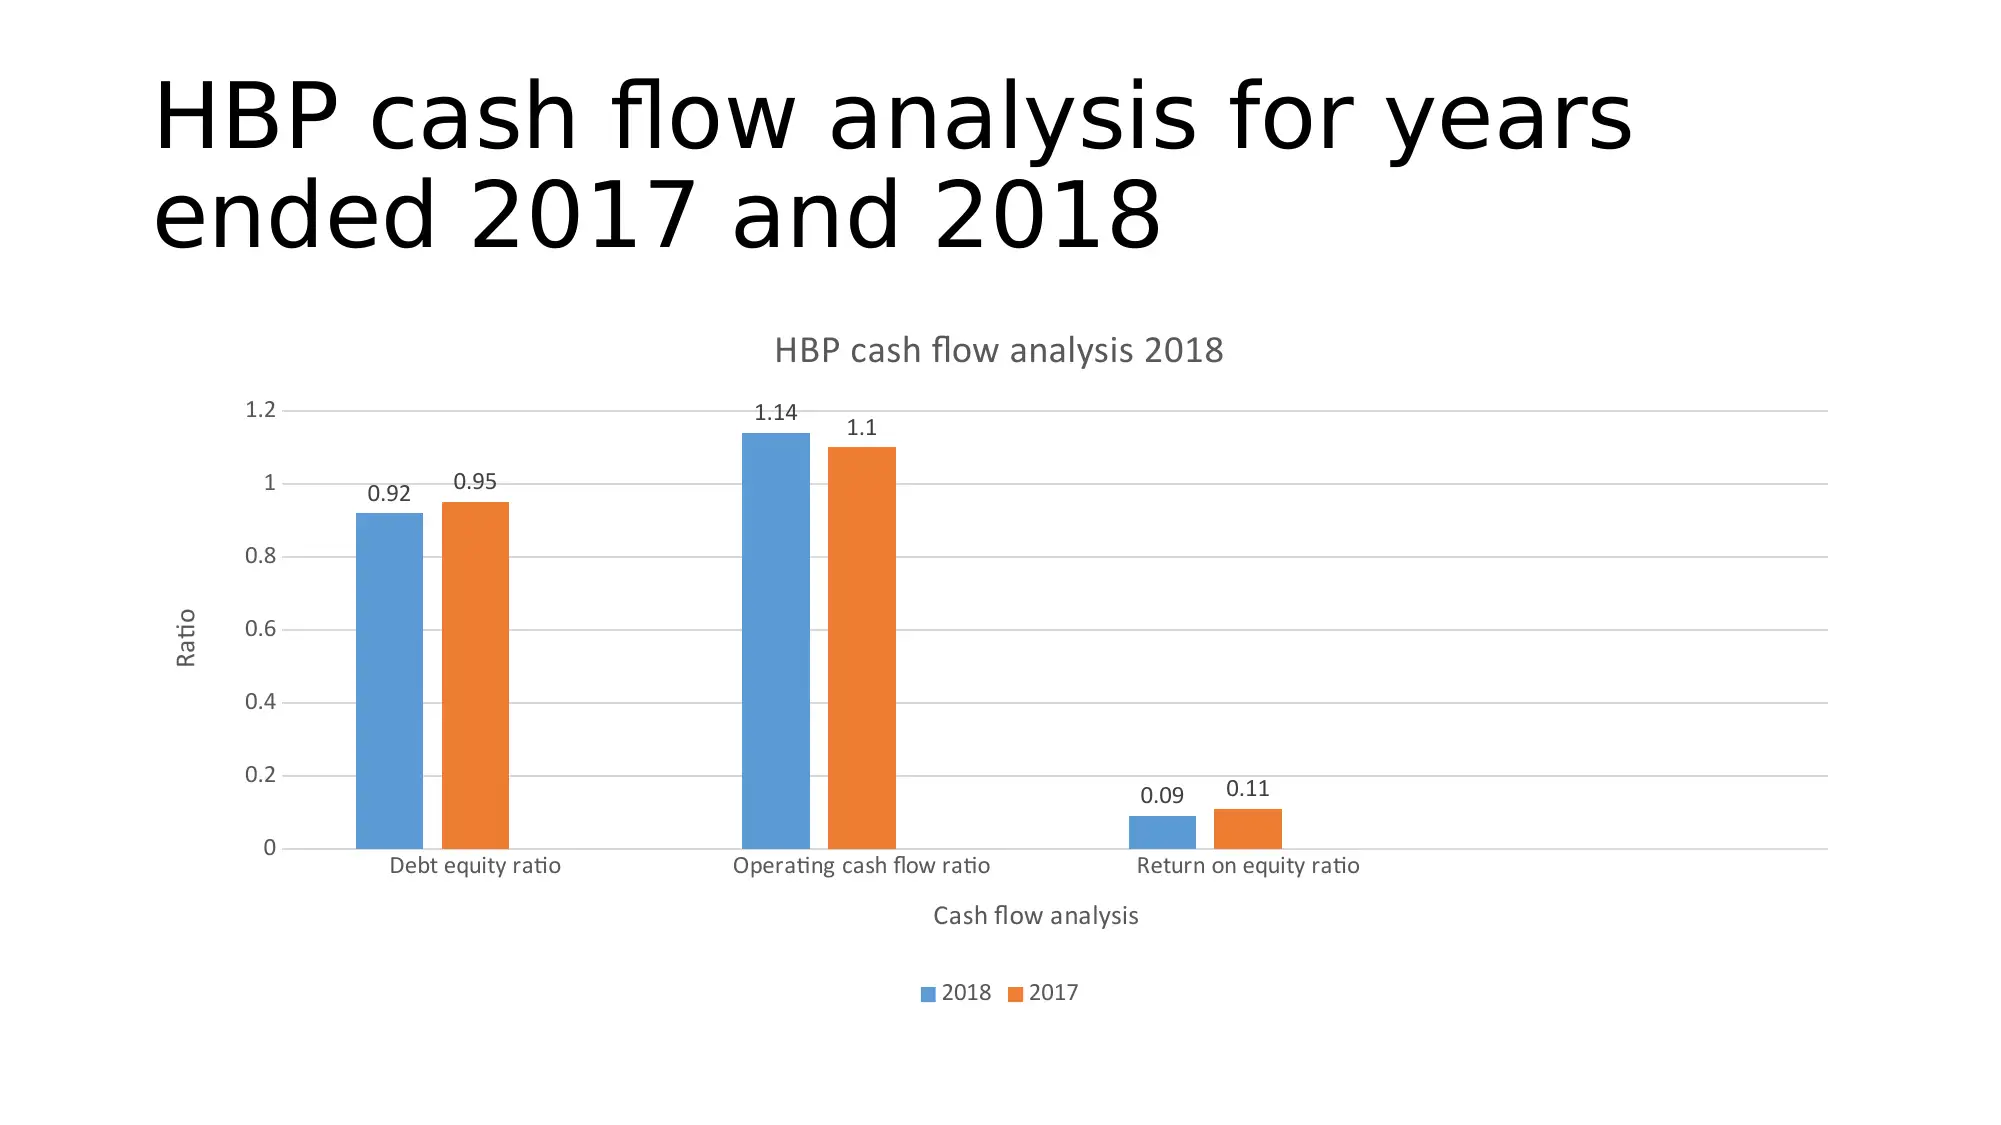
This report provides a comprehensive financial analysis of BHP Billiton, examining its performance in 2017 and 2018. The analysis includes a detailed assessment of profitability, utilizing metrics such as gross profit margin, operating profit margin, and net profit margin, comparing the results for both years. It further investigates asset management efficiency through total asset turnover, fixed asset turnover, and inventory turnover ratios. The debt and safety analysis covers current ratio, quick ratio, and cash turnover, providing insights into the company's liquidity and solvency. Finally, the report assesses cash flow through debt-equity ratio, operating cash flow ratio, and return on equity, offering a holistic view of BHP Billiton's financial health. The conclusion highlights key findings, identifies areas of strength, and points out inefficiencies, such as the cash turnover ratio. References from reputable financial sources support the analysis.
Document Page
UNIT:
NAME:
TITLE: BHP Billton Financial Analysis
tabler-icon-diamond-filled.svg

Paraphrase This Document

Need a fresh take? Get an instant paraphrase of this document with our AI Paraphraser
Document Page
Introduction
This presentation analyzes the financial position of BHP Billton in
terms of profitability, asset management, debt and safety, as well as
cash flow. The analysis is beneficial to external stakeholders on
determining the company’s financial performance. This includes the
management ability to use company’s resources to achieve high
returns on investment.
Document Page
BHP Profitability Analysis
BHP Profitability analysis for year ended
30 June 2018
Gross profit margin = Revenue- Cost of goods sold/
Revenue
Gross profit margin = (43,638,000-28,036,000)/
43,638,000 =0.36 or 36%
Operating profit margin =Operating Earnings/
Revenue
Operating profit margin = 15,996,000/43,638,000
Operating profit margin = 0.37 or 37%
Net profit margin = Net profit/ Total revenue
Net profit margin = (4,823,000/43,638,000) = 0.11
or 11%
BHP Profitability analysis for year ended
30 June 2018
Gross profit margin = Revenue- Cost of goods sold/
Revenue
Gross profit margin =
(36,135,000-24,515,000)/36,135,000 = 0.32 or 32%
Operating profit margin =Operating Earnings/
Revenue
Operating profit margin = (12,554,000/36,135,000)
Operating profit margin = 0.35 0r 35%
Net profit margin = Net profit/ Total revenue
Net profit margin = (6,222,000/ 36,135,000) 100
=0.172 or 17.2%
Document Page
BHP Profitability Analysis
Gross profit margin Operating profit margin Net profit margin
0%
5%
10%
15%
20%
25%
30%
35%
40%
36% 37%
11%
32%
35%
17%
BHP Profitability Analysis
2018 2017 Column1
Ratio
Percentage performance
tabler-icon-diamond-filled.svg

Paraphrase This Document

Need a fresh take? Get an instant paraphrase of this document with our AI Paraphraser
Document Page
Asset management analysis
Year ended 30th June 2018
Lets analyze BHP asset management
Total assets turnover = sales/total assets
Total assets turnover= 43,638,000/111,993,000
Total assets turnover ratio = 0.39
Fixed assets turnover = net sales /net fixed assets
Fixed assets turnover = 43,638,000/ 39526,000
Fixed assets turnover = 1.1
Inventory turnover ratio = Cost of goods sold/
Average inventory
Inventory turnover ratio = 28,036,000/((3,764,000+
3,673,000)/2)
Inventory turnover ratio = 0.75
Year ended 30th June 2017
Total assets turnover = sales/total assets
Total assets turnover= 36,135,000/117,006,000
Total assets turnover ratio = 0.31
Fixed assets turnover = net sales /net fixed assets
Fixed assets turnover = 36,135,000/ 39,529,000
Fixed assets turnover = 0.9
Inventory turnover ratio = Cost of goods sold/
Average inventory
Inventory turnover ratio =
(24,515,000/((3,673,000 +4,292 )/2)
Inventory turnover ratio = 0.61
Document Page
Asset management analysis
Total asset turnover Fixed assset turn over Inventory turnover ratio
0
0.2
0.4
0.6
0.8
1
1.2
0.39
1.1
0.75
0.31
0.9
0.61
Asset management analysis chart
2018 2017
Assets turnover
Ratio
Document Page
BHP debt safety analysis
Year ended 30th June 2018
Current ratio = current assets/ current
liabilities
Current ratio = 35,130,000/ 13,989,000 =
2.51
Quick ratio = Cash and cash
equivalents/current liabilities
Quick ratio = 15,871,000/13,989,000 = 1.14
Cash turnover = net sales/ net working
capital
Cash turnover = (43,638-28,036)
/(35,130,000-13,989,000) = 0.74
Year ended 30th June 2017
Current ratio = current assets/ current
liabilities
Current ratio = 21,056,000/ 11,366,000 = 1.85
Quick ratio = Cash and cash
equivalents/current liabilities
Quick ratio = 14,153,000/ 11,366,000 = 1.25
Cash turnover = net sales/ net working capital
Cash turnover = (36,135,000- 24,515,000)
/(21,056,000- 11,366,000) = 1.1
tabler-icon-diamond-filled.svg

Paraphrase This Document

Need a fresh take? Get an instant paraphrase of this document with our AI Paraphraser
Document Page
BHP debt safety analysis for the
year ended 2017 and 2018
Current ratio Quick ratio Cash turnover
0
0.5
1
1.5
2
2.5
3
2.51
1.14
0.74
1.85
1.25 1.1
BHP debt safety analysis
2018 2017
Debt and safety
Ratio
Document Page
BHP cash flow analysis
Year ended 30th June 2018
Debt equity ratio = total liability/ shareholders
equity
Debt equity ratio = 51,323,000/ 55,592,000
Debt equity ratio = 0.92 or 92%
Operating cash flow ratio = cash flow from
operations/ current liabilities
Operating cash flow ratio = 15,996,000/ 13,989,000
Operating cash flow ratio = 1.14
Return on equity ratio = Net income/ shareholders
equity
Return on equity ratio = 4,726,000/ 55,592,000
Return on equity ratio = 0.09 0r 9%
Year ended 30th June 2017
Debt equity ratio = total liability/ shareholders
equity
Debt equity ratio = 54,280,000/ 57,258,000
Debt equity ratio = 0.95 or 95%
Operating cash flow ratio = cash flow from
operations/ current liabilities
Operating cash flow ratio = 12,554,000/ 11,366,000
Operating cash flow ratio = 1.10
Return on equity ratio = Net income/ shareholders
equity
Return on equity ratio = 6,173,000/ 57,258,000
Return on equity ratio = 0.11 0r 11%
Document Page
HBP cash flow analysis for years
ended 2017 and 2018
Debt equity ratio Operating cash flow ratio Return on equity ratio
0
0.2
0.4
0.6
0.8
1
1.2
0.92
1.14
0.09
0.95
1.1
0.11
HBP cash flow analysis 2018
2018 2017
Cash flow analysis
Ratio
tabler-icon-diamond-filled.svg

Paraphrase This Document

Need a fresh take? Get an instant paraphrase of this document with our AI Paraphraser
Document Page
Conclusion
The financial analysis conducted on BHP Billton shows that the
company is in geed financial health as there is no ratio that has gone
beyond the alarming point. However, the analysis has spotted some
inefficiencies such as cash turnover ratio which means that the
company is inefficiently utilizing its working capital. Also the net profit
margin has drastically reduced as compared to last year
Document Page
Reference
Andrew, M. (2018).
2018 Annual Reporting Suite. [online] BHP. Available at:
https://www.bhp.com/media-and-insights/reports-and-presentations/2018/09/2018-annual-
reporting-suite [Accessed 25 Sep. 2018].
Bragg, S. and Bragg, S. (2018).
Financial leverage. [online] AccountingTools. Available at:
https://www.accountingtools.com/articles/2017/5/14/financial-leverage [Accessed 25 Sep. 2018].
Corporate Finance Institute (2018).
Analysis of Financial Statements - Free Financial Analysis Guide.
[online] Corporate Finance Institute. Available at:
https://corporatefinanceinstitute.com/resources/knowledge/finance/analysis-of-financial-statements/
[Accessed 25 Sep. 2018].
Corporate Finance Institute (2018).
Operating Cash Flow Ratio - Formula, Guide for Financial Analysts.
[online] Corporate Finance Institute. Available at:
https://corporatefinanceinstitute.com/resources/knowledge/finance/operating-cash-flow-ratio/
[Accessed 25 Sep. 2018].
Staff, I. (2018).
Debt/Equity Ratio. [online] Investopedia. Available at:
https://www.investopedia.com/terms/d/debtequityratio.asp [Accessed 25 Sep. 2018].
chevron_up_icon
1 out of 12
circle_padding
hide_on_mobile
zoom_out_icon