HC2091 Finance: BHP Billiton Financial Performance Analysis Report
VerifiedAdded on 2023/06/07
|17
|3821
|418
Report
AI Summary
This report provides a comprehensive financial analysis of BHP Billiton, a major mining and resources company. It examines the company's financial position, utilizing ratio analysis to assess liquidity, financial leverage, efficiency, profitability, and market value. The analysis includes calculations and interpretations of various financial ratios, such as current ratio, quick ratio, debt ratio, and earnings per share. Share price movements are visualized through graphs, and a constant dividend growth model is employed to determine stock valuation. The report concludes with recommendations aimed at improving the company's financial performance and growth prospects. This report is based on the assignment brief for the HC2091 Finance for Business course, evaluating the financial performance of a listed company on the ASX to offer financial and investment advice to a wealthy investor.

HC2091: Finance for Business
1
1
Paraphrase This Document
Need a fresh take? Get an instant paraphrase of this document with our AI Paraphraser
Introduction
In this report the will be consideration of the macro environment and for that the there will be
evaluation which will be made in the context of the financial position. There will be various
aspects which will be considered in this and for the proper analyzation, there will be a ratio
analysis which will be performed. By the help of this, it will be possible to make the decisions in
relation to the various aspects such as the investment will be made accordingly. In order to
understand the movements which took place in the share price will be understood appropriately
with the help of graphs. There will be the use of the constant dividend growth model in order to
ascertain the stock price of the company in the current period. All of this will be performed for
BHP Billiton and after the evaluation, there will be certain recommendations which will be
provided by which it will be possible to make the improvements in the current system so that
growth can be attained.
2
Contents
Introduction.................................................................................................................................................2
Overview of the Company...........................................................................................................................4
Calculation and interpretation of ratio.........................................................................................................5
Liquidity ratios........................................................................................................................................5
Financial Leverage Ratio.........................................................................................................................6
Efficiency Ratios.....................................................................................................................................6
Profitability Ratios...................................................................................................................................8
Market Value Ratios................................................................................................................................8
Graphs representing the Share price movements.......................................................................................10
Valuation of shares....................................................................................................................................12
Conclusion.................................................................................................................................................14
Recommendations.....................................................................................................................................15
References.................................................................................................................................................16
3
⊘ This is a preview!⊘
Do you want full access?
Subscribe today to unlock all pages.
Trusted by 1+ million students worldwide
Overview of the Company
BHP Billiton is the company which is having its headquarters in Australia and is considered as
one of the largest company dealing in mining and resources. It is operating in various parts of the
world and there are around 100000 employees to whom employment is provided by it. The
company was incorporated in 1885 and dealing in various products. In this copper, iron ore,
uranium and coal are involved and there are various segments which are prepared in accordance
with that (Bell, 2017). The main task of the petroleum segment is the development, production,
and exploration of the gas and oil. The mining of silver, copper, zinc, and lead is made in the
copper segment. The mining in relation to the iron ore is made in the iron ore segment. The main
extraction of minerals is made by the company in the operations which have been situated in
Australia. There is the logistic chain with the help of which distribution of the products is
managed. The operations are mainly carried in America and Australia (BHP Billiton Limited,
2017). The company has attained the success in the long run and is running in a very smooth
manner. There are several competitors in the market with which it is required to deal in the most
effective manner so that the benefits can be obtained from that.
4
Paraphrase This Document
Need a fresh take? Get an instant paraphrase of this document with our AI Paraphraser
Calculation and interpretation of ratio
The ratio analysis is performed so that all of the aspects of the business can be considered and by
that the performance of the business can be evaluated (Duchin and Sosyura, 2014). In this,, there
will be various calculations and evaluations which will be made by which the overall
ascertainment of the position of the business will be made.
Liquidity ratios
In the business, there are certain aspects which are to be noted and one of them is liquidity in
which it will be ascertained that whether the company is effective in the meeting of its
obligations (Atieh, 2014). There are various financial elements which will be required to be
evaluated in this. The assets and liabilities which are involved in the business which will have to
be met are to be ascertained so that proper comparison among them is made and then the
decision on the basis of them is taken. The liquidity position will be determined and the final
decisions will be made by taking them into consideration (Kirkham, 2012). In this, there are
several ratios which are calculated so that proper results are obtained.
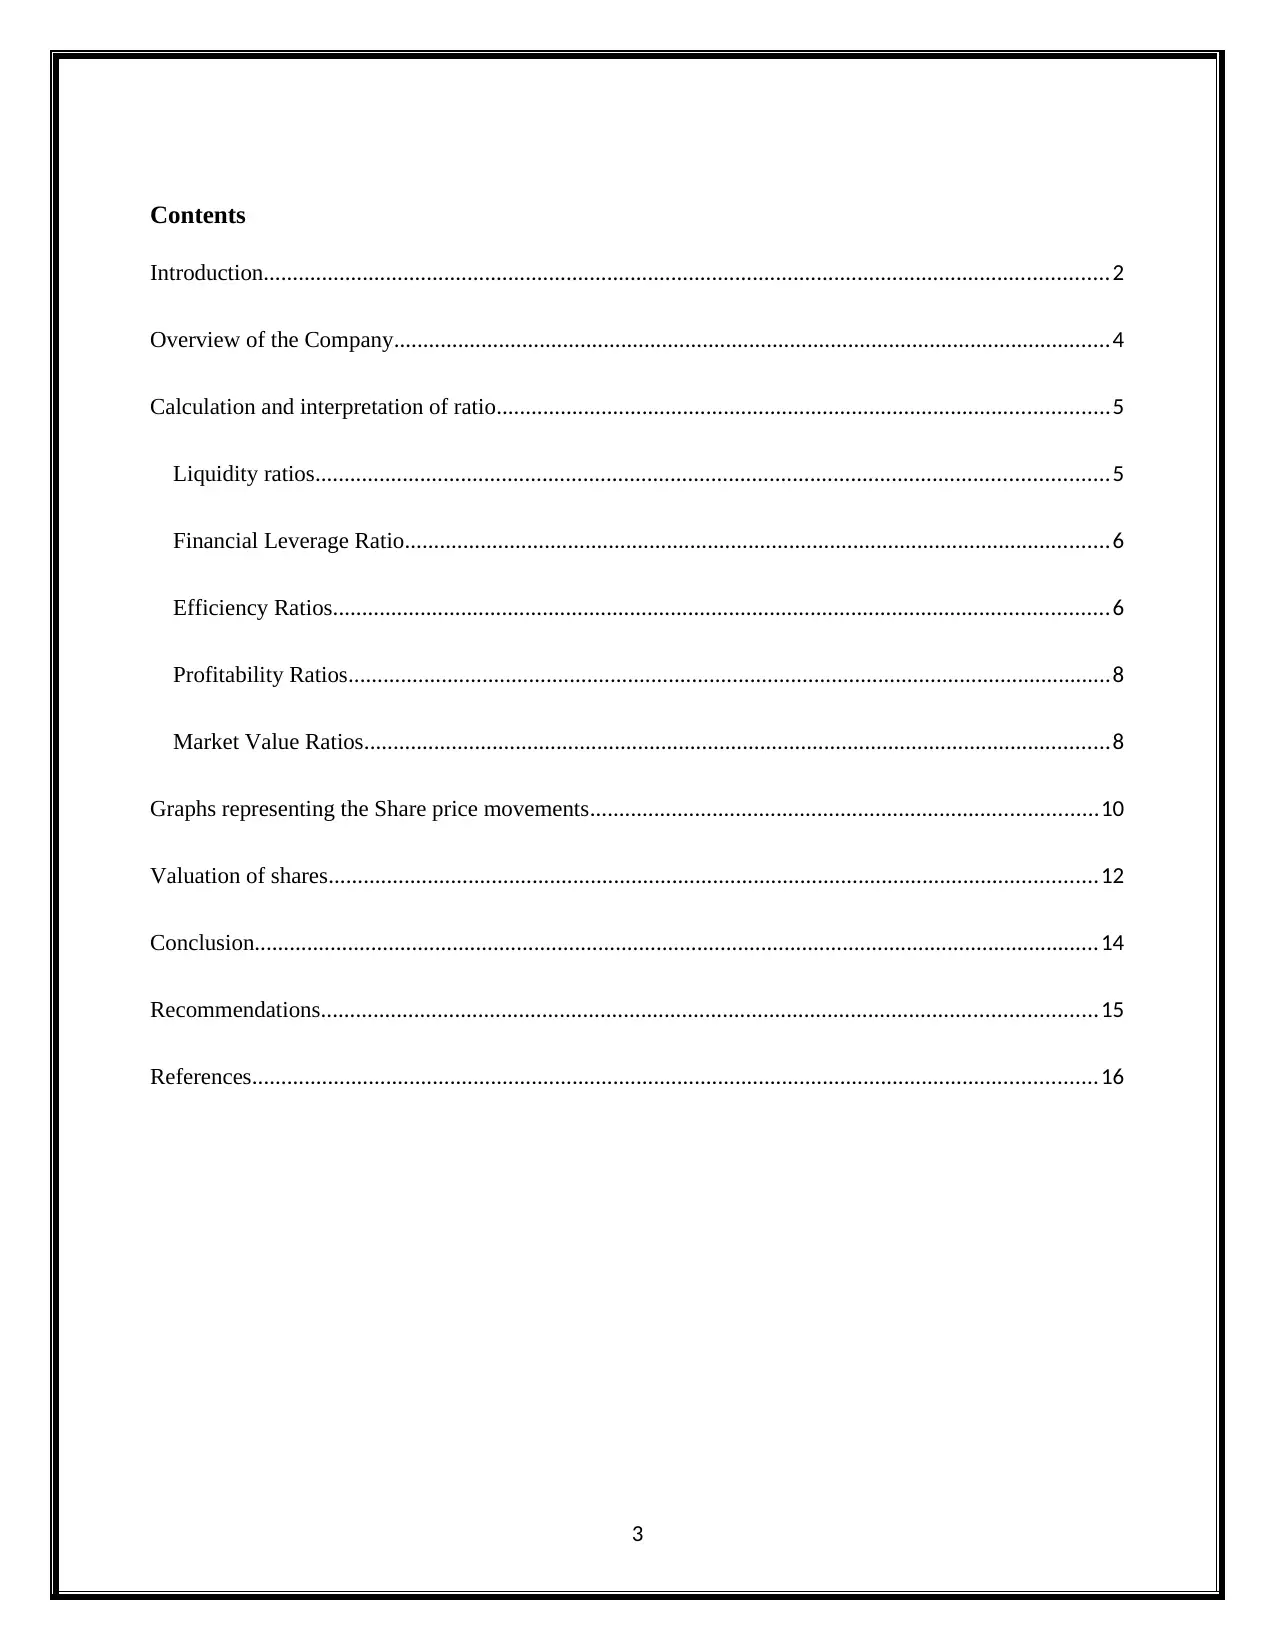
The current ratio is the one by which the total current assets that the company is possessing are
considered for the payment of current liabilities. They are compared and it is identified that
whether they will be sufficient or the challenges will be faced. There is the standard which is set
in this and that states that it shall be at 2:1 which means that the assets of the company shall be
twice of the liabilities to be taken. The same in the current case is 1.85 and 1.44 for the year 2017
and 2016 respectively (BHP Billiton Limited, 2017). It can be said that there is the increase in
the ratio and although the company will be able to meet the liabilities some more improvement is
5
The ratio analysis is performed so that all of the aspects of the business can be considered and by
that the performance of the business can be evaluated (Duchin and Sosyura, 2014). In this,, there
will be various calculations and evaluations which will be made by which the overall
ascertainment of the position of the business will be made.
Liquidity ratios
In the business, there are certain aspects which are to be noted and one of them is liquidity in
which it will be ascertained that whether the company is effective in the meeting of its
obligations (Atieh, 2014). There are various financial elements which will be required to be
evaluated in this. The assets and liabilities which are involved in the business which will have to
be met are to be ascertained so that proper comparison among them is made and then the
decision on the basis of them is taken. The liquidity position will be determined and the final
decisions will be made by taking them into consideration (Kirkham, 2012). In this, there are
several ratios which are calculated so that proper results are obtained.
The current ratio is the one by which the total current assets that the company is possessing are
considered for the payment of current liabilities. They are compared and it is identified that
whether they will be sufficient or the challenges will be faced. There is the standard which is set
in this and that states that it shall be at 2:1 which means that the assets of the company shall be
twice of the liabilities to be taken. The same in the current case is 1.85 and 1.44 for the year 2017
and 2016 respectively (BHP Billiton Limited, 2017). It can be said that there is the increase in
the ratio and although the company will be able to meet the liabilities some more improvement is
5
needed. The quick ratio is the one in which the assets which are highly liquid will be taken and
inventory will not be involved in this. The ratio will be comparing the quick assets with the
current liabilities. They are 1.16 in 2016 and rose to 1.53 in 2017. This shows that the company
will be able to manage its resources in the most appropriate manner (BHP Billiton Limited,
2017). So in whole,, the liquidity position of the company is strong and it will not be facing any
issues in payment of its liabilities.
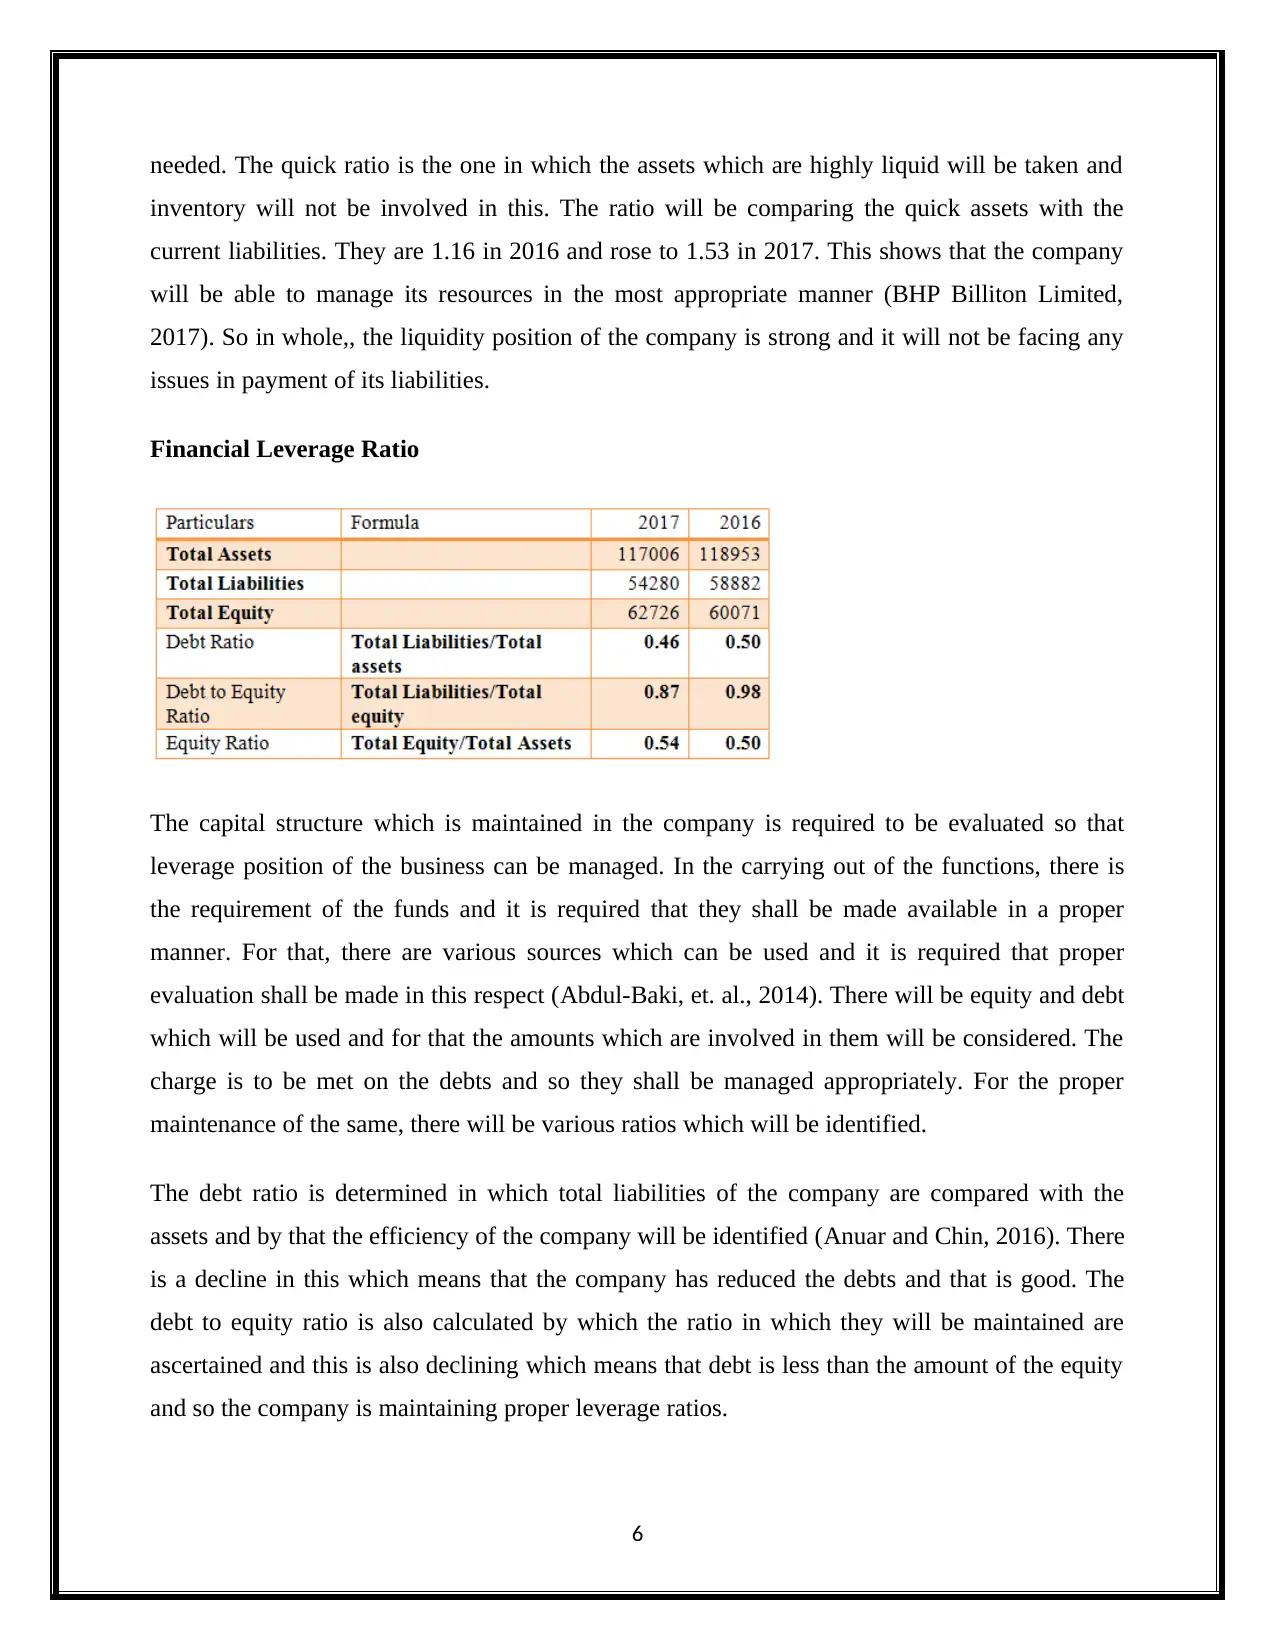
Financial Leverage Ratio
The capital structure which is maintained in the company is required to be evaluated so that
leverage position of the business can be managed. In the carrying out of the functions, there is
the requirement of the funds and it is required that they shall be made available in a proper
manner. For that, there are various sources which can be used and it is required that proper
evaluation shall be made in this respect (Abdul-Baki, et. al., 2014). There will be equity and debt
which will be used and for that the amounts which are involved in them will be considered. The
charge is to be met on the debts and so they shall be managed appropriately. For the proper
maintenance of the same, there will be various ratios which will be identified.
The debt ratio is determined in which total liabilities of the company are compared with the
assets and by that the efficiency of the company will be identified (Anuar and Chin, 2016). There
is a decline in this which means that the company has reduced the debts and that is good. The
debt to equity ratio is also calculated by which the ratio in which they will be maintained are
ascertained and this is also declining which means that debt is less than the amount of the equity
and so the company is maintaining proper leverage ratios.
6
inventory will not be involved in this. The ratio will be comparing the quick assets with the
current liabilities. They are 1.16 in 2016 and rose to 1.53 in 2017. This shows that the company
will be able to manage its resources in the most appropriate manner (BHP Billiton Limited,
2017). So in whole,, the liquidity position of the company is strong and it will not be facing any
issues in payment of its liabilities.
Financial Leverage Ratio
The capital structure which is maintained in the company is required to be evaluated so that
leverage position of the business can be managed. In the carrying out of the functions, there is
the requirement of the funds and it is required that they shall be made available in a proper
manner. For that, there are various sources which can be used and it is required that proper
evaluation shall be made in this respect (Abdul-Baki, et. al., 2014). There will be equity and debt
which will be used and for that the amounts which are involved in them will be considered. The
charge is to be met on the debts and so they shall be managed appropriately. For the proper
maintenance of the same, there will be various ratios which will be identified.
The debt ratio is determined in which total liabilities of the company are compared with the
assets and by that the efficiency of the company will be identified (Anuar and Chin, 2016). There
is a decline in this which means that the company has reduced the debts and that is good. The
debt to equity ratio is also calculated by which the ratio in which they will be maintained are
ascertained and this is also declining which means that debt is less than the amount of the equity
and so the company is maintaining proper leverage ratios.
6
⊘ This is a preview!⊘
Do you want full access?
Subscribe today to unlock all pages.
Trusted by 1+ million students worldwide
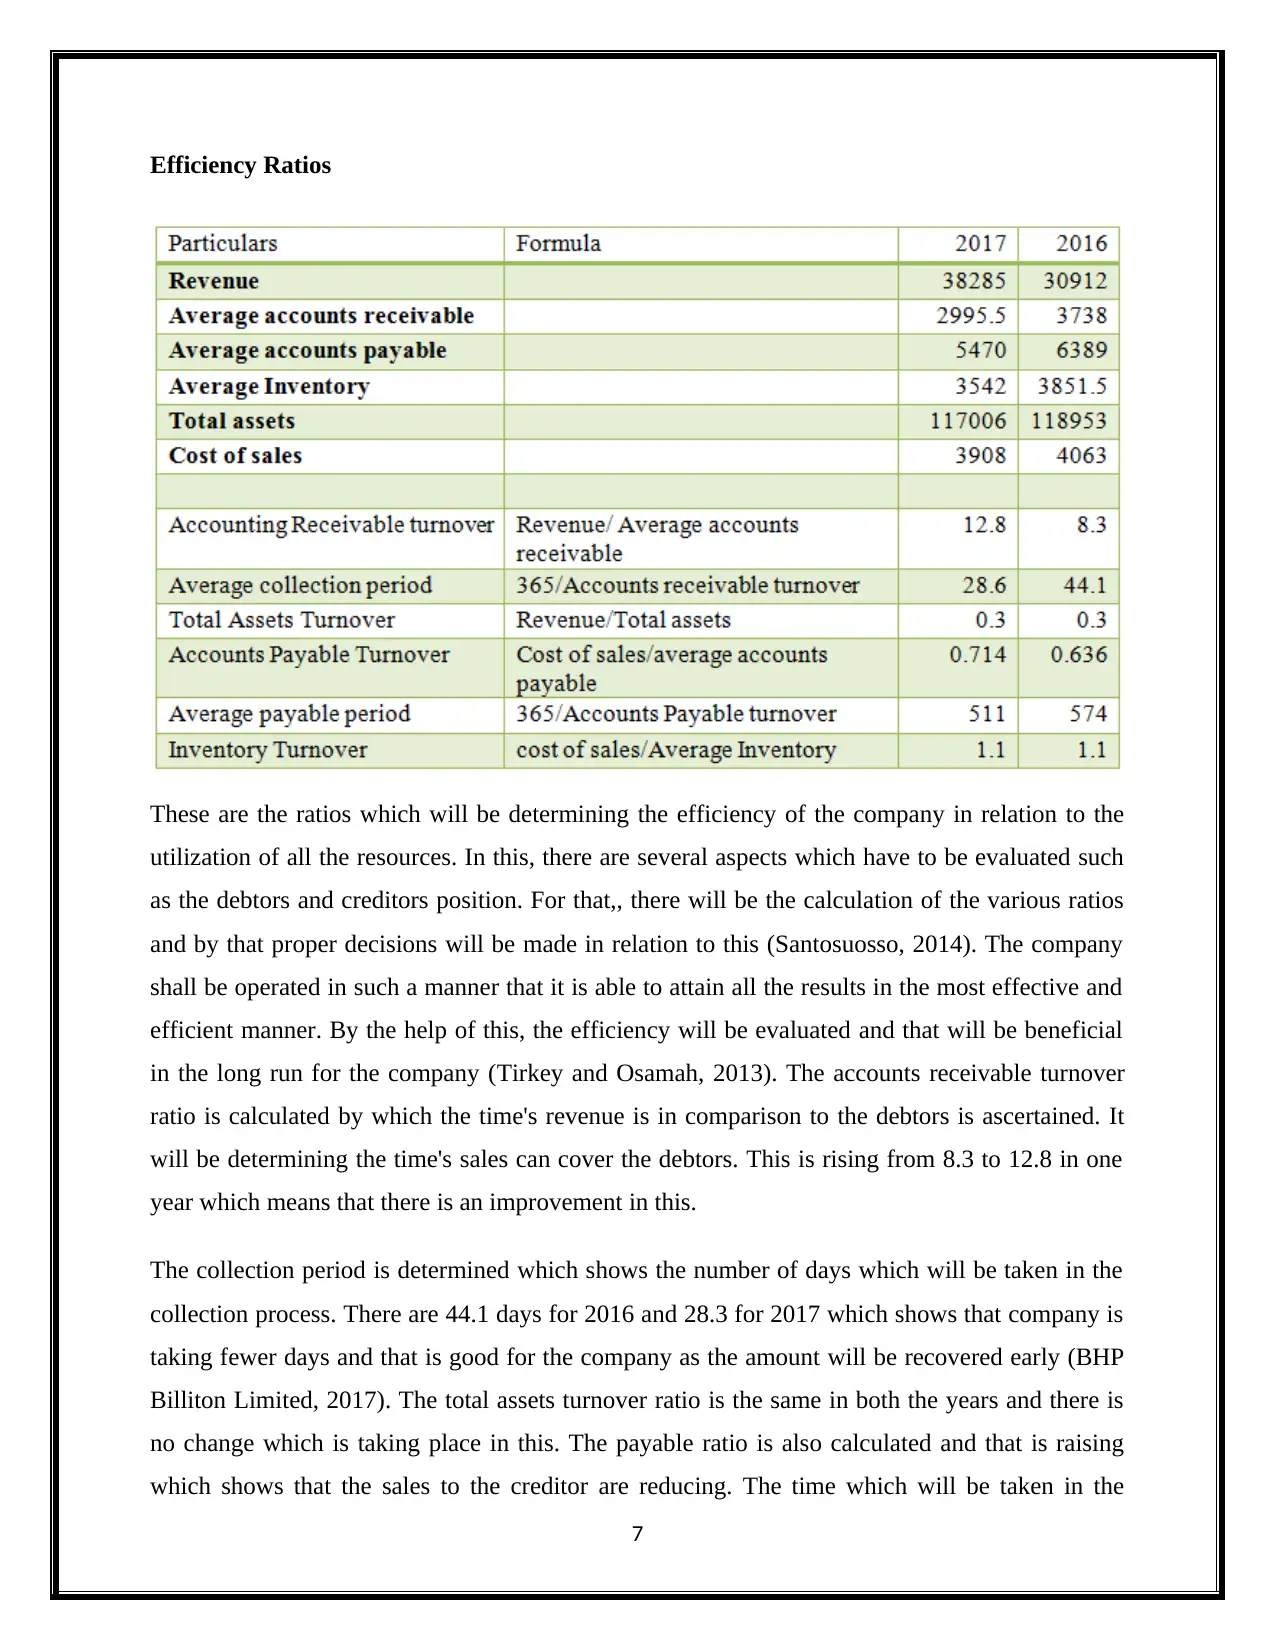
Efficiency Ratios
These are the ratios which will be determining the efficiency of the company in relation to the
utilization of all the resources. In this, there are several aspects which have to be evaluated such
as the debtors and creditors position. For that,, there will be the calculation of the various ratios
and by that proper decisions will be made in relation to this (Santosuosso, 2014). The company
shall be operated in such a manner that it is able to attain all the results in the most effective and
efficient manner. By the help of this, the efficiency will be evaluated and that will be beneficial
in the long run for the company (Tirkey and Osamah, 2013). The accounts receivable turnover
ratio is calculated by which the time's revenue is in comparison to the debtors is ascertained. It
will be determining the time's sales can cover the debtors. This is rising from 8.3 to 12.8 in one
year which means that there is an improvement in this.
The collection period is determined which shows the number of days which will be taken in the
collection process. There are 44.1 days for 2016 and 28.3 for 2017 which shows that company is
taking fewer days and that is good for the company as the amount will be recovered early (BHP
Billiton Limited, 2017). The total assets turnover ratio is the same in both the years and there is
no change which is taking place in this. The payable ratio is also calculated and that is raising
which shows that the sales to the creditor are reducing. The time which will be taken in the
7
Paraphrase This Document
Need a fresh take? Get an instant paraphrase of this document with our AI Paraphraser
payment process is declining and this will be representing that company will be able to make the
payments in less time by which the goodwill be made and also the cost which is incurred will be
saved. The inventory turnover is the the same and that shows that the company is constant with
its inventories.
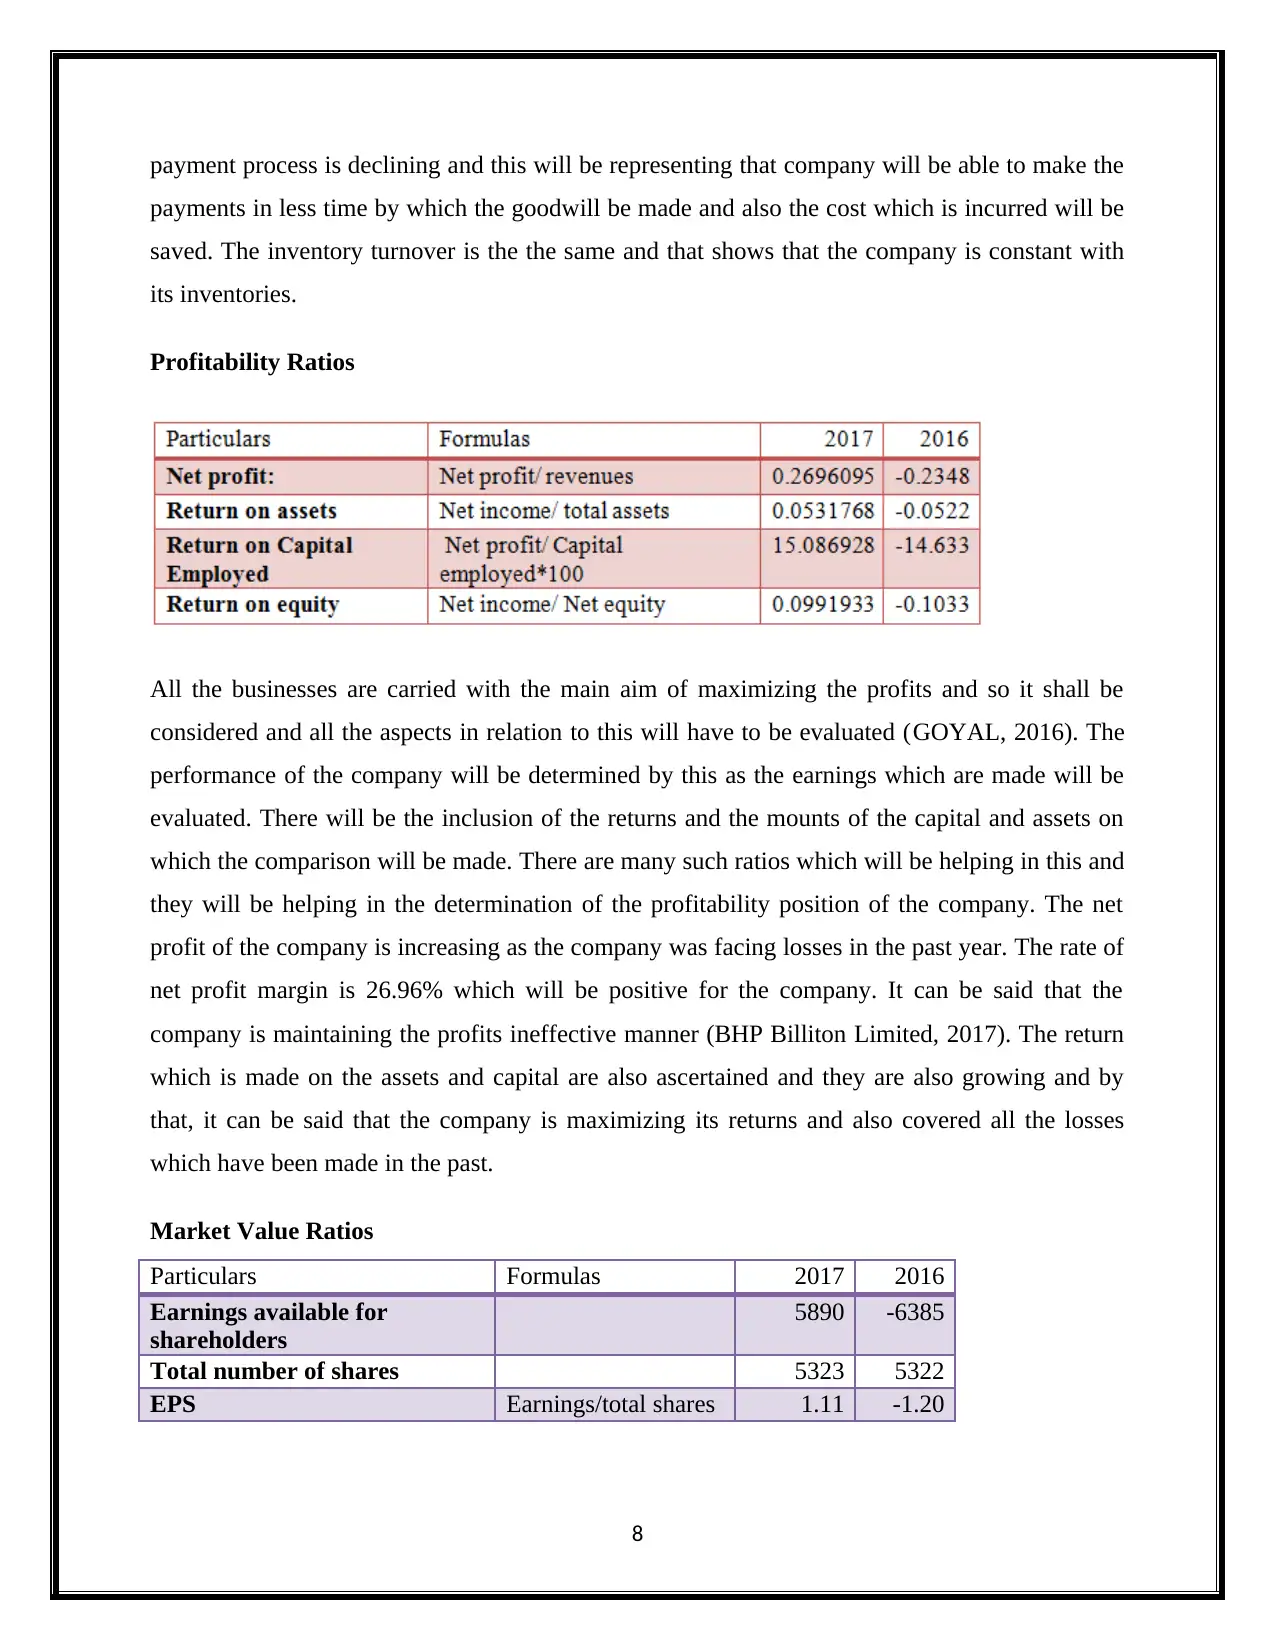
Profitability Ratios
All the businesses are carried with the main aim of maximizing the profits and so it shall be
considered and all the aspects in relation to this will have to be evaluated (GOYAL, 2016). The
performance of the company will be determined by this as the earnings which are made will be
evaluated. There will be the inclusion of the returns and the mounts of the capital and assets on
which the comparison will be made. There are many such ratios which will be helping in this and
they will be helping in the determination of the profitability position of the company. The net
profit of the company is increasing as the company was facing losses in the past year. The rate of
net profit margin is 26.96% which will be positive for the company. It can be said that the
company is maintaining the profits ineffective manner (BHP Billiton Limited, 2017). The return
which is made on the assets and capital are also ascertained and they are also growing and by
that, it can be said that the company is maximizing its returns and also covered all the losses
which have been made in the past.
Market Value Ratios
Particulars Formulas 2017 2016
Earnings available for
shareholders
5890 -6385
Total number of shares 5323 5322
EPS Earnings/total shares 1.11 -1.20
8
payments in less time by which the goodwill be made and also the cost which is incurred will be
saved. The inventory turnover is the the same and that shows that the company is constant with
its inventories.
Profitability Ratios
All the businesses are carried with the main aim of maximizing the profits and so it shall be
considered and all the aspects in relation to this will have to be evaluated (GOYAL, 2016). The
performance of the company will be determined by this as the earnings which are made will be
evaluated. There will be the inclusion of the returns and the mounts of the capital and assets on
which the comparison will be made. There are many such ratios which will be helping in this and
they will be helping in the determination of the profitability position of the company. The net
profit of the company is increasing as the company was facing losses in the past year. The rate of
net profit margin is 26.96% which will be positive for the company. It can be said that the
company is maintaining the profits ineffective manner (BHP Billiton Limited, 2017). The return
which is made on the assets and capital are also ascertained and they are also growing and by
that, it can be said that the company is maximizing its returns and also covered all the losses
which have been made in the past.
Market Value Ratios
Particulars Formulas 2017 2016
Earnings available for
shareholders
5890 -6385
Total number of shares 5323 5322
EPS Earnings/total shares 1.11 -1.20
8

The position of the company in the market shall be strong and for that,, it will be required that
the factors which will be representing this shall be evaluated (Khan and Khokhar, 2015). By this,
the factors of the market will be considered. The earnings which will be made on per share are
determined and for that, the earnings and a total number of shares are taken into account. The
EPS is rising and it will be creating the strong position in the market as the shareholders will be
willing to make the investment in the business to earn more.
9
⊘ This is a preview!⊘
Do you want full access?
Subscribe today to unlock all pages.
Trusted by 1+ million students worldwide
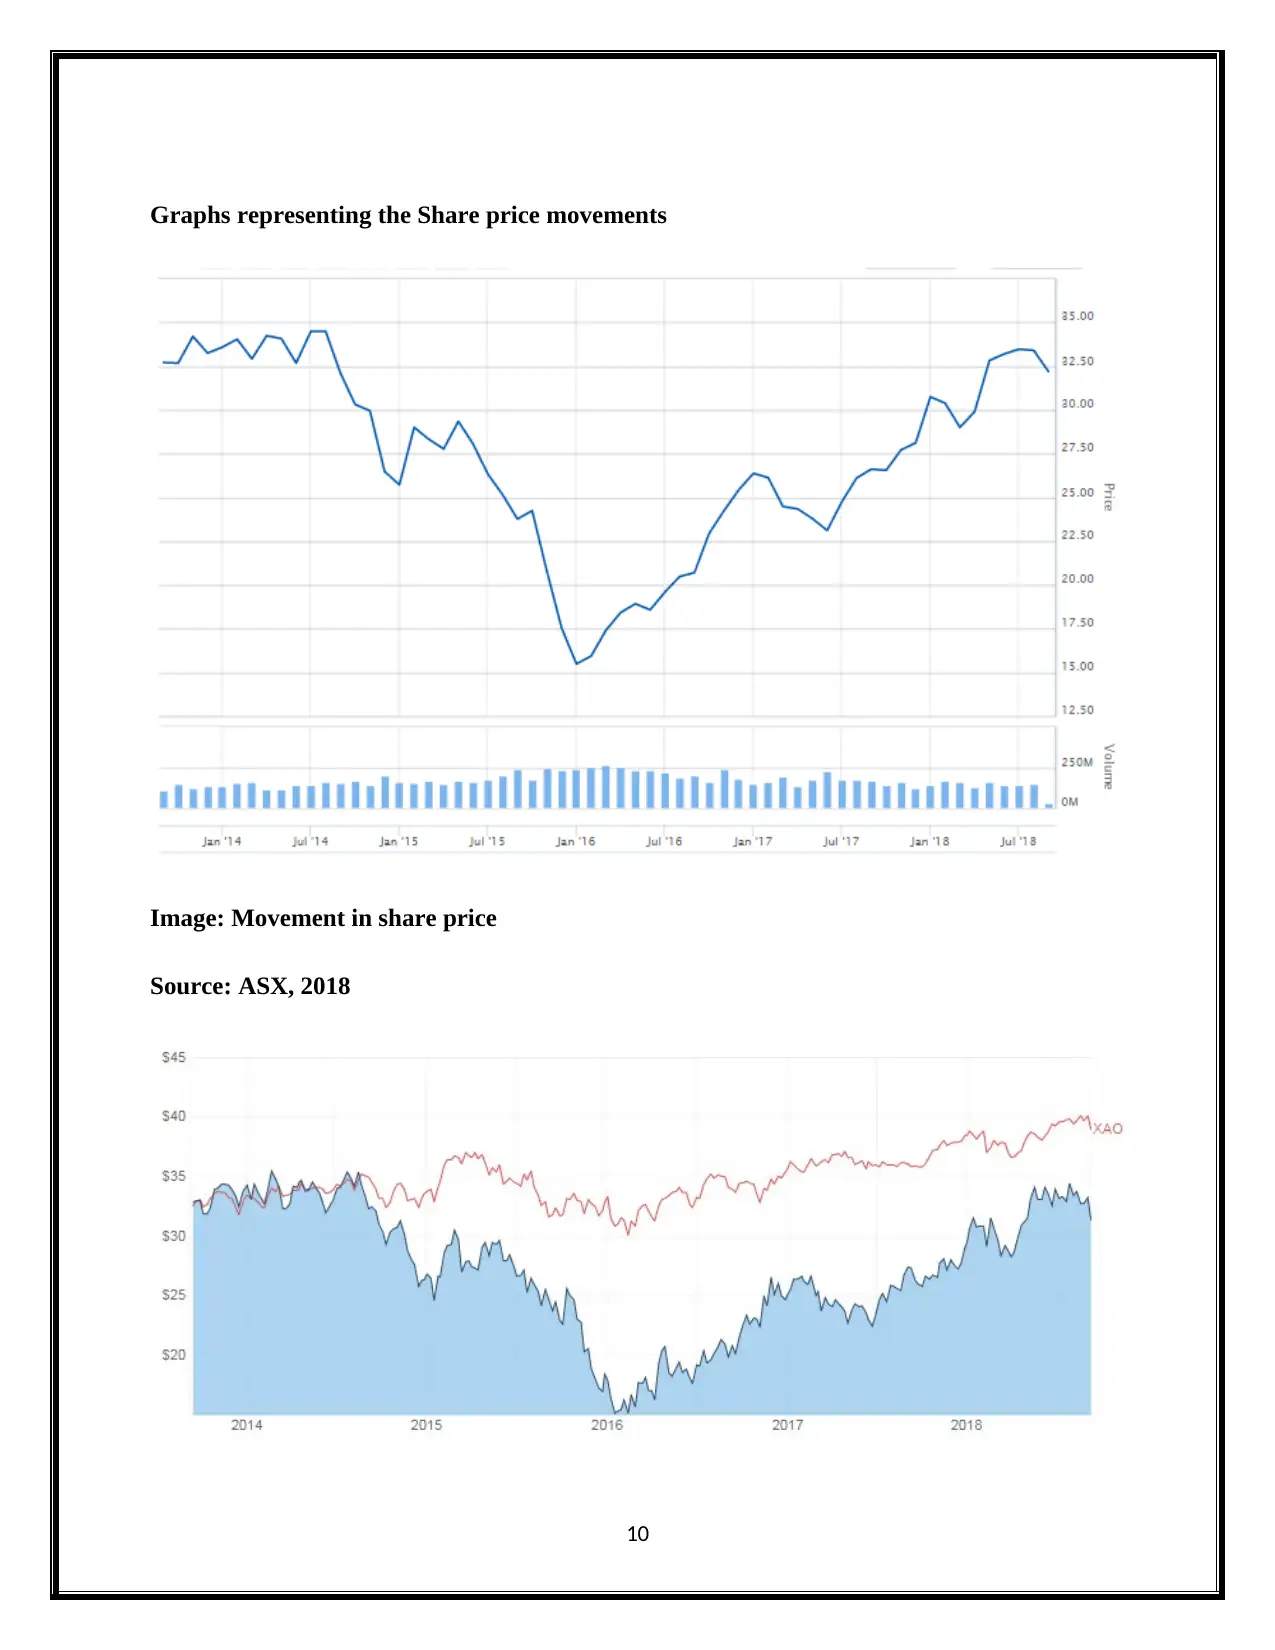
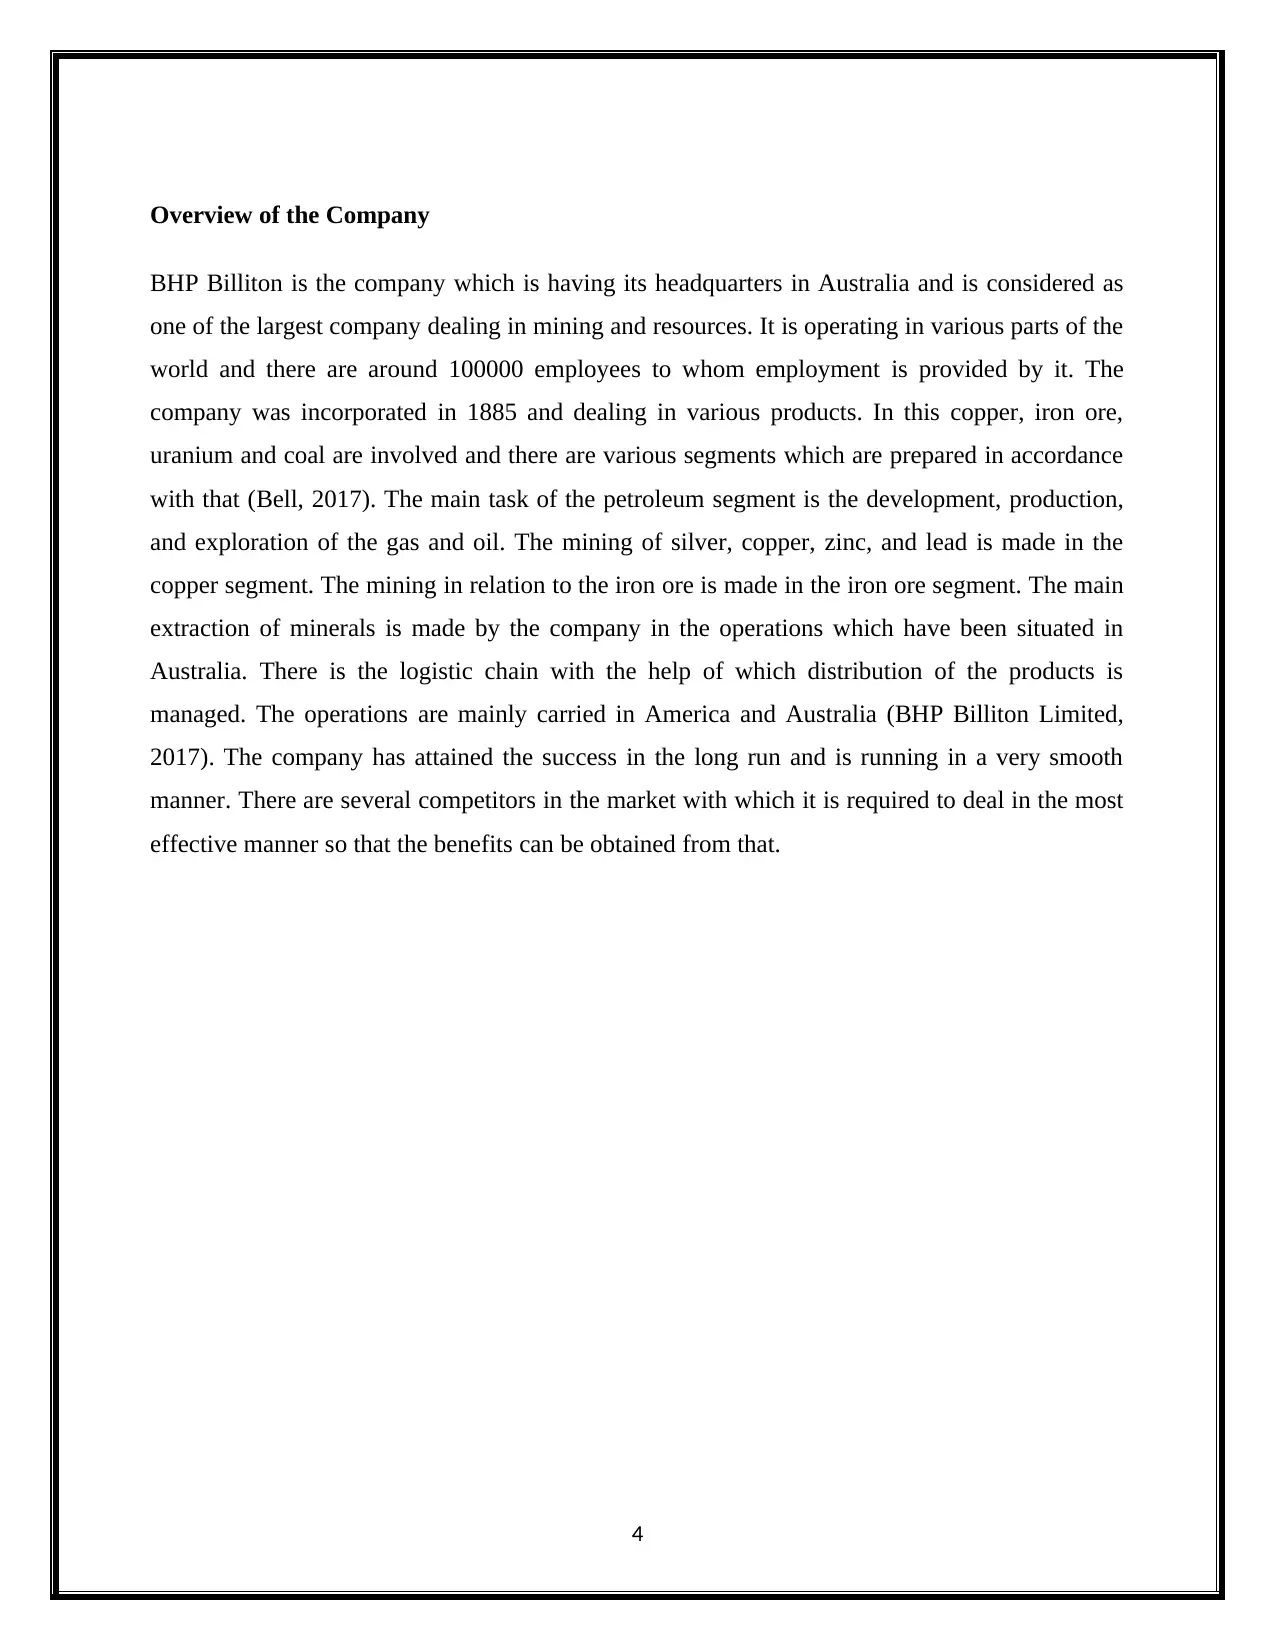
Graphs representing the Share price movements
Image: Movement in share price
Source: ASX, 2018
10
Image: Movement in share price
Source: ASX, 2018
10
Paraphrase This Document
Need a fresh take? Get an instant paraphrase of this document with our AI Paraphraser
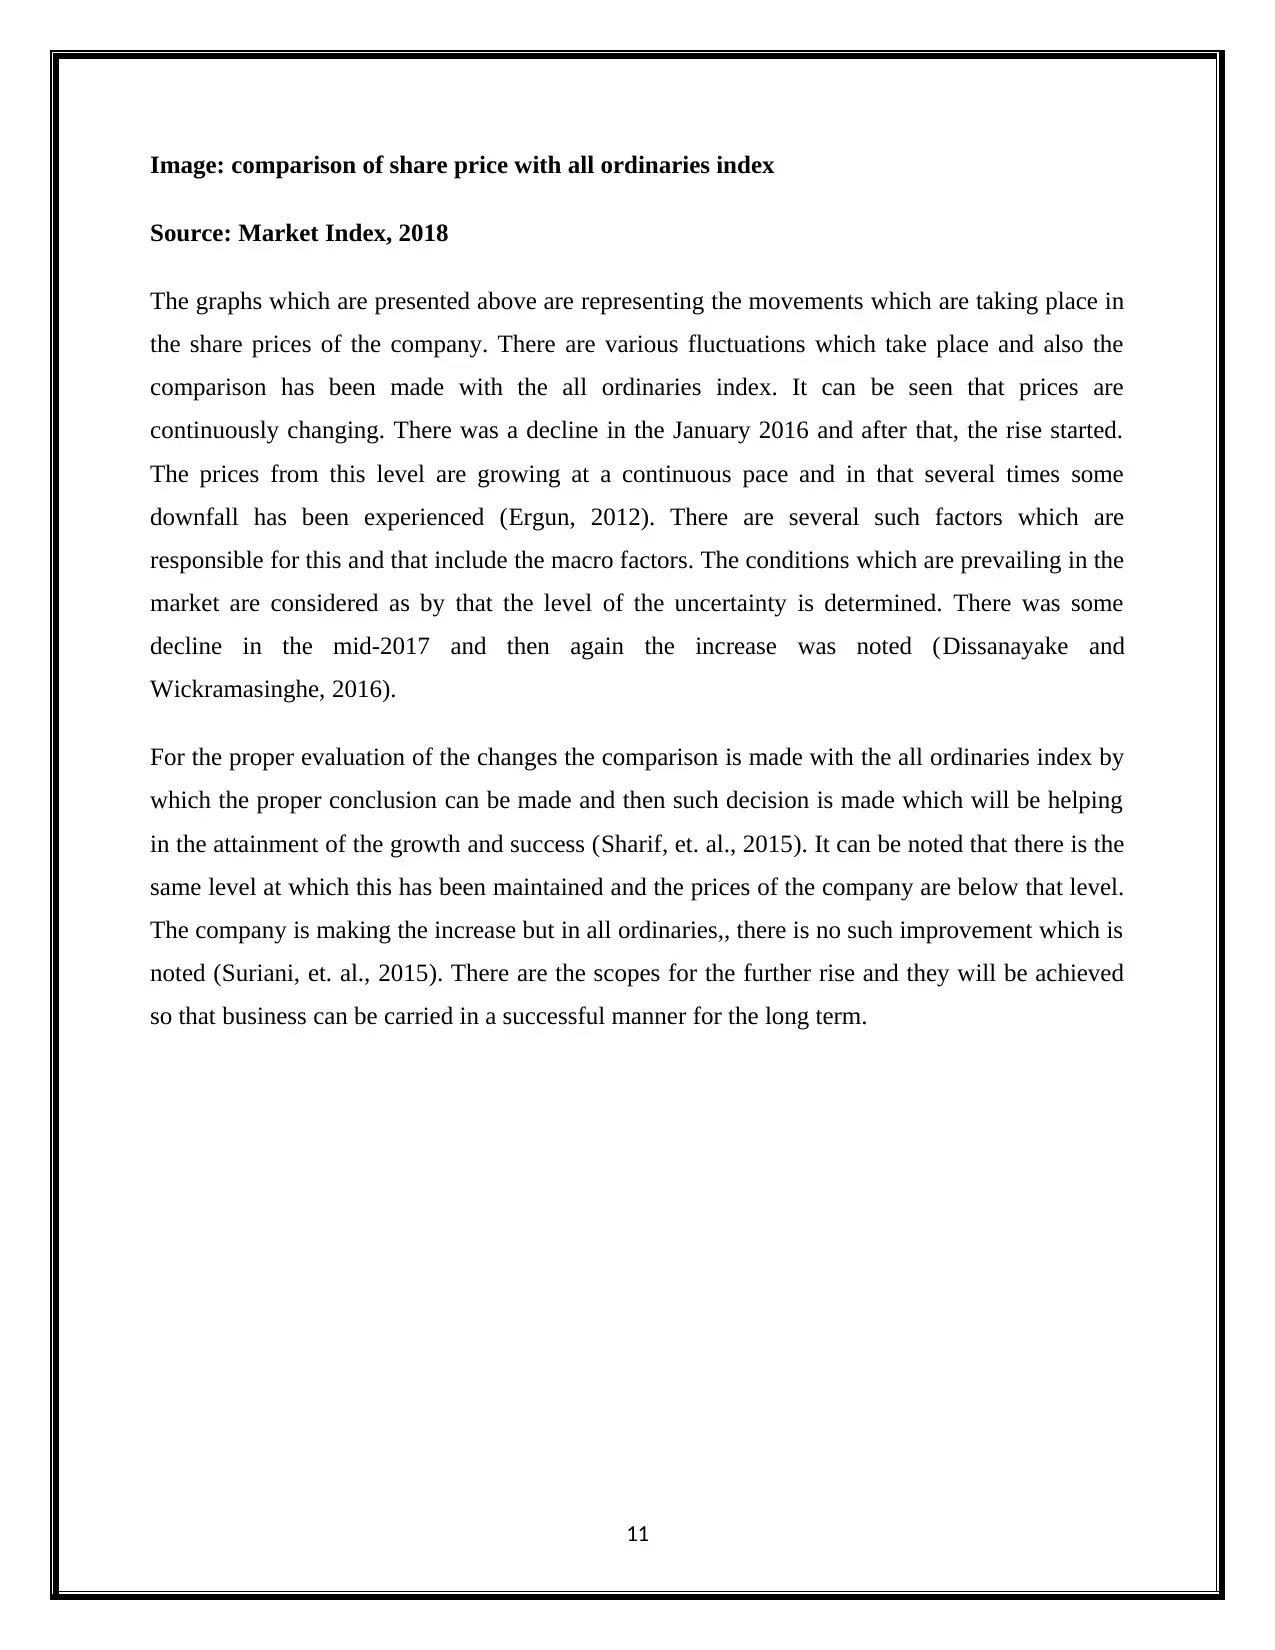
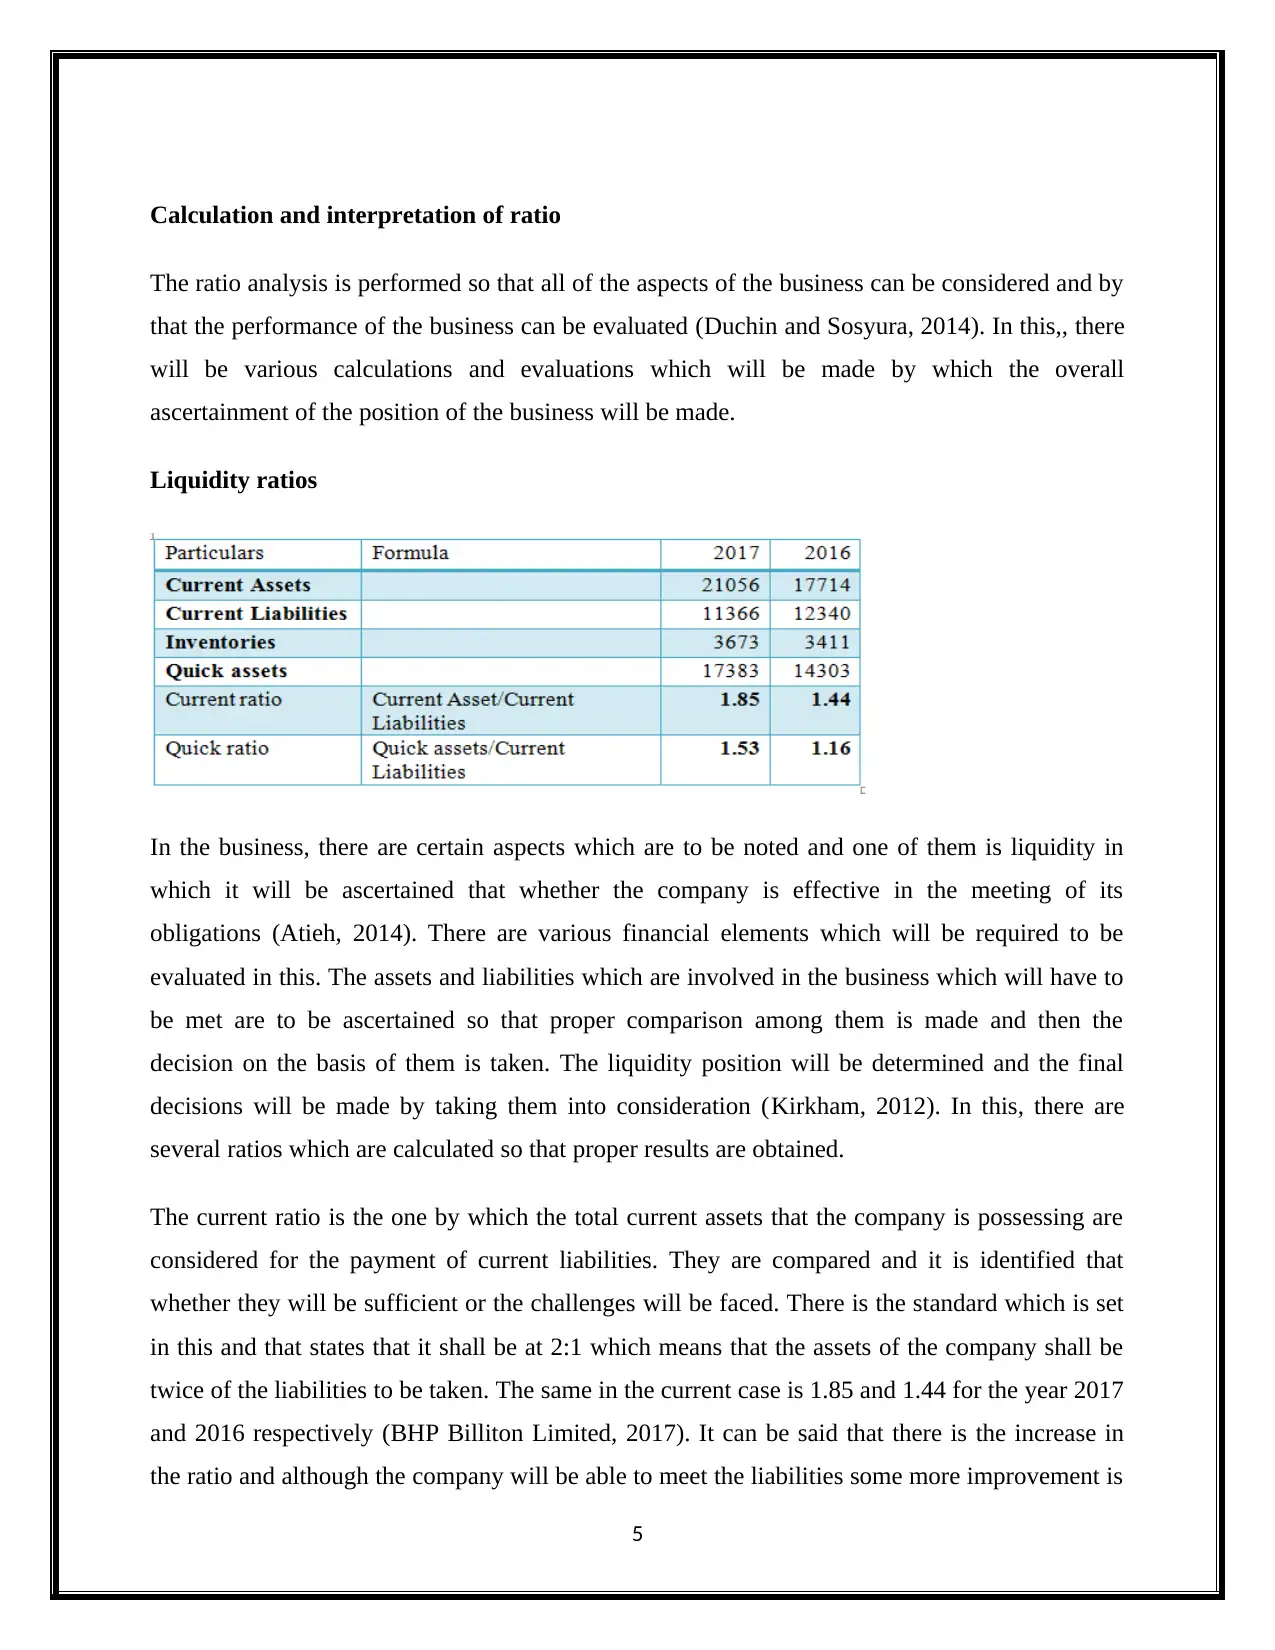
Image: comparison of share price with all ordinaries index
Source: Market Index, 2018
The graphs which are presented above are representing the movements which are taking place in
the share prices of the company. There are various fluctuations which take place and also the
comparison has been made with the all ordinaries index. It can be seen that prices are
continuously changing. There was a decline in the January 2016 and after that, the rise started.
The prices from this level are growing at a continuous pace and in that several times some
downfall has been experienced (Ergun, 2012). There are several such factors which are
responsible for this and that include the macro factors. The conditions which are prevailing in the
market are considered as by that the level of the uncertainty is determined. There was some
decline in the mid-2017 and then again the increase was noted (Dissanayake and
Wickramasinghe, 2016).
For the proper evaluation of the changes the comparison is made with the all ordinaries index by
which the proper conclusion can be made and then such decision is made which will be helping
in the attainment of the growth and success (Sharif, et. al., 2015). It can be noted that there is the
same level at which this has been maintained and the prices of the company are below that level.
The company is making the increase but in all ordinaries,, there is no such improvement which is
noted (Suriani, et. al., 2015). There are the scopes for the further rise and they will be achieved
so that business can be carried in a successful manner for the long term.
11
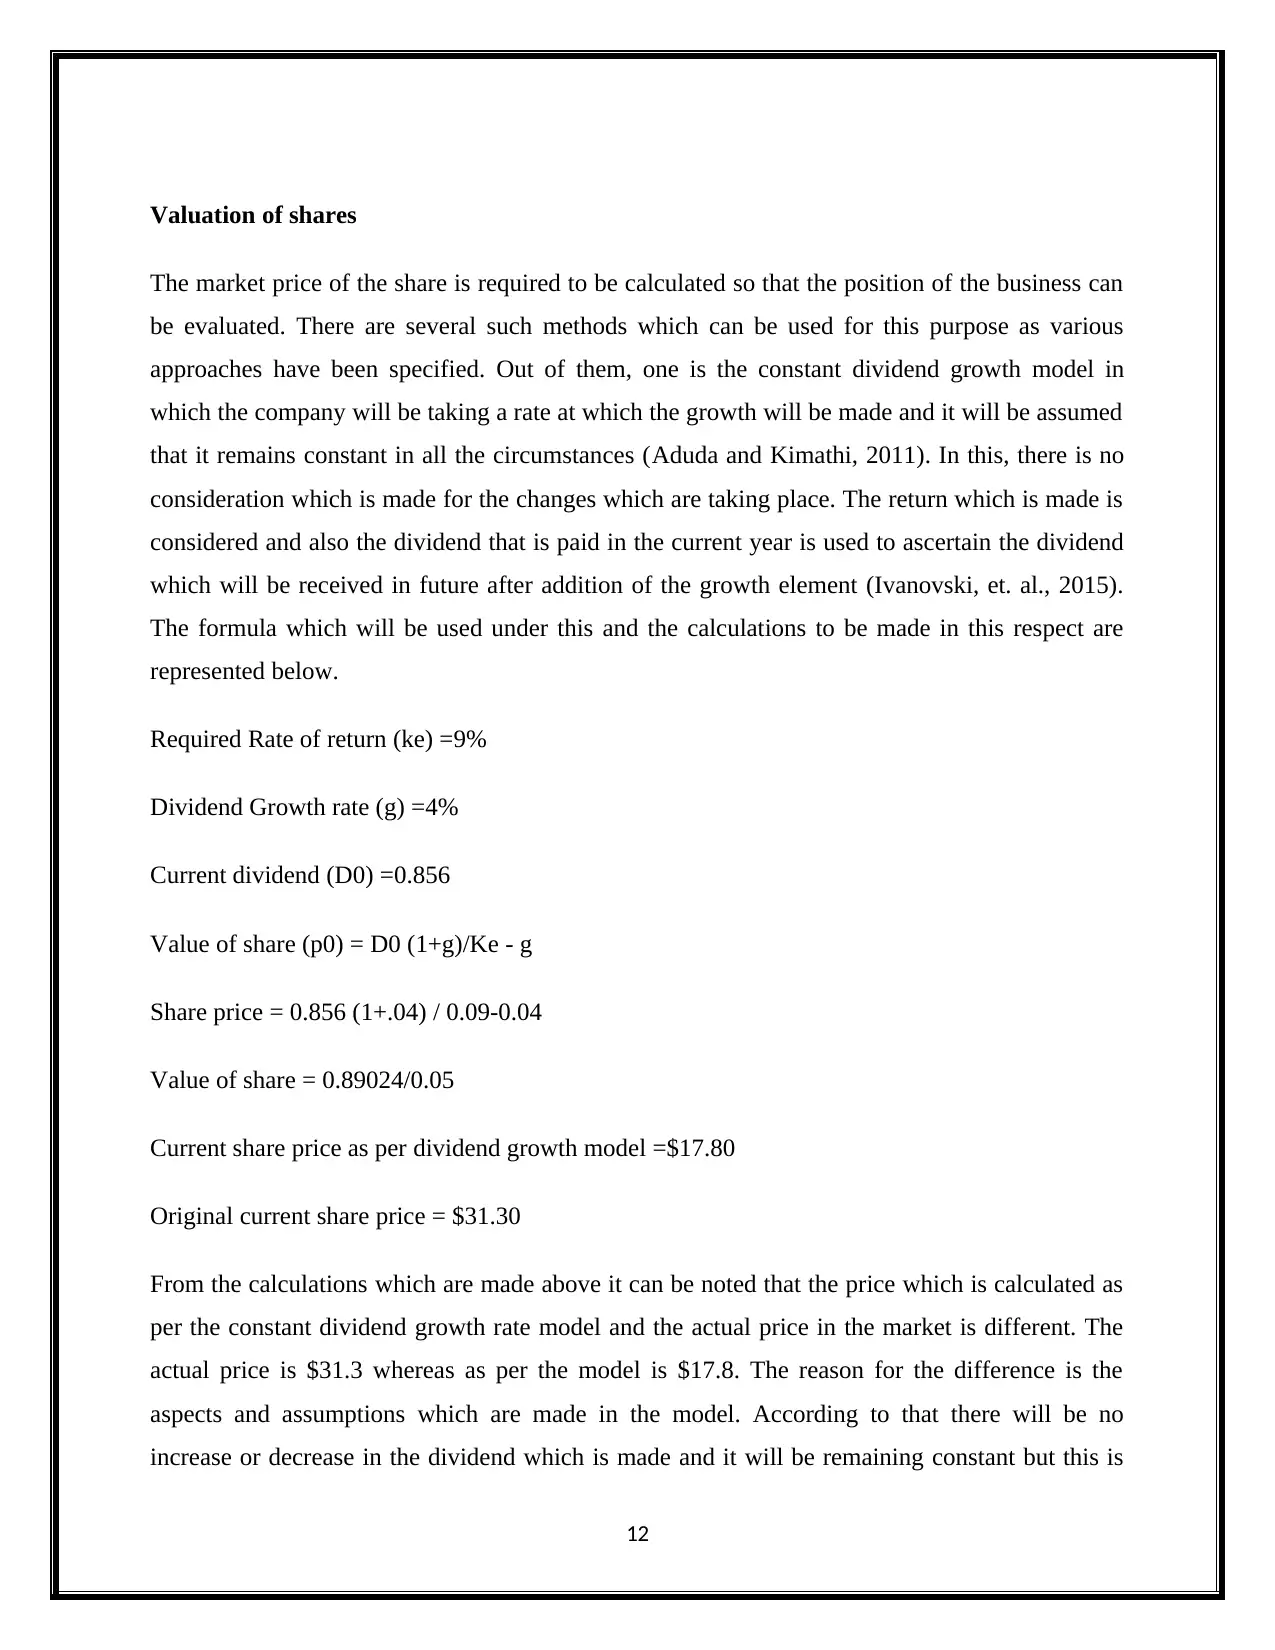
Valuation of shares
The market price of the share is required to be calculated so that the position of the business can
be evaluated. There are several such methods which can be used for this purpose as various
approaches have been specified. Out of them, one is the constant dividend growth model in
which the company will be taking a rate at which the growth will be made and it will be assumed
that it remains constant in all the circumstances (Aduda and Kimathi, 2011). In this, there is no
consideration which is made for the changes which are taking place. The return which is made is
considered and also the dividend that is paid in the current year is used to ascertain the dividend
which will be received in future after addition of the growth element (Ivanovski, et. al., 2015).
The formula which will be used under this and the calculations to be made in this respect are
represented below.
Required Rate of return (ke) =9%
Dividend Growth rate (g) =4%
Current dividend (D0) =0.856
Value of share (p0) = D0 (1+g)/Ke - g
Share price = 0.856 (1+.04) / 0.09-0.04
Value of share = 0.89024/0.05
Current share price as per dividend growth model =$17.80
Original current share price = $31.30
From the calculations which are made above it can be noted that the price which is calculated as
per the constant dividend growth rate model and the actual price in the market is different. The
actual price is $31.3 whereas as per the model is $17.8. The reason for the difference is the
aspects and assumptions which are made in the model. According to that there will be no
increase or decrease in the dividend which is made and it will be remaining constant but this is
12
⊘ This is a preview!⊘
Do you want full access?
Subscribe today to unlock all pages.
Trusted by 1+ million students worldwide
1 out of 17
Related Documents


Your All-in-One AI-Powered Toolkit for Academic Success.
+13062052269
info@desklib.com
Available 24*7 on WhatsApp / Email
![[object Object]](/_next/static/media/star-bottom.7253800d.svg)
Unlock your academic potential
Copyright © 2020–2026 A2Z Services. All Rights Reserved. Developed and managed by ZUCOL.